
TL;DR
- Forecast revenue, expenses, and cash flow in one automated view
- Model best/base/worst case scenarios without rebuilding spreadsheets
- Track burn rate and cash runway in real-time from QuickBooks Online
- Built for fractional CFOs, controllers, and SMB finance teams
- Updates automatically. Spend 30 seconds refreshing instead of 20 hours rebuilding
Overview of the CFO Forecasting Dashboard Template
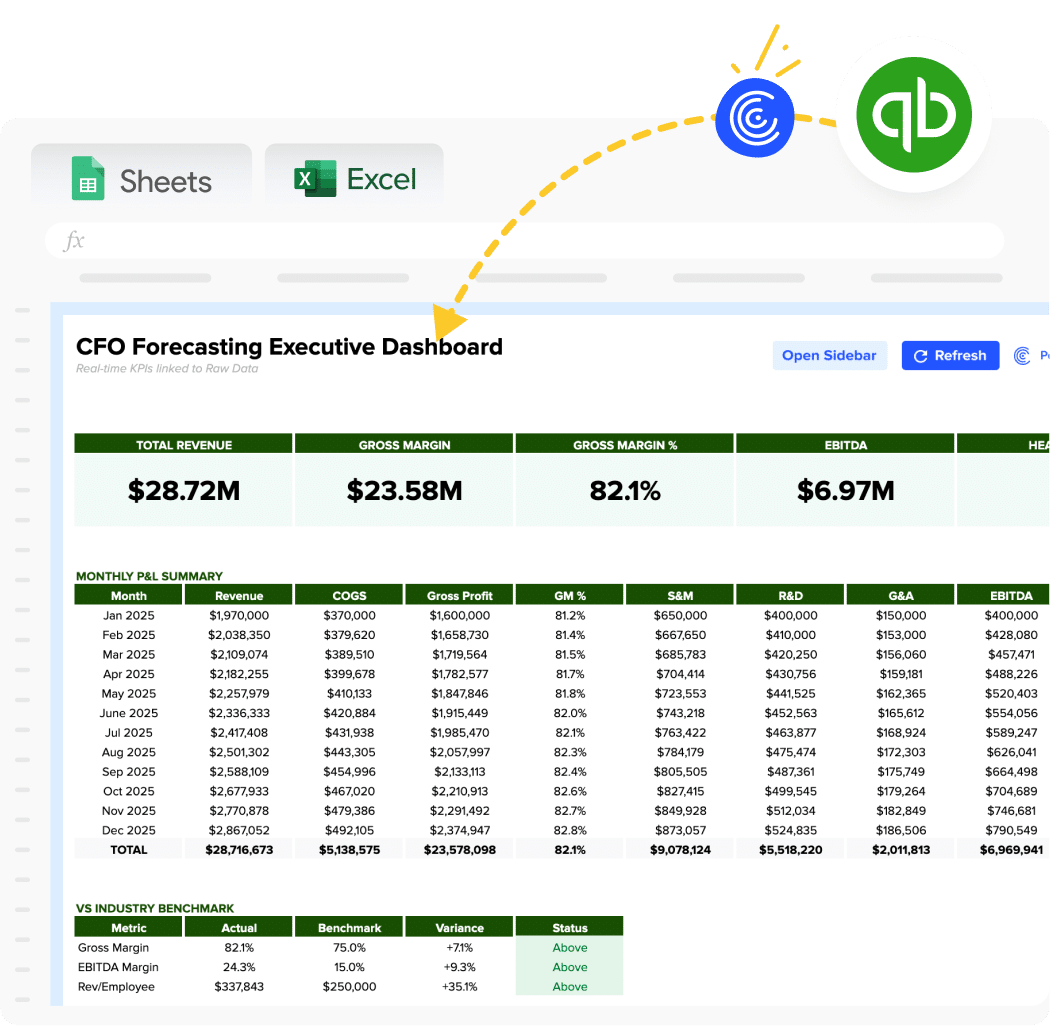
A CFO forecasting dashboard connects to your accounting system and turns historical actuals into forward-looking projections. Instead of manually exporting data and building forecast models each month, this template pulls live data, maintains your assumptions, and updates your rolling forecast automatically.
Built specifically for companies who need more than basic bookkeeping but aren’t ready for enterprise FP&A software.
Benefits of Using Coefficient-Powered Dashboards
Live data, zero manual work – Your actuals update automatically from your accounting system. No more CSV exports, copy-pasting, or broken formulas.
Spreadsheet-native design – Works in Google Sheets and Excel—tools your team already knows. No new platforms to learn or adopt.
Built for multi-client workflows – Fractional CFOs can replicate this template across 10+ clients. Connect each client’s data source, and their unique numbers populate automatically.
Scenario modeling that actually works – Change one assumption and watch your entire forecast recalculate instantly. Model “what-if” scenarios in real-time during board meetings.
Scheduled refreshes run on autopilot – Set your refresh schedule once. Data updates automatically while you sleep. Check your dashboard each morning with yesterday’s actuals already loaded.
| Feature | Coefficient Template | Manual Excel | Any Dedicated BI or Visualization Tool |
| Primary Use | Live forecasting with auto-refresh | Static forecast models | Data visualization & BI |
| Setup Time | 2-3 hours | Build from scratch each time | Weeks (data modeling required) |
| Cost | Free – $49/user/month | Free (but 20 hours/month labor) | $10-70/user/month + consultant fees |
| Data Updates | Automatic refresh from source | Manual CSV export/paste | Automatic (once configured) |
| Forecast Modeling | Built-in scenario templates | Build formulas yourself | Requires DAX/calculated fields |
| Multi-Entity Support | Yes (import multiple QBO files) | Manual consolidation | Yes (complex data modeling) |
| Best For | SMBs needing speed + flexibility | Ad-hoc one-time forecasts | Enterprises with dedicated BI teams |
| Learning Curve | Spreadsheet-native (easy) | You already know Excel | Steep (new tool to learn) |
What’s Inside the Template
Financial Performance Section:
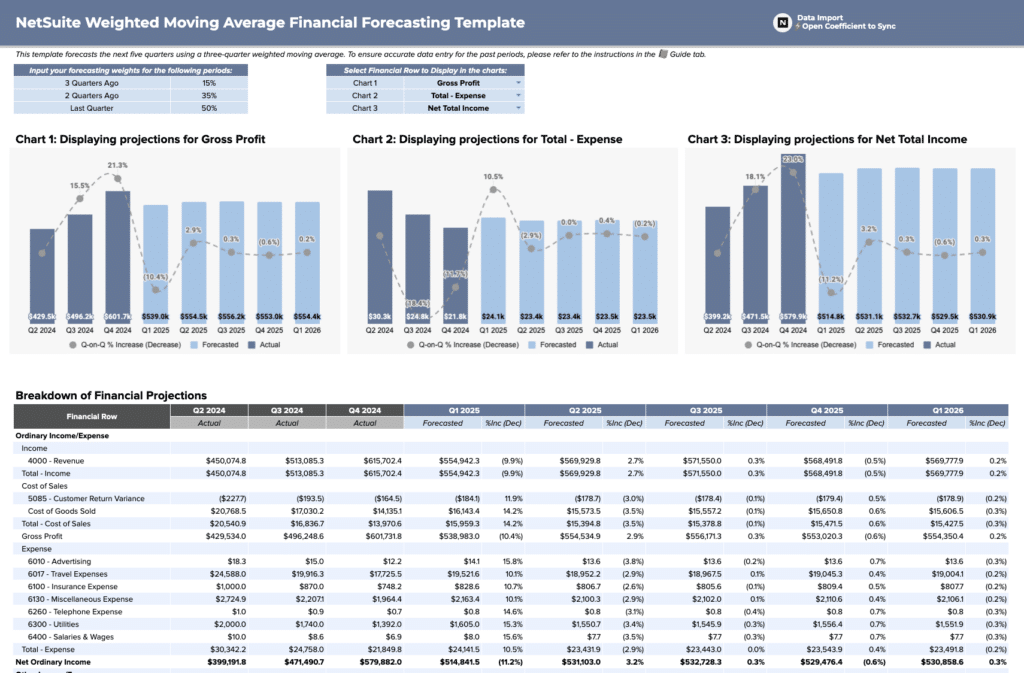
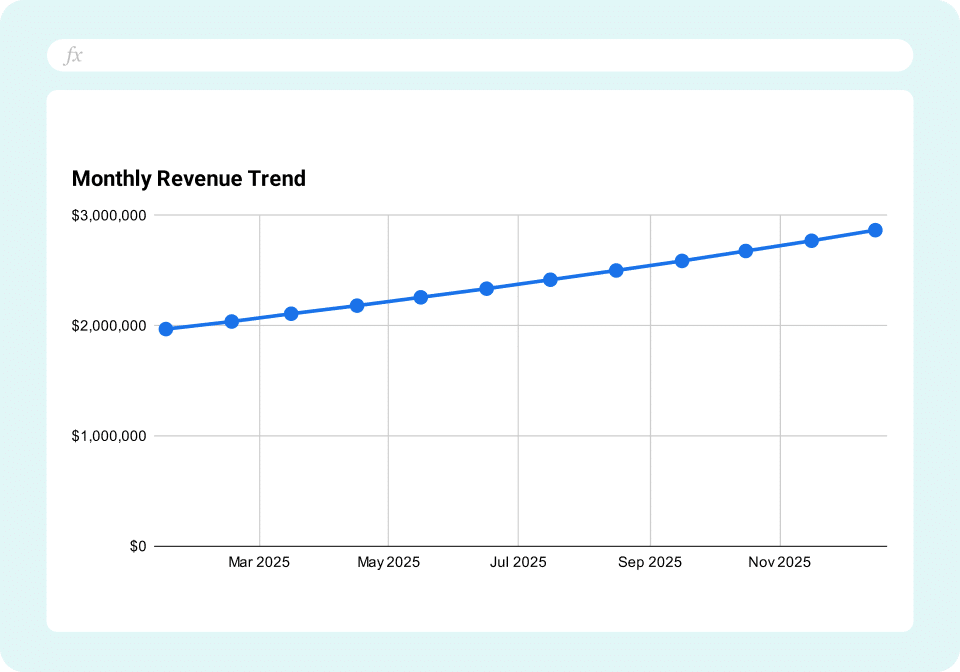
- Rolling 12-month revenue forecast with actuals overlay
- Monthly expense projections by category (COGS, OpEx, CapEx)
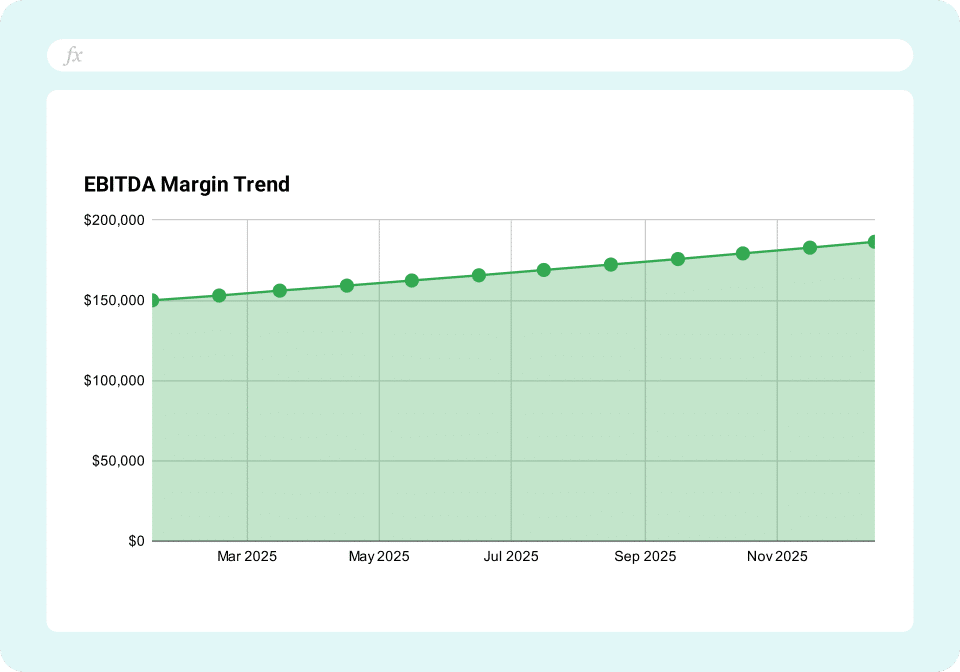
- EBITDA and net income forecast vs actual
- Department-level budget vs actual variance
Cash Flow & Runway:
- Cash balance tracking across accounts
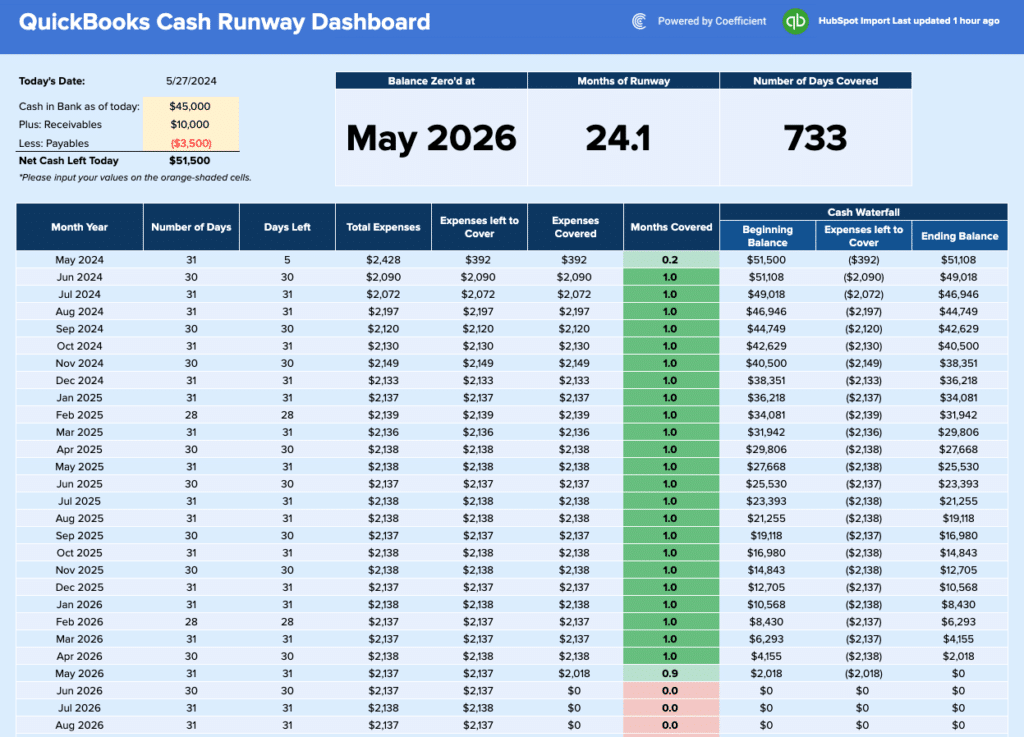
- Monthly burn rate calculation (operating cash outflow)
- Cash runway (months of operations remaining)
- Working capital requirements forecast
Scenario Modeling:
- Best case / Base case / Worst case revenue scenarios
- Sensitivity analysis for key variables (pricing, close rate, churn)
- Scenario comparison view for board presentations
Key Financial Ratios:
- Gross margin trend
- Operating margin
- CAC payback period (for growth companies)
- Quick ratio and current ratio forecast
Board Meeting Summary:
- Executive KPI scorecard
- YoY and QoQ growth rates
- Key variance explanations
- Forecast accuracy tracking
How to Use This Template
Step 1: Get the template
Sign up with your work email to access the dashboard. Choose to open in Excel Online or make a Google Sheets copy—whichever you prefer.
Step 2: Install Coefficient
The template comes pre-built with structure and formulas. Install the Coefficient add-in to activate live data connections. It takes 30 seconds and works right inside your spreadsheet.
Step 3: Connect your accounting system
Link QuickBooks Online with Sheets or Excel with one-click OAuth. Your credentials stay secure. Coefficient never stores passwords.
Step 4: Import historical data
Pull 12-18 months of P&L, Balance Sheet, and Cash Flow history from your QBO Account. This populates your actuals automatically and forms the baseline for forecasting.
Step 5: Add your forecast assumptions
Input growth rates, hiring plans, and pricing changes in the dedicated assumptions sheet. The forecast recalculates automatically based on your inputs.
Step 6: Build scenario models
Toggle between best/base/worst case scenarios. Each scenario adjusts your forecast instantly without rebuilding anything.
Step 7: Schedule automatic refreshes
Set daily, weekly, or monthly data refreshes. Your actuals stay current without manual exports or copy-pasting.