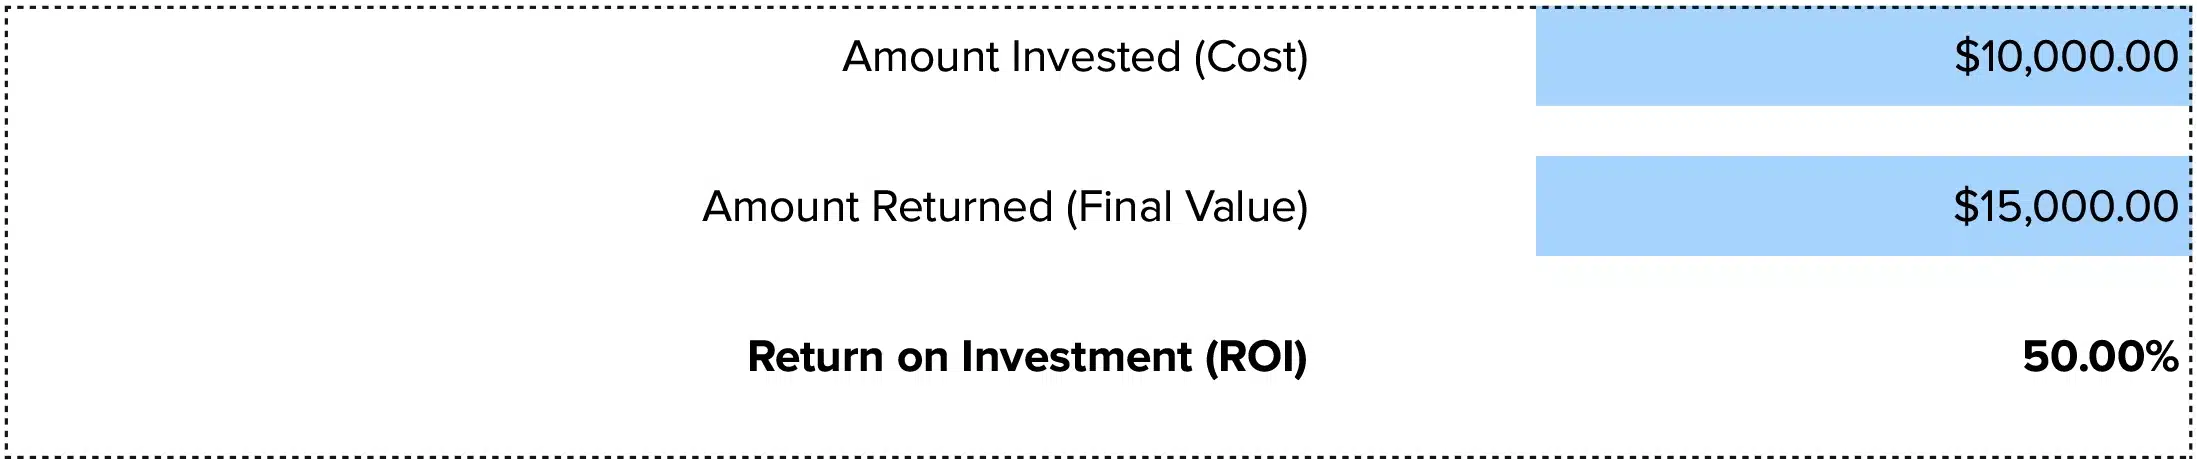


ROI = (Net Profit / Cost of Investment) × 100
This free ROI calculator cuts the math. Track one deal or watch big trends. Learn to calculate, read numbers, and track ROI the right way.
Get more done with less work. We made a free Excel and Google Sheets template you can grab and use today.
ROI Formula Explained
ROI = (Net Profit / Cost of Investment) × 100
Let’s break down each part:
Net Profit: This is what you keep after all costs are paid. Start with your total gains from the investment. Then subtract every cost tied to it. This means the initial investment, ongoing expenses, and hidden costs like time and resources. Net profit is real money left in your pocket.
Cost of Investment: The total amount you put in up front. This includes purchase price, setup costs, training expenses, and any other money spent to get the investment running. Some firms add the cost of capital—what you could have earned if you put that money somewhere else.
Multiply by 100: This turns your ratio into a percentage. A result of 0.5 becomes 50%. This makes it easy to compare one investment to another. It also helps you explain results to teams who don’t work with finance.
We express ROI as a percentage because it works across any deal size. A 25% ROI on a $10,000 project tells the same story as 25% on a $1 million budget. The formula excludes sunk costs—money you already spent that won’t come back. This keeps focus on future value, not past regrets.
What Is ROI?
ROI measures how much profit you make for each dollar you invest. It answers one question: did this investment pay off? You take what you earned, subtract what you spent, then divide by what you spent. The result shows if you gained or lost money.
Firms use ROI to compare options. Say you have $50,000 to spend. Project A might return 40% while Project B returns 15%. ROI helps you pick the winner. It also shows when to cut losses. If an investment keeps losing money, ROI makes that clear fast.
Who uses this metric?
CFOs and Controllers track ROI across all major investments to guide budget decisions and resource allocation.
Fractional CFOs monitor ROI for multiple clients, comparing performance across different businesses and industries.
Financial Analysts use ROI to build models, forecast returns, and recommend which projects deserve funding.
Marketing Teams calculate ROI on campaigns to prove which channels drive real profit, not just clicks.
Operations Managers measure ROI on process improvements, equipment, and technology upgrades to justify spending.
How to Calculate ROI: Step-by-Step
Let’s work through a real example. You want to buy software that automates your invoicing.
- Identify your total investment cost
The software costs $15,000. You spend $3,000 on setup and training. Your team spends 40 hours getting it running at $2,000 in labor. Total investment: $20,000.
- Track the time period
You’ll measure ROI over one year. This gives the software time to show results. Shorter periods can miss the full benefit.
- Calculate total gains
The software saves your team 15 hours per week on manual work. At $50 per hour, that’s $750 weekly. Over 52 weeks: $39,000 in labor savings. You also avoid $2,000 in late payment fees. Total gains: $41,000.
- Calculate net profit
Subtract your investment from gains: $41,000 – $20,000 = $21,000 net profit. This is actual money you made from this decision.
- Apply the ROI formula
Divide net profit by investment: $21,000 ÷ $20,000 = 1.05. Multiply by 100: 105% ROI.
- Interpret your result
A 105% ROI means you more than doubled your money. For every $1 invested, you got back $1 plus another $1.05 in profit. This is a strong return that justifies the investment.
How to Interpret Your ROI Number
| ROI Range | Interpretation | Recommended Actions |
| Below 0% | Loss – You spent more than you gained. Investment destroyed value. | • Stop the project if possible<br>• Investigate what went wrong<br>• Document lessons learned<br>• Cut losses rather than add more money |
| 0% – 10% | Weak return – Barely broke even. Opportunity cost makes this poor. | • Review if hidden costs eat gains<br>• Compare to simpler alternatives<br>• Consider redeploying capital<br>• Set deadline to improve or exit |
| 10% – 25% | Moderate return – Acceptable for low-risk but below growth targets. | • Monitor quarterly for improvement<br>• Look for ways to increase gains<br>• Benchmark against industry<br>• Evaluate if risk matches return |
| 25% – 50% | Good return – Solid performance beating many baseline investments. | • Continue current strategy<br>• Document what’s working<br>• Look for similar opportunities<br>• Share learnings across teams |
| Above 50% | Excellent return – Strong performance beating alternatives. | • Protect this investment<br>• Analyze success factors<br>• Check if sustainable long-term<br>• Look for ways to scale |
Context matters. A 15% ROI on safe investment might beat risky project returning 40%. Compare your ROI to what you could earn elsewhere with similar risk. Also consider time. A 20% ROI over one year beats 20% over five years.
ROI Benchmarks by Industry
ROI varies widely across industries because business models differ. Capital-intensive industries like manufacturing show lower ROI but stable returns. Service businesses often show higher ROI because they need less upfront capital.
| Industry | Typical ROI Range | Notes |
| Software/SaaS | 30% – 60% | High margins and recurring revenue drive strong returns. Customer acquisition cost heavily impacts ROI. |
| Professional Services | 25% – 45% | Labor-focused model with minimal inventory. ROI depends on utilization rates and billing efficiency. |
| Healthcare Services | 15% – 35% | Regulatory requirements and equipment costs reduce margins. Reimbursement models affect returns. |
| Retail | 10% – 25% | Inventory costs and thin margins create challenges. Location and supply chain drive results. |
| Manufacturing | 8% – 20% | Heavy capital investment in equipment. Economies of scale improve ROI over time. |
| Real Estate | 12% – 25% | Property appreciation and rental income combine for returns. Leverage affects calculations. |
| Marketing Campaigns | 200% – 500% | Good campaigns return $2-$5 for every $1 spent. Digital channels show higher, trackable ROI. |
These benchmarks come from public financial data and industry reports. Your results will vary based on business model, market position, and execution. Use these as rough guides, not absolute targets.
Benchmark Citations
NYU Stern Margin/ROIC by Sector Data
NetSuite Ultimate Guide to ROI
Automating ROI Tracking with Coefficient
Stop pulling CSV exports from your ERP every month to update ROI spreadsheets. Coefficient links your data systems straight to Excel or Google Sheets. Revenue, costs, and ROI formulas refresh on schedule.
Save 2-3 hours per reporting cycle. Kill copy-paste errors. See current numbers any time. Perfect for CFOs tracking ROI across multiple projects.
Get started with Coefficient and turn spreadsheets into live ROI dashboards.
How to Improve Your ROI
Weak ROI signals opportunity. Here are five proven ways to boost returns:
Cut unnecessary costs
Audit every expense tied to the investment. Cancel unused subscriptions. Renegotiate vendor contracts. Remove redundant processes. Cutting 10% from costs adds 10% to ROI. Start with easiest wins.
Speed up time to value
The faster you see gains, the better your ROI. If a project takes 18 months instead of 12, ROI drops. Set aggressive timelines. Remove bottlenecks. Get to revenue or savings sooner.
Increase utilization rates
Many investments sit idle part-time. A $50,000 machine used 50% earns half what it could. Push utilization higher through better scheduling, training, or process changes. Every hour of increased use improves ROI.
Find secondary benefits
Look for hidden value your investment creates. That invoicing software might also improve cash flow forecasting. New equipment might reduce error rates. Stack these benefits into your ROI calculation.
Scale what works
Once you prove ROI on small scale, expand it. If one location returns 40% ROI, roll it out to five more. If one team benefits, train others. Scaling proven winners compounds returns fast.
ROI vs. ROAS vs. ROIC
These three metrics measure returns but focus on different things. Knowing which to use prevents confusion.
ROI (Return on Investment)
ROI measures overall profitability from any investment. It includes all costs and all profits. Use ROI when comparing completely different investment types—like choosing between new software and new equipment.
ROAS (Return on Ad Spend)
ROAS looks only at advertising revenue vs. ad costs. It ignores other expenses like product costs or fulfillment. ROAS = Revenue from Ads ÷ Ad Spend × 100. Use ROAS to optimize ad campaigns and compare channels like Google Ads vs. Facebook Ads.
ROIC (Return on Invested Capital)
ROIC measures how well a company uses all capital—debt and equity—to generate profits. It’s calculated as: ROIC = Net Operating Profit After Tax ÷ Invested Capital. Use ROIC to evaluate overall company performance or compare different companies.
When to use which metric
Here’s a practical example: You run a $10,000 ad campaign generating $40,000 in revenue. ROAS is 400%. But products sold cost $25,000 to make and fulfill, plus $5,000 overhead. Actual profit is $10,000. ROI is 100%. ROAS looks good, but ROI tells the real story.
Pro tip for fractional CFOs: Present all three metrics when relevant. “Your ROAS of 350% looks strong, but ROI is only 75% because product costs are high. Let’s focus on improving margins, not just ad performance.”
Make every dollar count
ROI shows what works and what doesn’t. Calculate it right. Track it over time. Use it to guide where you spend next. Every investment should defend its ROI against alternatives.Stop tracking ROI in static spreadsheets. Get started with Coefficient and build dashboards that update themselves.
 Sync Live Finance Data into Your Spreadsheet


