
TL;DR
- Combine P&L, Balance Sheet, Cash Flow, and AR/AP in one view
- Auto-refresh eliminates manual exports and copy-paste errors
- Compare periods (MoM, YoY, Budget vs Actual) instantly
- Add non-QBO data (budget, forecast, CRM metrics) in the same dashboard
- Built for accounting firms, controllers, and small business owners
What is a Financial Reporting Dashboard?
A financial reporting dashboard displays your core financial statements like P&L, Balance Sheet, Cash Flow along with key ratios and metrics in one live spreadsheet. Instead of exporting reports individually and duct-taping them into a monthly package, everything updates automatically when new transactions post.
Think of it as “QuickBooks reports, but actually useful for analysis.”
Benefits of Using Coefficient-Powered Dashboards
Eliminate the monthly rebuild – Traditional process takes 3-4 hours of exporting, pasting, and formatting. With live data connections, click refresh and you’re done in 30 seconds.
Keep working in spreadsheets – Your team already knows Google Sheets and Excel. Why force them to learn Power BI or Tableau when you can automate the tools they’re already comfortable with?
Scale across multiple clients – Accounting firms: Build this once, replicate it for every client. Connect their QuickBooks account and their financial data populates automatically. No rebuilding from scratch.
Combine multiple data sources – Layer QuickBooks financials with Stripe revenue, Salesforce pipeline, or operational metrics from other systems. All in one unified dashboard.
Preserve your customizations – Add your own formulas, charts, and formatting. Data refreshes don’t break your custom work. Everything stays intact.
| Feature | Coefficient Spreadsheet Dashboard | Manual QBO Exports | Any Dedicated Bi or Visualization Tool |
| Primary Use | Financial reporting in spreadsheets | Ad-hoc QBO reports | Enterprise data visualization |
| Setup Time | 1-2 hours | Rebuild monthly | Days/weeks (data modeling) |
| Cost | Free – $49/month | Free (but 4-5 hours monthly labor) | $10-70/user/month + setup costs |
| Data Freshness | Auto-refresh (hourly/daily) | Stale until you re-export | Auto-refresh (once configured) |
| Customization | Full spreadsheet flexibility | Limited to QBO formats | Requires learning new tool |
| Multi-Entity | Yes (connect multiple QBO accounts) | Manual consolidation per entity | Yes (complex data pipelines) |
| Budget Integration | Easy (import from any source) | Manual side-by-side comparison | Requires budget data source setup |
| Best For | SMBs, accounting firms, controllers | One-off reports | Large enterprises with BI teams |
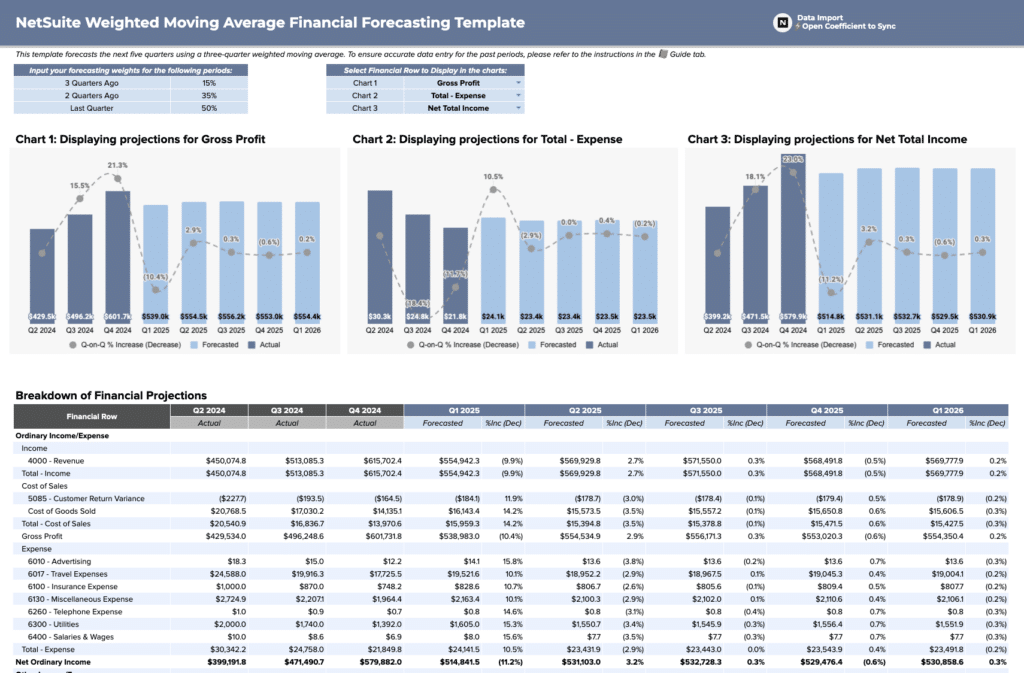
What’s Inside the Template
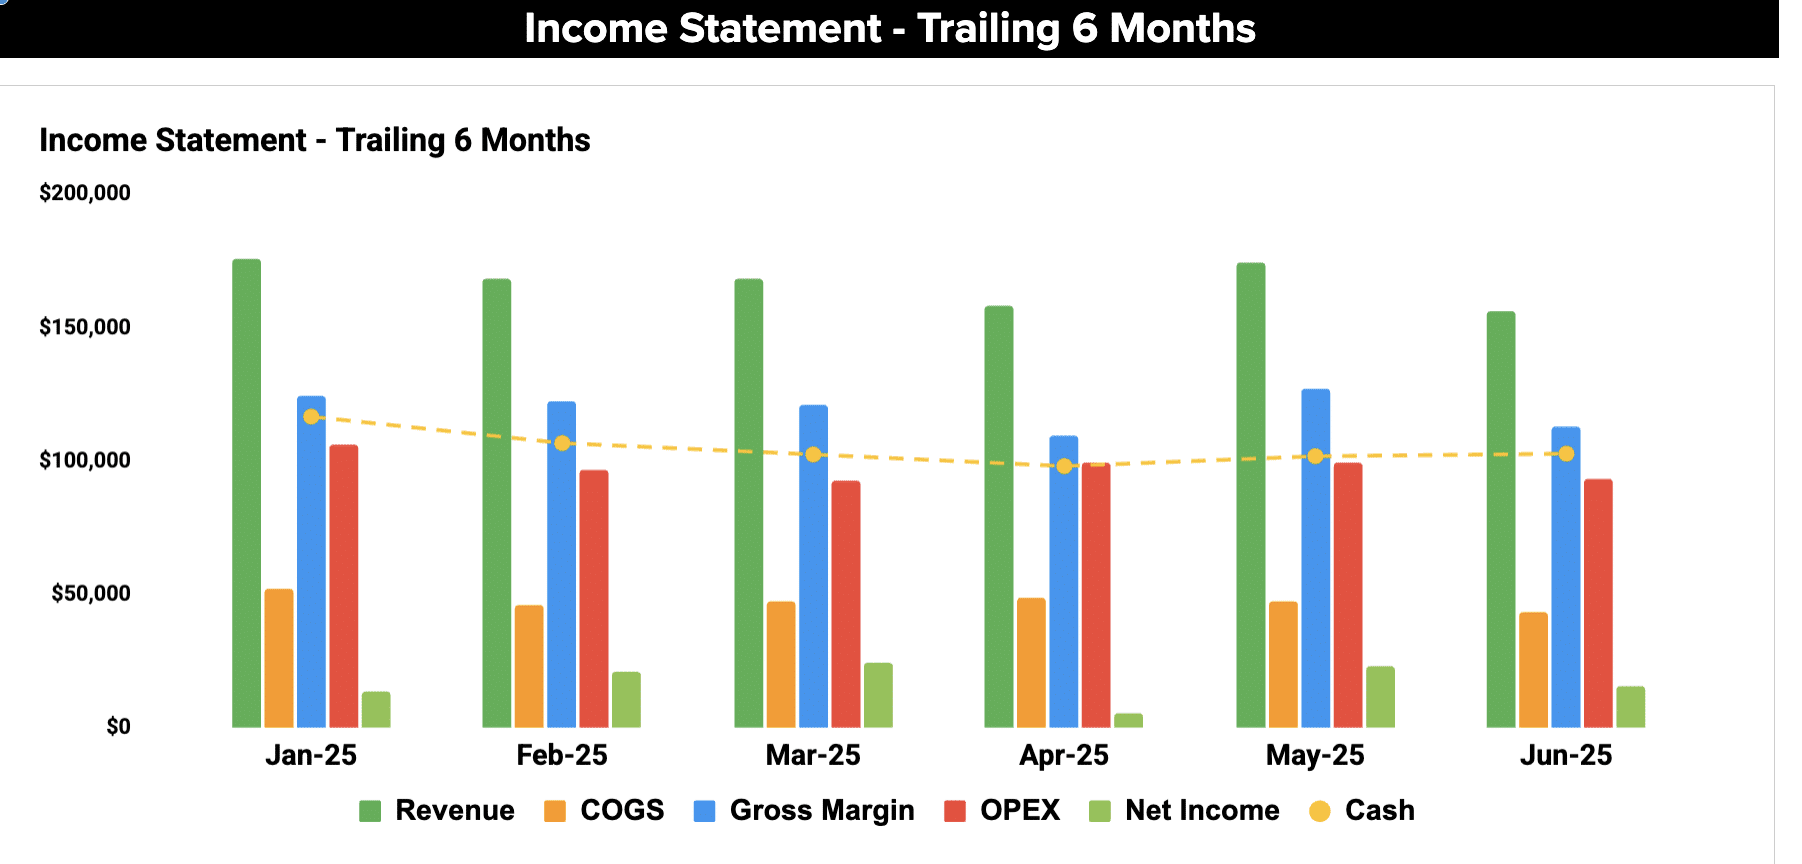
Income Statement (P&L):
- Revenue by month and YTD
- Cost of Goods Sold breakdown
- Operating expenses by category
- Gross margin, operating margin, net margin
- MoM and YoY comparison columns
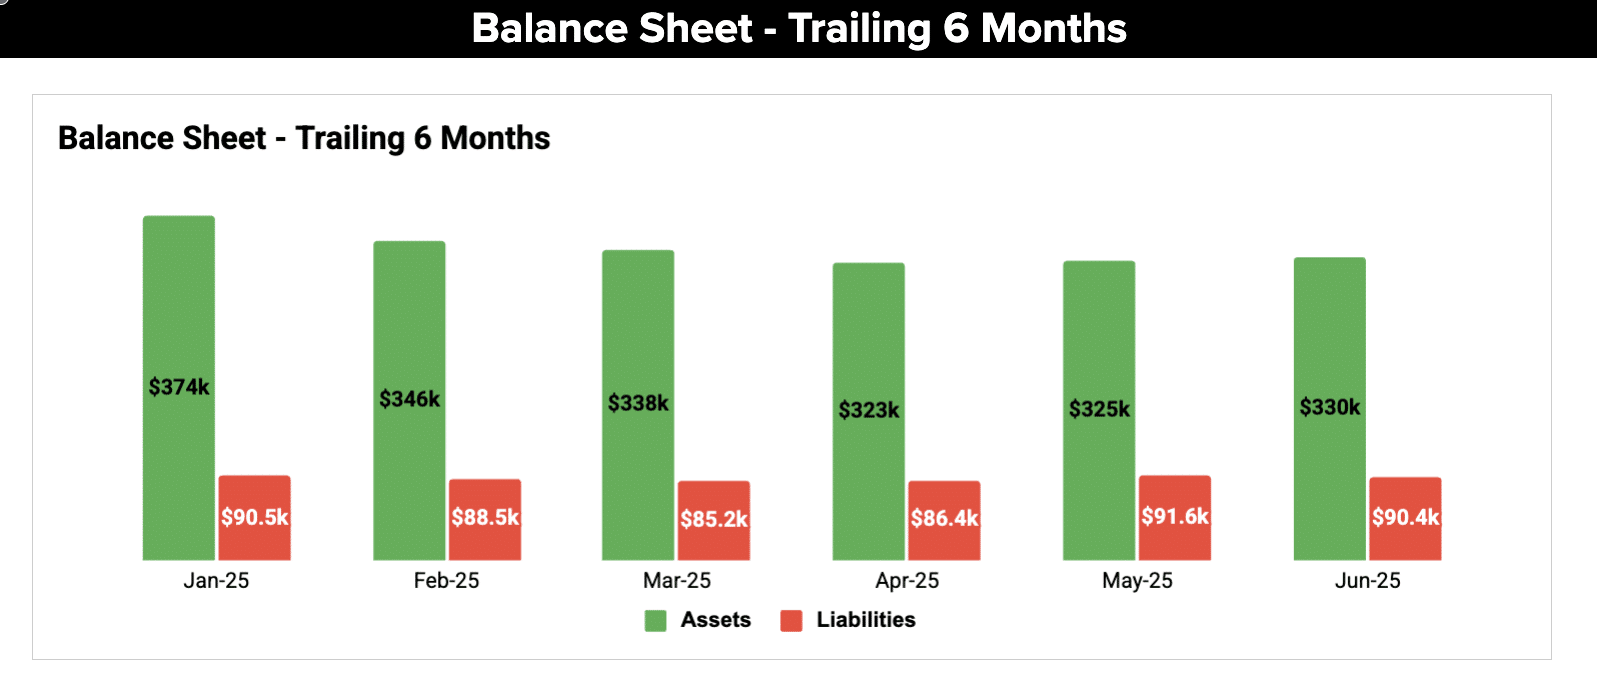
Balance Sheet:
- Assets (current + fixed)
- Liabilities (current + long-term)
- Equity
- Period-over-period changes
- Key ratios (current ratio, quick ratio, debt-to-equity)
Cash Flow Statement:
- Operating activities cash flow
- Investing activities
- Financing activities
- Net cash change
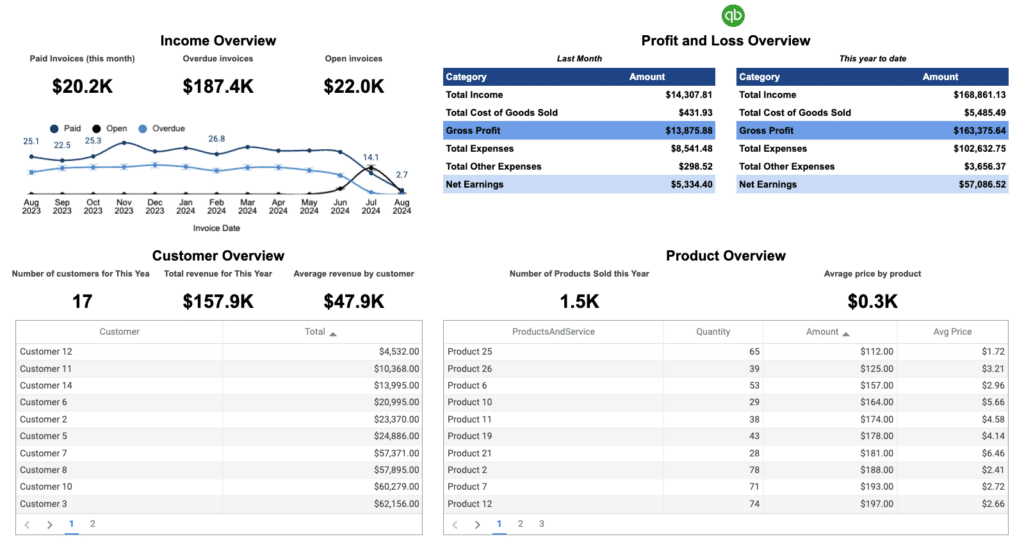
Accounts Receivable:
- AR aging summary (current, 30-day, 60-day, 90+)
- Top customers by outstanding balance
- Days Sales Outstanding (DSO) calculation
Accounts Payable:
- AP aging summary
- Top vendors by amount owed
- Days Payable Outstanding (DPO)
Financial Ratios Dashboard:
- Liquidity ratios (current, quick)
- Profitability ratios (gross margin, net margin, ROA)
- Efficiency ratios (asset turnover, inventory turnover)
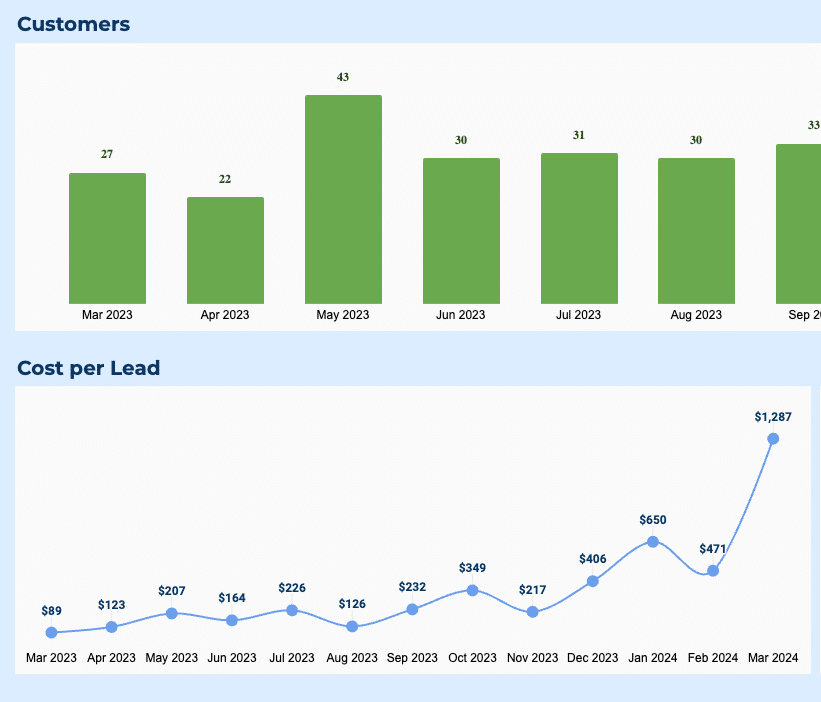
Revenue & Expense Analysis:
- Top 10 customers by revenue
- Top 10 expense categories
- Revenue trends over 12 months
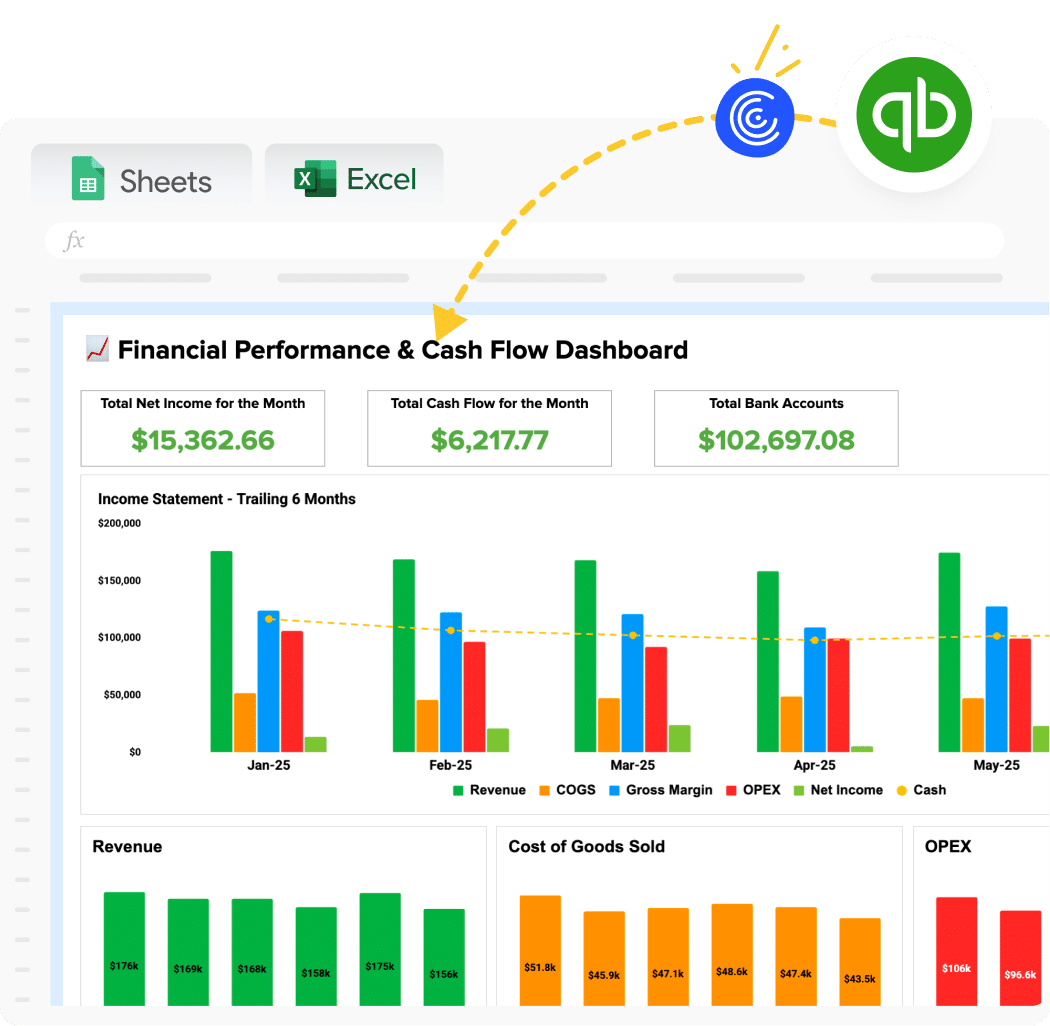
How to Use This Template
Step 1: Get the template
Enter your work email to unlock the dashboard. Choose Excel or Google Sheets template to work with.
Step 2: Install Coefficient Add-on for Google Sheets / Excel
Once you have your copy, install Coefficient inside your spreadsheet. It’s a free add-in that powers the live data connection. No separate app needed. Everything runs inside Sheets or Excel.
Step 3: Connect QuickBooks Online
Open Coefficient in your Sheets or Excel. Click “Import from” → QuickBooks Online → Authorize. Coefficient uses secure authentication.
Step 4: Import your core reports
Select which reports to pull: P&L, Balance Sheet, Cash Flow Statement, AR Aging, AP Aging. Choose your date range and accounting method (cash or accrual).
Step 5: Set up period comparisons
Add date filters for month-over-month, year-over-year, or custom comparisons. The dashboard structure adapts automatically when you change date ranges.
Step 6: (Optional) Layer in budget data
Import your budget from Excel, Google Sheets, or another source. Build Budget vs Actual views using simple spreadsheet formulas.
Step 7: Schedule automatic refreshes
Configure daily, weekly, or monthly data updates. Your dashboard refreshes automatically. No manual intervention required.
Why QuickBooks Native Reports Aren’t Enough
QuickBooks is excellent for recording transactions and basic bookkeeping. But when it’s time to analyze performance or present to stakeholders, you hit walls:
Static snapshots – QBO reports are point-in-time PDFs. Next week they’re outdated.
No cross-report analysis – Want to see how P&L trends affect cash flow? Open two tabs, squint, good luck.
Limited customization – Can’t rearrange sections, add custom calculations, or layer in budget data.
The manual ritual – Export P&L → Excel → format → export Balance Sheet → paste → export Cash Flow → paste → calculate ratios → build charts → repeat monthly.
For accounting firms: Multiply that by 20 clients and you’ve just described your entire month.
This dashboard eliminates the export-format-paste cycle. Pull all reports with one connection, refresh with one click.