


Operating Cash Flow Formula Explained
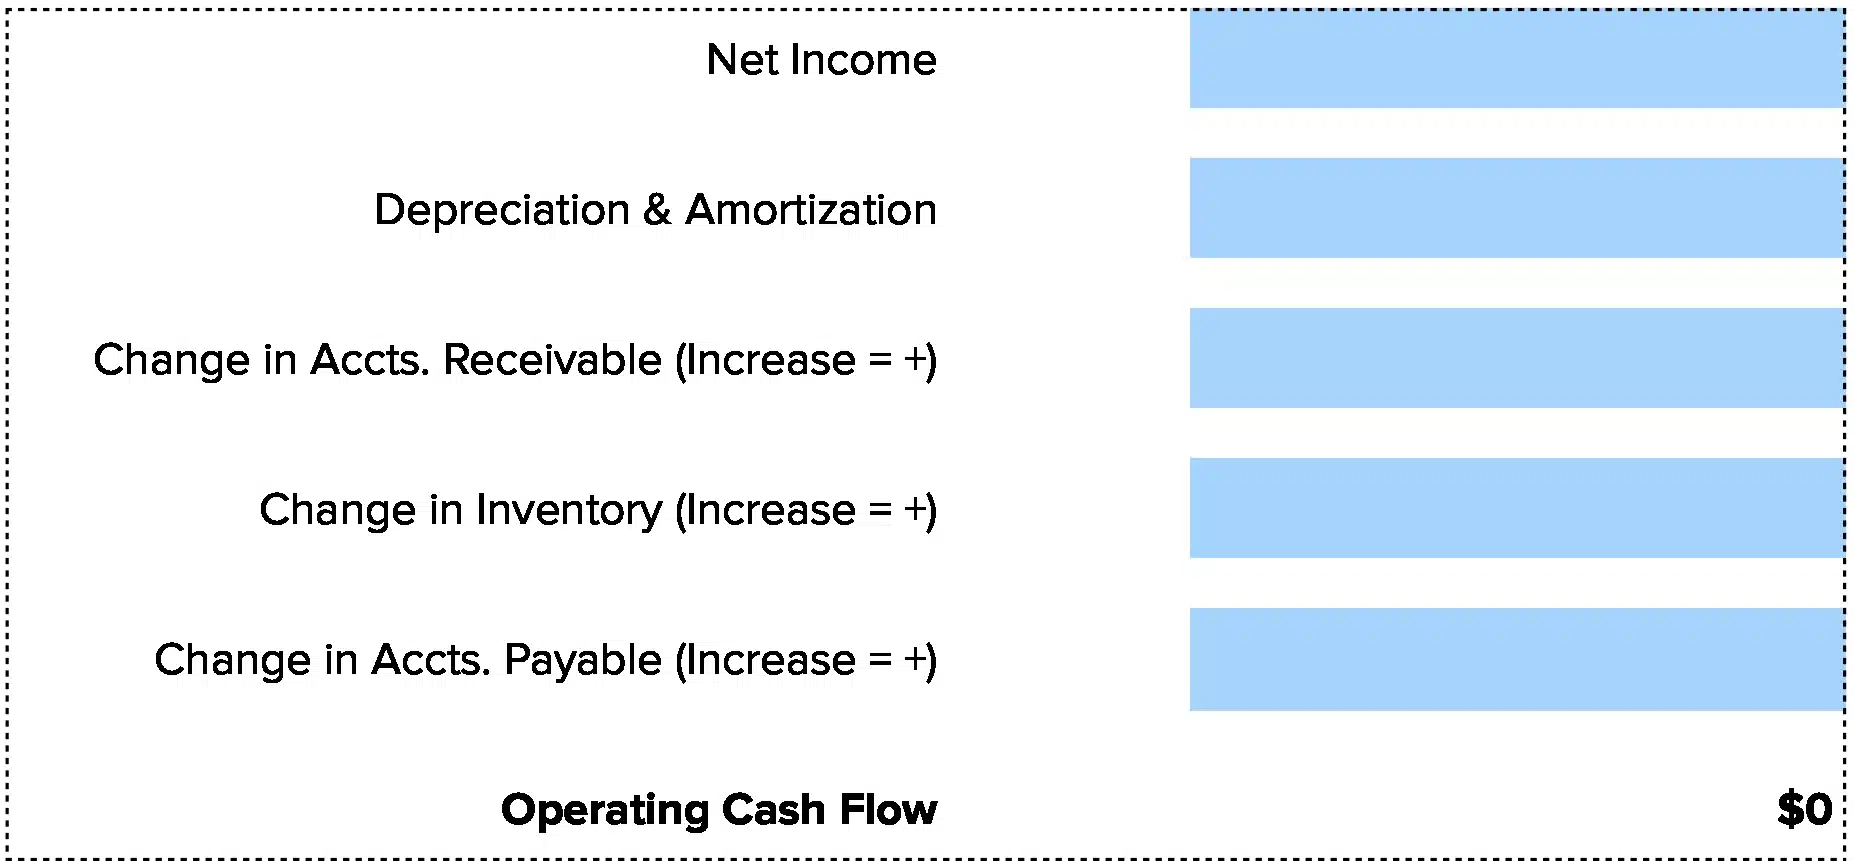
Operating Cash Flow = Net Income + Non-Cash Expenses – Changes in Working Capital
Let’s break this down:
Net Income: Your profit after all expenses and taxes. This is the bottom line from your income statement, showing what’s left after accounting for every cost your business incurs during the period.
Non-Cash Expenses: Costs recorded on your income statement that don’t require cash payments. Depreciation is the big one here – your equipment loses value over time on paper, but you’re not writing checks for it. Amortization of intangibles works the same way. These reduce net income but don’t reduce cash.
Changes in Working Capital: The cash impact of shifts in your current assets and liabilities. When accounts receivable increases, you’ve made sales but haven’t collected cash yet – that’s a cash outflow. When inventory grows, you’ve spent cash on stock. When accounts payable rises, you’re holding onto cash longer before paying vendors.
Why do we add back non-cash expenses? Because net income includes charges that didn’t actually use cash. We need to reverse those accounting adjustments to see real cash movement. The working capital adjustment captures the timing difference between earning revenue and collecting it, or recording expenses and paying them.
What Is Operating Cash Flow?
Operating cash flow measures the cash your business generates from its normal operations before financing and investment activities. It answers one critical question: Can your company sustain itself through the cash it earns from selling products or delivering services?
This metric strips away the noise of loans, stock sales, equipment purchases, and other non-operational activities. You see only the cash-generating power of your core business model. A company can be profitable on paper but still fail if operations don’t produce enough cash to pay bills, compensate employees, and fund growth.
Who uses this metric?
CFOs and Controllers tracking whether operations can fund growth without external capital or whether they need to tap credit lines.
Fractional CFOs monitoring multiple clients’ operational health and identifying which businesses need immediate cash flow intervention.
Financial Analysts building valuation models and assessing whether a company’s earnings translate into actual cash generation.
Lenders and Credit Analysts evaluating a company’s ability to service debt from operating cash rather than selling assets or raising capital.
Private Equity Investors determining if a target company generates enough cash internally to support growth initiatives and debt payments.
How to Calculate Operating Cash Flow: Step-by-Step
Here’s how to calculate operating cash flow using real numbers. You’ll see how the formula works.
- Start with net income
Pull net income from your income statement. For our example: $250,000 in net income for Q4.
- Add back depreciation and amortization
Your financial statements show $45,000 in depreciation on equipment and $8,000 in amortization of software licenses. These reduced your net income but didn’t use cash.
$250,000 + $45,000 + $8,000 = $303,000
- Calculate the change in accounts receivable
Your AR was $120,000 at the start of the quarter and $165,000 at the end. The $45,000 increase means you made sales but didn’t collect the cash yet.
$303,000 – $45,000 = $258,000
- Calculate the change in inventory
Inventory grew from $80,000 to $105,000. You spent $25,000 in cash to build up stock.
$258,000 – $25,000 = $233,000
- Calculate the change in accounts payable
AP increased from $95,000 to $115,000. You owe vendors an extra $20,000, which means you held onto that cash.
$233,000 + $20,000 = $253,000
- Account for other working capital changes
Accrued expenses increased by $12,000 (expenses recorded but not yet paid) and prepaid expenses decreased by $5,000 (you used up prepaid insurance).
$253,000 + $12,000 + $5,000 = $270,000
- Interpret your result
Your operating cash flow is $270,000. This means your core business operations generated $270,000 in cash during the quarter – more than your net income of $250,000. The difference shows that despite growth in receivables and inventory, your business still produced strong cash flow. You can use this $270,000 to pay down debt, invest in equipment, or build reserves without touching your credit lines.
How to Interpret Your Operating Cash Flow Number
Context matters when evaluating your operating cash flow. The most useful approach is comparing OCF to revenue as a percentage.
| Cash Flow Range | Interpretation | Recommended Actions |
| Negative OCF | Critical – Burning cash faster than you generate it. Operations are consuming capital rather than producing it. | • Review pricing strategy immediately<br>• Accelerate collections on receivables<br>• Negotiate extended payment terms with vendors<br>• Consider reducing inventory levels<br>• Evaluate cutting non-essential operating costs |
| $0 – 5% of Revenue | Weak – Barely breaking even on cash. Little buffer for unexpected costs or growth investments. | • Implement stricter credit policies<br>• Offer early payment discounts to customers<br>• Review vendor contracts for better terms<br>• Monitor working capital weekly<br>• Build 60-90 day cash reserves |
| 5% – 15% of Revenue | Healthy – Solid operational cash generation. Good position for sustainable growth without heavy reliance on external financing. | • Maintain current cash management practices<br>• Consider strategic reinvestment in growth<br>• Build emergency reserves of 3-6 months<br>• Evaluate opportunities for expansion<br>• Monitor trends monthly for early warning signs |
| Above 15% of Revenue | Strong – Excellent cash generation from operations. Significant flexibility for growth, acquisitions, or returning value to owners. | • Evaluate strategic growth opportunities<br>• Consider investing in automation or technology<br>• Build war chest for market downturns<br>• Assess acquisition targets<br>• Review if you’re underinvesting in growth |
Operating Cash Flow Benchmarks by Industry
Different industries generate different levels of operating cash flow based on their business models, capital requirements, and working capital needs.
| Industry | Typical OCF Margin | Notes |
| SaaS / Software | 15-25% | Subscription revenue provides predictable cash flow with minimal inventory or receivables |
| Professional Services | 10-20% | Project billing creates lumpy cash flow, depends heavily on collection efficiency |
| Manufacturing | 8-15% | Higher working capital needs due to inventory and equipment depreciation |
| Retail | 5-12% | Thin margins and high inventory requirements compress cash flow generation |
| Healthcare Services | 6-14% | Insurance reimbursement cycles and regulatory requirements impact cash timing |
| Construction | 8-16% | Retainage and progress billing create unique cash flow dynamics |
| E-commerce | 10-18% | Lower overhead than traditional retail but working capital tied up in inventory and payment processor holds |
| Hospitality | 12-20% | High fixed costs but faster cash collection from customers |
Why do these ranges vary so much? Business model fundamentals drive the differences. SaaS companies collect subscriptions upfront but recognize revenue over time, creating positive cash flow timing. They carry little inventory and minimal receivables with automated billing. Manufacturing businesses face opposite dynamics – they buy raw materials, hold work-in-progress inventory for weeks, then wait 30-60 days to collect payment after shipping finished goods.
Capital intensity matters too. Industries requiring heavy equipment face significant depreciation charges that reduce net income but get added back to operating cash flow. A construction company might show strong OCF even with modest net income because depreciation on equipment doesn’t consume cash in the current period.
Collection cycles create another layer of variation. Healthcare providers often wait 60-90 days for insurance reimbursements, tying up cash in receivables. Retailers and hospitality businesses collect payment immediately but face high inventory costs and fixed overhead that compress margins. Professional services firms have low capital requirements but lumpy billing cycles tied to project milestones.
Your industry benchmark tells you what’s normal for your sector. Compare your OCF margin to these ranges, but also track your trend over time. Improving from 7% to 11% matters more than hitting some arbitrary industry average.
Benchmark Citations
Vena Solutions Industry Profit Margin Analysis
Harvard Business School Online Financial Performance Measures
Eqvista Operating Cash Flow Ratio Industry Study
Automating Operating Cash Flow Tracking with Coefficient
Stop copying numbers from NetSuite or QuickBooks into Excel every month. Coefficient connects your accounting system directly to Google Sheets or Excel, pulling in net income, depreciation, and working capital changes automatically. Your operating cash flow calculates itself.
Set up your template once. Schedule it to refresh daily or weekly. Your cash flow statement updates with live data from your ERP. Finance teams save 2-3 hours per week eliminating manual data entry and preventing copy-paste errors that throw off your cash forecasts.
Get started with Coefficient today and see how automated cash flow tracking transforms your monthly close process.
How to Improve Your Operating Cash Flow
Strong operating cash flow doesn’t happen by accident. Here are proven strategies to boost yours.
Tighten your collection process
Send invoices the same day you deliver services or ship products. Follow up on overdue accounts every week, not monthly. Offer 2% discount for payment within 10 days. One manufacturing client reduced days sales outstanding from 52 to 38 days, freeing up $180,000 in cash.
Optimize inventory management
Switch to just-in-time ordering where possible. Use historical sales data to predict demand more accurately. Run promotions to move slow items before they become obsolete. A retail business cut inventory by 25% while maintaining service levels, improving cash flow by $220,000 annually.
Negotiate smarter payment terms with vendors
Ask for net-45 or net-60 terms instead of net-30. Pay on the last day terms allow without being late. Use your payment reliability as leverage for better terms. Every 15 days of extended terms is like getting a free short-term loan.
Reduce operating expenses strategically
Audit subscriptions and cut unused services. Renegotiate contracts with major vendors annually. Move fixed costs to variable where possible. One SaaS company saved $75,000 per year by consolidating software tools and switching to usage-based pricing.
Accelerate cash conversion
Shorten production cycles to reduce work-in-progress inventory. Bill clients as milestones complete rather than at project end. Accept multiple payment methods to remove friction from customer payments. Construction firms using progress billing see 30-40% improvement in operating cash flow.
Operating Cash Flow vs. Free Cash Flow vs. EBITDA
These three metrics measure different aspects of business performance. Understanding when to use each one matters.
Operating Cash Flow
Operating Cash Flow shows cash generated from core business operations. It includes working capital changes – the cash impact of growing or shrinking receivables, inventory, and payables. Use this to assess if daily operations produce enough cash to sustain the business.
Free Cash Flow
Free Cash Flow takes operating cash flow and subtracts capital expenditures. It reveals cash available after maintaining or expanding your asset base. This matters for valuation and dividend capacity. A company might have strong operating cash flow but negative free cash flow if it’s investing heavily in equipment or property.
EBITDA
EBITDA (Earnings Before Interest, Taxes, Depreciation, and Amortization) is an accounting profit measure, not a cash flow metric. It ignores taxes, capital expenditures, and working capital changes. Banks use it for loan covenants because it’s harder to manipulate than net income. But EBITDA can mislead – you can’t pay bills with EBITDA.
When to use each
Use Operating Cash Flow to assess if daily operations produce enough cash to sustain the business. Use Free Cash Flow for valuation and dividend capacity. Use EBITDA for loan covenants and comparing companies with different depreciation policies.
Pro tip for fractional CFOs: Present all three metrics to clients. A company showing strong EBITDA but weak operating cash flow often has working capital problems – growing too fast without enough cash to support receivables and inventory growth. That’s your signal to implement stricter cash management before they hit a crisis.
Track what matters
Your operating cash flow reveals whether your business model actually works. Positive OCF means you can fund growth, pay down debt, and build reserves without external capital. Negative OCF means you’re burning through cash and need to fix operations fast.
Track this metric monthly. Compare it to your industry benchmarks. Use it to make better decisions about pricing, inventory, collections, and growth investments.
Get started with Coefficient to automate your cash flow tracking and spend less time in spreadsheets.
 Sync Live Finance Data into Your Spreadsheet


