Tracking revenue variance drivers without a structured approach leads to missed insights and poor decision-making. Our free QuickBooks PVM Analysis template breaks down revenue changes into clear, actionable components so you can precisely identify what’s driving your business performance.
What is a PVM (Price Volume Mix) Analysis Report?
Price Volume Mix Analysis (PVM) is a powerful financial method that deconstructs revenue changes over time into three key components: price changes, volume fluctuations, and product mix shifts.
This analytical approach helps finance teams understand exactly what’s driving revenue performance beyond simple top-line comparisons. Rather than merely noting that revenue increased or decreased by a certain percentage, PVM analysis reveals the underlying factors behind those changes.
By separating the impact of pricing decisions, sales volume, and product mix shifts, businesses gain clarity on which levers are effectively driving growth or causing decline. This granular insight enables more targeted strategies and more informed decision-making across sales, marketing, and product development teams.
Benefits of using QuickBooks PVM Analysis Template
Turn your financial data into strategic insights with our specialized template:
Identify true revenue drivers. Stop guessing what’s moving the needle. Our template clearly separates price effects from volume changes and product mix shifts, showing exactly what’s contributing to revenue growth or decline.
Make smarter pricing decisions. See the direct impact of price changes on your bottom line. Understand whether price increases are helping or hurting overall performance when volume and mix are factored in.
Optimize your product portfolio. Instantly recognize which products are driving profitability through the mix variance analysis. Identify opportunities to shift focus toward high-value offerings.
Communicate clearly with stakeholders. Transform complex financial changes into visual, easy-to-understand reports that clearly demonstrate what’s happening with your business performance.
Save hours of manual analysis. Eliminate tedious calculations and formula-building. Our pre-built template handles the complex math, letting you focus on insights rather than spreadsheet engineering.
Metrics Tracked in the Report
📈 Core Metrics
- Revenue (PY): Previous year’s revenue baseline for comparison
- Revenue (AC): Actual revenue for the current period
📊 Variance Drivers
- Price Variance: Revenue change caused by price increases or decreases
- Volume Variance: Revenue change driven by changes in the number of units sold
- Mix Variance: Change caused by shifts in product mix (e.g., selling more high-margin vs. low-margin products)
- New: Revenue impact from newly introduced products
- Discontinued: Revenue lost due to discontinued products
🧾 Additional Calculated Outputs
- Absolute Variance: AC Revenue – PY Revenue
- % Variance: (AC – PY) ÷ PY Revenue
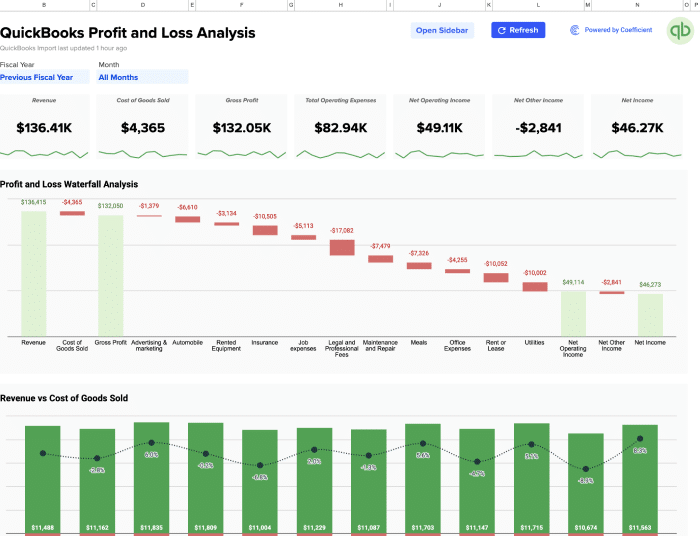
- Visual Contribution Analysis: Color-coded bars (green = positive, red = negative) showing each driver’s contribution to overall revenue variance
More Metrics to track and analyze from QuickBooks
Expand your financial analysis beyond PVM with additional QuickBooks data:
Financial Statements
- Profit and Loss
- Balance Sheet
- Cash Flow
- Trial Balance
Detailed Transactions
- General Ledger
- Transaction List
- Journal Entries
- Accounts Receivable/Payable
Business Operations
- Budget vs. Actual
- Vendor/Item Lists
- Credit Memos
- Department Performance
Tax & Compliance
- Tax Agency Data
- Tax Rates
- Tax Codes
Ready to transform your financial analysis?
Get started with our free PVM Analysis template today and gain deeper insights into your QuickBooks data. Our template makes complex financial analysis straightforward and actionable. Download the free template now and start uncovering the true drivers behind your revenue performance.