Managing SaaS revenue forecasting manually leads to outdated projections and missed growth opportunities. Coefficient’s free SaaS Revenue Forecasting Model template connects directly to your business systems, giving you real-time visibility into revenue metrics and automated forecasting capabilities.
Metrics Tracked in the Report
The SaaS Revenue Forecasting Model template tracks essential metrics that paint a complete picture of your revenue health:
- Total # of Customers – Track customer base growth over time
- Gross Margin – Monitor profitability trends and efficiency
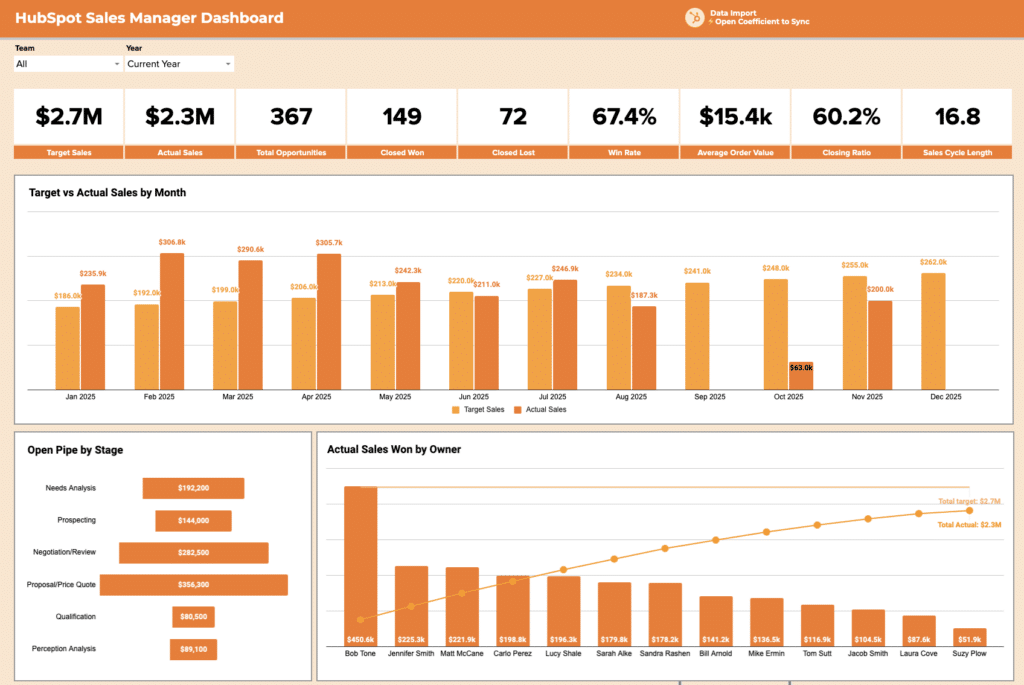
- New Customer Sales – Measure acquisition momentum
- CAC per Deal – Understand acquisition costs at a granular level
- LTV to CAC Ratio – Evaluate unit economics and sustainability
- CAC Payback – Calculate time to recover acquisition costs
- Expenses – Track operational costs against revenue
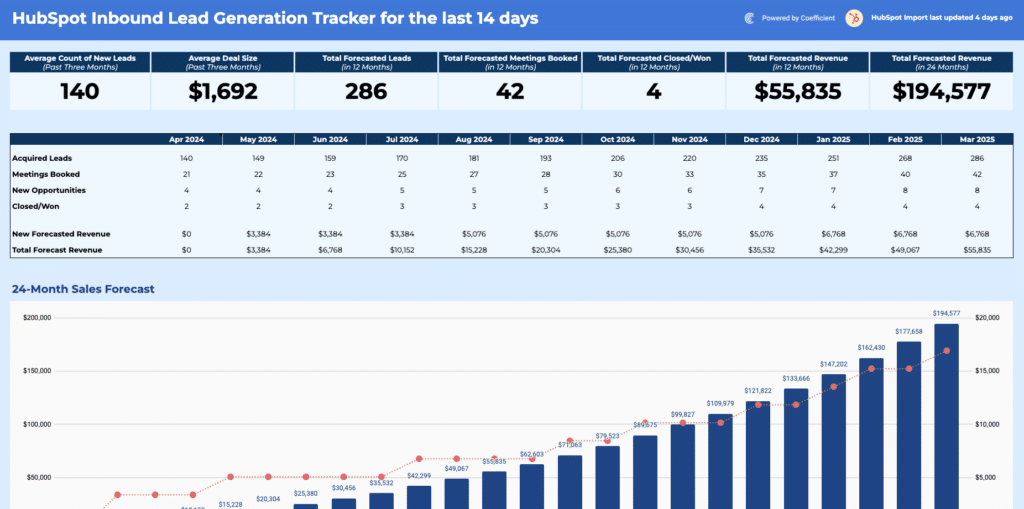
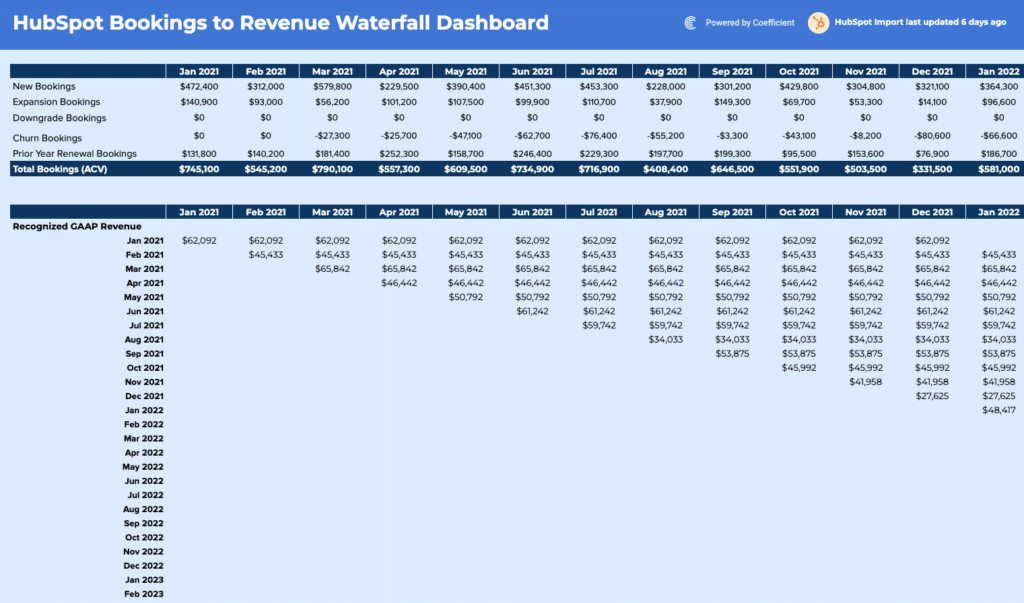
- New ARR – Measure revenue from new customer acquisitions
- Expansion ARR – Capture growth from existing customers
- Downgrade ARR – Monitor contraction in customer spending
- Churn ARR – Track revenue lost from customer departures
Benefits of Using a SaaS Revenue Forecasting Model Template
Real-time accuracy that drives confidence
Connect directly to your CRM, billing, and analytics platforms. Your forecasts update automatically as new data flows in, eliminating the guesswork from revenue planning.
Comprehensive metric tracking in one view
Monitor CAC, LTV, churn, and expansion revenue together. See how changes in one metric impact your overall forecast instantly.
Scenario planning made simple
Test different growth assumptions without breaking formulas. Adjust variables like sales velocity or churn rates to model best and worst-case scenarios.
Board-ready visualizations
Transform complex data into clear charts and dashboards. Present forecasts that stakeholders understand and trust.
Time savings that compound
Stop manually updating spreadsheets every week. Automated data refresh gives you hours back to focus on strategy, not data entry.