


Price to Sales Ratio Formula Explained
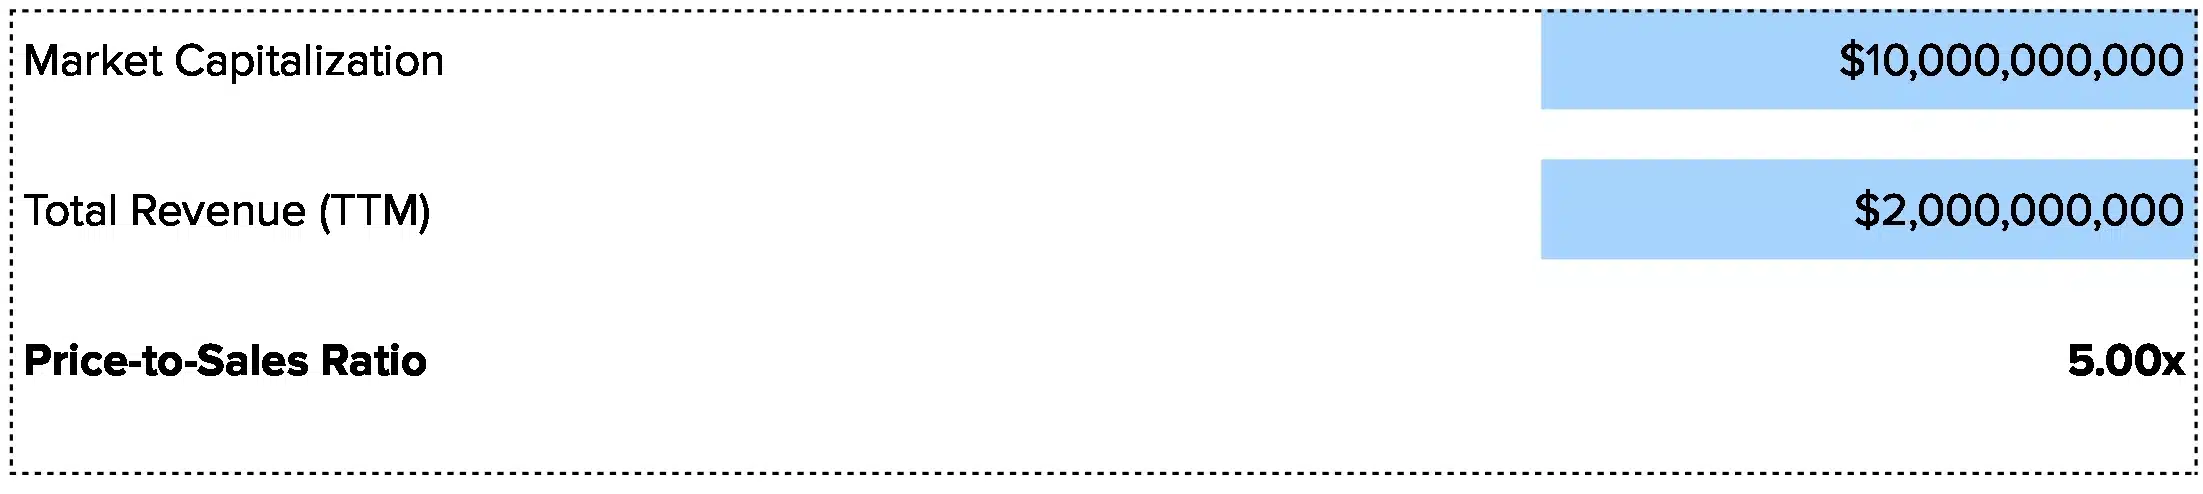
Price to Sales Ratio = Market Cap ÷ Total Revenue
Or use price per share:
Price to Sales Ratio = Price per Share ÷ Revenue per Share
Let’s break down each part:
Market Cap: The total value of all shares. Take the share price and multiply by shares out in the market. If a stock trades at $50 and there are 10 million shares, market cap is $500 million.
Total Revenue: All sales over the past 12 months. This includes every dollar that came in from customers. It’s the top line on the income statement, before you subtract costs or expenses.
Why divide market cap by revenue? It shows how much investors pay for each dollar of sales. A ratio of 3 means they’re paying $3 for every $1 in revenue. This helps you see if the price matches what the company brings in.
What Is a Price to Sales Ratio?
A price to sales ratio tells you how the market values each dollar of a company’s revenue. It answers a simple question: Are investors paying a lot or a little for the sales this business generates?
This ratio works well when a company has no profit yet or when earnings swing up and down. Revenue tends to be more stable than profit, so the P/S ratio gives you a clean way to compare companies in the same field.
Who uses this metric?
CFOs and Controllers track it to see how the market values their business and compare against peers in quarterly board reports.
Equity Analysts use P/S ratios to screen for undervalued stocks and build valuation models when earnings are negative or volatile.
Fractional CFOs monitor P/S ratios across multiple client portfolios to spot when a company’s market value shifts relative to its sales growth.
Investors compare P/S ratios to find stocks that might be mispriced, especially in sectors like SaaS where revenue growth matters more than current profit.
FP&A Teams track how their company’s ratio changes over time to see if growth plans are moving the valuation in the right direction.
How to Calculate Price to Sales Ratio: Step-by-Step
Let’s walk through a real example:
- Find the current share price
Check the latest stock price on any financial site. For our example, the stock trades at $75 per share.
- Get the number of shares
Look up shares outstanding from the company’s latest quarterly report or investor page. This company has 20 million shares outstanding.
- Calculate market cap
Multiply share price by shares outstanding:
$75 × 20,000,000 = $1,500,000,000 market cap
- Pull total revenue for the last 12 months
Find total revenue in the income statement. Also called sales or top line. Our example company reported $600 million in revenue over the past year.
- Divide market cap by revenue
$1,500,000,000 ÷ $600,000,000 = 2.5
- Read your result
A ratio of 2.5 means investors pay $2.50 for every dollar of sales. That’s your starting point for figuring out if the stock is cheap, fair, or too high.
How to Interpret Your Price to Sales Ratio Number
| Ratio Range | Interpretation | Recommended Actions |
| Below 1.0 | Undervalued or struggling – The market sees risk or doubt about future sales. Could be a bargain or a sign of real problems. | • Check if revenue is falling<br>• Look at profit margins<br>• Compare to peers in same sector |
| 1.0 – 2.0 | Fair value – Investors are paying a normal price for each dollar of sales. This range shows up often in mature, stable industries. | • Monitor for changes each quarter<br>• Track revenue growth trends<br>• Watch for margin improvements |
| 2.0 – 5.0 | Growth premium – The market expects strong sales growth ahead. Common in tech, SaaS, and other high growth sectors. | • Check if growth is on track<br>• Review customer retention rates<br>• Watch for slowing revenue |
| Above 5.0 | High expectations – Investors bet on massive future growth. Can signal strong momentum or overvaluation. Carries more risk if growth slows. | • Verify revenue growth is accelerating<br>• Check for path to profitability<br>• Assess if market hype is justified |
Price to Sales Ratio Benchmarks by Industry
Every industry has different norms. High growth sectors like software command higher ratios because investors expect revenue to multiply over time. Mature industries like retail or manufacturing trade at lower ratios since growth is slower and predictable.
| Industry | Typical Range | Notes |
| Software & SaaS | 5.0 – 15.0 | Recurring revenue, high margins, fast growth rates push ratios higher |
| Biotechnology | 7.0 – 12.0 | Pipeline potential and regulatory approvals drive expectations |
| E-commerce | 1.5 – 4.0 | Scale matters; bigger players see better ratios than smaller platforms |
| Healthcare Services | 0.8 – 2.5 | Reimbursement risk and regulatory pressure keep ratios lower |
| Manufacturing | 0.5 – 1.5 | Capital intensive, thin margins, slower growth result in lower valuations |
| Retail | 0.3 – 1.2 | Competitive pressure and low margins keep valuations modest |
| Financial Services | 2.0 – 5.0 | Asset management and fintech firms command higher ratios than traditional banks |
| Telecommunications | 0.8 – 2.0 | High infrastructure costs and stable but slow growth limit ratios |
Why such wide gaps? Growth potential and profit margins drive the differences. Software firms with 80% gross margins and 40% annual growth earn higher ratios than retailers with 5% margins and single digit growth.
Benchmark Citations
Eqvista Price to Sales Ratio by Industry 2025
NYU Stern Revenue Multiples by Sector
FullRatio PS Ratio Industry Analysis
Automating Price to Sales Ratio Tracking with Coefficient
Stop pulling CSV files from your accounting system every month.
Coefficient links Excel or Google Sheets straight to QuickBooks, NetSuite, Xero, or your data warehouse. Market cap and revenue data sync on a schedule you set. Your P/S ratio updates itself.
Finance teams cut out 15 to 30 minutes per metric check. No more copy errors. No more stale data. Just live numbers that refresh when you open the sheet.
Get started with Coefficient and download the free template.
How to Improve Your Price to Sales Ratio
If your P/S ratio is low, you have options to move it up.
Grow revenue faster than costs
The market rewards growth. Add new customers, launch products, or expand into new markets. Show investors that sales are climbing, and your valuation will follow. Focus on sustainable growth that doesn’t burn cash.
Improve profit margins
Investors care about revenue quality. Cut waste, automate processes, or raise prices where you can. Better margins signal that each dollar of sales is worth more. Even a 5% margin lift can shift how the market sees your business.
Show clear path to profit
Growth companies can trade at high P/S ratios if they prove they’ll turn a profit eventually. Build a model that shows when and how you’ll hit break even. Share it with investors. Reduce uncertainty and your ratio goes up.
Expand addressable market
The bigger your potential market, the more room for growth. If you sell to 10,000 potential customers now, find a way to reach 100,000. Investors pay more when they see a huge runway ahead.
Communicate your story better
Sometimes a low ratio just means the market doesn’t get what you do. Host investor calls, publish clear reports, and explain your growth plan. Better communication can close the gap between value and price.
Price to Sales Ratio vs. Price to Earnings Ratio vs. EV to Revenue
These three ratios show up together in most valuation reports. Each one answers a different question.
Price to Sales Ratio
Compares market value to revenue. Use it when profit is negative or unstable. It’s clean and easy to calculate. Best for growth companies or startups that haven’t turned profitable yet.
Price to Earnings Ratio (P/E)
Divides market cap by net income. It shows how much investors pay for each dollar of profit. Only works when the company is profitable. Better for mature businesses with steady earnings.
Enterprise Value to Revenue (EV/Revenue)
Uses enterprise value instead of market cap. Enterprise value includes debt and subtracts cash. This gives a fuller picture when comparing companies with different capital structures. Use it to compare firms with lots of debt against those with none.
When to use each
Start with P/S when earnings are negative or volatile. Switch to P/E once the company is profitable and stable. Add EV/Revenue when you’re comparing firms with different debt levels or cash positions.
Pro tip for fractional CFOs: Show all three ratios side by side in client reports. A client with a P/S of 4, a P/E of 20, and an EV/Revenue of 3.5 tells a complete story. The P/S shows market optimism. The P/E shows profit reality. The EV/Revenue shows how debt affects the picture. Present them together and you give the full context.
Value your business right
Price to sales ratio shows how the market values each dollar of revenue. Track it quarterly. Compare it to industry peers. Use it to gauge if your stock is fairly priced.
Get started with Coefficient and automate your P/S ratio tracking today.
 Sync Live Finance Data into Your Spreadsheet


