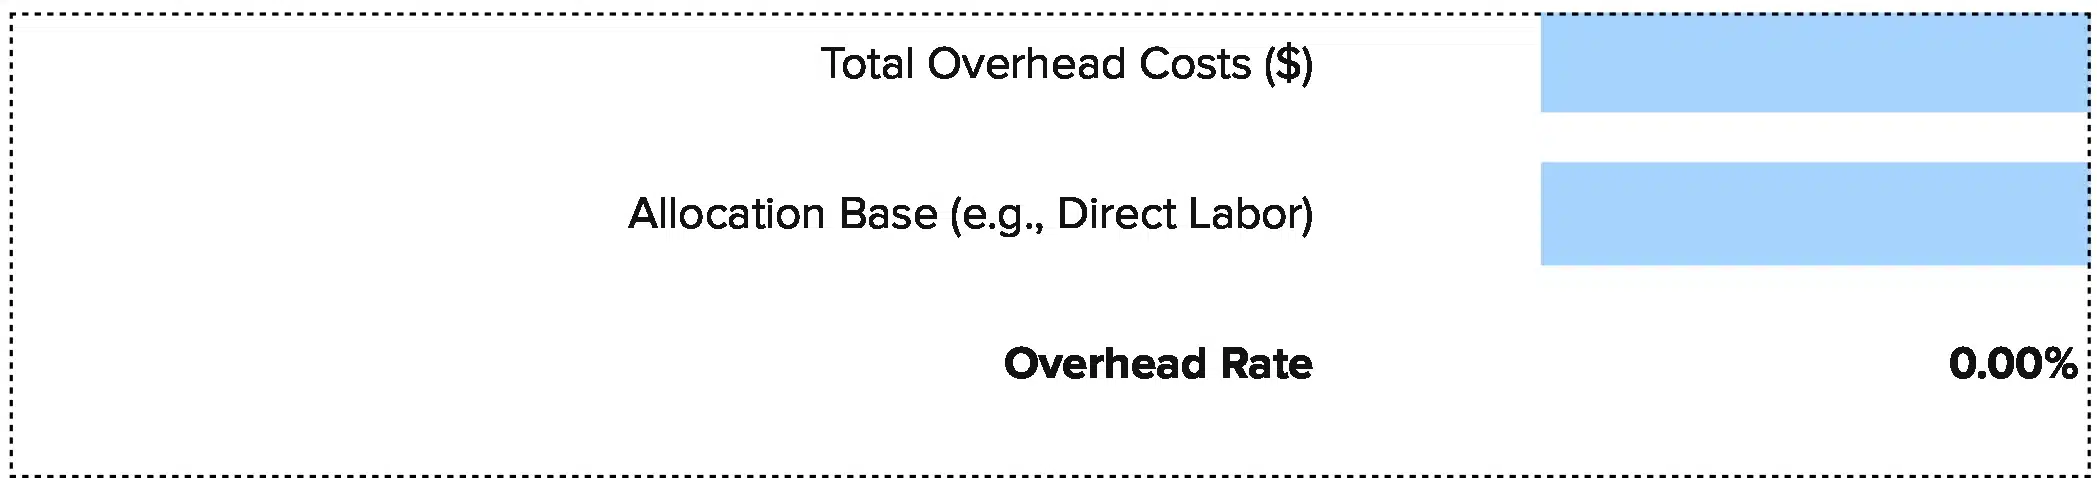


Overhead Rate = Total Overhead Costs / Allocation Base
This free overhead rate calculator shows you exactly what your business spends on indirect costs. You can track overhead as a percent of revenue or as a rate per unit. This helps you price products right and spot cost problems fast.
Let’s get started.
We’ve included a free Excel and Google Sheets template you can download and use right away.
Overhead Rate Formula Explained
Overhead Rate = Total Overhead Costs / Allocation Base
The allocation base can be direct labor hours, machine hours, or total units produced.
Let’s break down each part:
Total Overhead Costs: All indirect costs needed to run your business but not directly tied to a product. This includes rent, utilities, insurance, office supplies, equipment depreciation, and salaries for managers or admin staff who don’t work directly on products.
Allocation Base: The metric you use to spread overhead across products or services. Most companies use direct labor hours because labor drives much of the overhead. Manufacturing firms often use machine hours. Service businesses may use billable hours or total revenue.
Why we use an allocation base: You can’t assign overhead to a product as easily as materials or direct labor. The allocation base gives you a fair way to divide indirect costs across all products based on how much of that resource each product uses.
Why certain costs are excluded: Direct materials and direct labor are excluded from overhead because you can trace them directly to specific products. If you can point to a cost and say “this is for Product A,” it’s not overhead. Overhead covers everything else needed to keep the lights on and the business running.
What Is an Overhead Rate?
An overhead rate tells you how much indirect cost you assign to each unit of your allocation base. If your overhead rate is $4 per direct labor hour, every hour of work carries $4 of indirect costs like rent and utilities.
This metric helps you price products correctly. If you only count materials and direct labor, you lose money on every sale. The overhead rate adds those hidden costs into your cost structure so you can set prices that cover all expenses and generate profit.
Companies calculate overhead rates at the start of each year using estimated costs and estimated activity levels. This predetermined rate stays fixed for the period, which makes pricing and costing decisions consistent. At year end, you compare actual overhead to applied overhead and make adjustments.
The difference between a company that makes money and one that doesn’t often comes down to overhead management. Businesses that ignore their overhead rate tend to underprice products, wondering why they stay busy but never turn a profit. Smart companies track this metric monthly.
Who uses this metric?
Controllers setting standard costs and building budgets for indirect expenses.
Cost accountants allocating overhead to jobs or products in manufacturing and construction.
Fractional CFOs analyzing cost structure across multiple client companies.
Operations managers tracking efficiency and identifying cost overruns in production.
Project managers bidding on contracts and estimating true project costs.
How to Calculate Overhead Rate: Step-by-Step
Let’s work through a real example for a small manufacturing company. You’ll see exactly how the calculation works.
- Choose your allocation base
Decide which metric best reflects how your business consumes overhead. For our example, we’ll use direct labor hours because the company is labor-intensive. Last year, workers logged 24,000 direct labor hours.
- Add up all overhead costs for the period
Go through your general ledger and total every indirect cost. For our company, annual overhead includes:
- Rent: $48,000
- Utilities: $12,000
- Equipment depreciation: $18,000
- Factory insurance: $9,000
- Indirect labor (supervisors, maintenance): $36,000
- Factory supplies: $6,000
- Calculate total overhead
Add all the costs from Step 2:
$48,000 + $12,000 + $18,000 + $9,000 + $36,000 + $6,000 = $129,000 total overhead
- Divide overhead by allocation base
$129,000 / 24,000 direct labor hours = $5.38 per direct labor hour
- Apply the rate to products
If a product takes 3 direct labor hours to make, you assign $5.38 × 3 = $16.14 in overhead costs to that product.
- Review and adjust quarterly
Track actual overhead and actual labor hours each quarter. If your rate drifts too far from actual costs, recalculate it. Big gaps mean you’re overpricing or underpricing products.
- Interpret your rate
Our $5.38 rate means every hour of direct labor carries $5.38 in indirect costs. Compare this to your labor wage. If you pay workers $20/hour and overhead is $5.38/hour, your total labor cost is really $25.38/hour.
How to Interpret Your Overhead Rate Number
Understanding your overhead rate requires context. A rate that works for one business might signal problems for another.
The most useful way to interpret overhead is as a percentage of revenue. This lets you compare your cost structure to industry benchmarks and spot trends over time. Calculate it by dividing total overhead costs by total revenue, then multiplying by 100.
Your overhead percentage reveals how much of every dollar you take in gets consumed by indirect costs before you even think about materials, labor, or profit. A 25% overhead rate means a quarter of your revenue pays for rent, utilities, insurance, and admin staff.
| Rate Range (% of Revenue) | Interpretation | Recommended Actions |
| Below 10% | Very efficient – Minimal indirect costs, strong cost control | • Maintain current practices<br>• Consider strategic growth investments<br>• Monitor for any service quality issues |
| 10% – 20% | Healthy range – Good balance between efficiency and capability | • Track trends monthly<br>• Benchmark against direct competitors<br>• Plan for scalability |
| 20% – 35% | Acceptable – Standard for many industries, watch for creep | • Review largest overhead categories<br>• Negotiate better rates on rent and insurance<br>• Audit subscriptions and services |
| 35% – 50% | Concerning – Overhead eating into margins significantly | • Cut discretionary spending<br>• Renegotiate contracts<br>• Consider shared services or outsourcing<br>• Increase revenue to spread fixed costs |
| Above 50% | Critical – Immediate action needed to restore profitability | • Implement hiring freeze<br>• Downsize office space<br>• Eliminate low-value activities<br>• Focus on high-margin revenue |
Track your overhead percentage every month. A steady climb from 22% to 28% over six months means costs are growing faster than revenue. That trend kills profits if you don’t catch it early. Set up alerts when overhead crosses certain thresholds so you can act before small problems become big ones.
Overhead Rate Benchmarks by Industry
Overhead rates vary widely by industry based on capital intensity, labor models, and business structure.
| Industry | Typical Range (% of Revenue) | Notes |
| Manufacturing | 15% – 35% | Higher for capital-intensive facilities with heavy equipment; lower for assembly operations |
| Construction (General Contractors) | 8% – 20% | Urban contractors run 18-22%; rural contractors 12-16%; varies by project size |
| Construction (Specialty Trades) | 18% – 25% | Electrical and plumbing contractors face higher overhead due to licensing and insurance |
| Professional Services | 10% – 30% | Consulting firms run lean; law firms with large office footprints run higher |
| Retail | 20% – 30% | Rent and utilities drive costs; e-commerce has lower overhead than brick-and-mortar |
| Hospitality | 25% – 40% | Property costs, maintenance, and utilities make this a high-overhead industry |
| Healthcare Services | 15% – 30% | Medical practices face high compliance and insurance costs |
| Software / SaaS | 20% – 35% | Server costs, customer support, and R&D drive overhead despite no physical product |
Capital-intensive industries like manufacturing and hospitality carry more overhead because they need equipment, buildings, and maintenance staff. A hotel or factory has significant fixed costs for property, utilities, and upkeep before serving a single customer or producing a single unit.
Service industries run leaner because their main costs are direct labor. A consulting firm needs office space and software, but overhead stays relatively low compared to revenue. The business model matters more than company size.
Geography plays a major role too. Companies in expensive cities like New York or San Francisco pay double or triple for rent compared to rural areas. This pushes overhead higher through no fault of management. When you compare your overhead to benchmarks, factor in your location.
Business maturity also affects overhead. Startups often run high overhead as a percentage of revenue because they build infrastructure before achieving full revenue potential. Mature companies spread fixed costs across larger revenue bases, bringing overhead percentages down.
Compare your overhead percentage to your industry range. If you’re in professional services running at 42% overhead, you have a problem. If you’re in hospitality at 32%, you’re performing well.
Don’t panic if you fall outside the range. Investigate why. Maybe you just signed a lease for a bigger facility to support planned growth. Your overhead will be temporarily high until revenue catches up. That’s different from bloated costs with no growth plan.
Benchmark Citations
FP Advance: Overhead Percentage
NetSuite: How to Calculate Overhead
Inspired Economist: Overhead Rate
Automating Overhead Rate Tracking with Coefficient
Stop exporting CSVs from NetSuite or Sage Intacct every month just to update your overhead reports. Coefficient connects your accounting system straight to Excel or Google Sheets. Your overhead costs, labor hours, and calculations refresh automatically on whatever schedule you set.
You spend 15 minutes each month pulling expense data, categorizing costs, and updating formulas. Coefficient eliminates that work. Set up your overhead calculation once. The data pulls itself. Your rate updates in real time.
This matters for fractional CFOs managing multiple clients. Build one template. Connect each client’s system. All dashboards update automatically. No more manual work per client.
Get started with Coefficient to automate your overhead tracking today.
How to Improve Your Overhead Rate
Reducing overhead improves profitability without cutting into product quality or service levels.
Renegotiate your largest fixed costs
Rent and insurance are usually your top two overhead expenses. Call your landlord six months before lease renewal and negotiate. Get quotes from three insurance brokers. Switching providers can cut premiums 15-25%. Attack the big costs first.
Move to usage-based services
Replace fixed-cost software licenses with usage-based tools. If you pay for 50 licenses but only 30 people use the software, you waste money. Cloud services that charge per user or per gigabyte align costs with actual use.
Automate repetitive admin tasks
Every hour your team spends on data entry, report generation, or manual reconciliation is overhead. Tools like Coefficient eliminate manual data exports. Automated workflows cut admin time 30-40%, letting you run the same business with fewer support staff.
Audit and cut unused subscriptions
Most companies pay for software nobody uses. Run a report of all recurring charges. Ask each department to justify every subscription. Cancel anything used less than weekly. This typically saves $5,000-$15,000 annually for mid-sized companies.
Increase revenue to leverage fixed costs
Your rent, insurance, and salaried staff stay the same whether you do $1M or $2M in revenue. Doubling revenue doesn’t double overhead. A 20% revenue increase might only raise overhead 5-10%, dropping your overhead rate significantly.
Overhead Rate vs. Overhead Percentage vs. Burden Rate
These terms are related but measure different things.
Overhead Rate
Overhead Rate = Total Overhead Costs / Allocation Base (like direct labor hours or machine hours). Expressed as dollars per unit. Example: $5.38 per direct labor hour.
Overhead Percentage
Overhead Percentage = Total Overhead Costs / Total Revenue × 100. Expressed as a percent of revenue. Example: If overhead is $129,000 and revenue is $500,000, your overhead percentage is 25.8%.
Burden Rate
Burden Rate = (Overhead Costs + Direct Labor Costs) / Direct Labor Costs. This shows your total labor cost including overhead. Example: If direct labor is $480,000 and overhead is $129,000, burden rate is 126.9%. For every dollar of direct labor, you spend $1.27 total.
When to use each metric
Use overhead rate for product costing and pricing decisions. When you need to assign costs to a specific job or product, the overhead rate gives you the dollar amount to add based on labor hours or machine time consumed.
Use overhead percentage to track overall cost structure and benchmark against industry. This metric shows whether your business model is sustainable and competitive. Track it monthly to spot cost creep before it damages profitability.
Use burden rate for project bidding when labor drives most costs. Construction and consulting firms rely on burden rate because it captures the full cost of putting people to work, not just their wages.
Pro tip for fractional CFOs: Present all three metrics to clients. The overhead rate helps them price products. The overhead percentage shows whether cost structure is competitive. The burden rate reveals true labor costs for bidding. Each metric tells a different part of the story. Clients who understand all three make better decisions about pricing, hiring, and growth.
Control your costs
Overhead rate reveals how much indirect cost you carry. A low rate means efficient operations. A high rate signals bloat – too much rent, too many subscriptions, too much administrative burden.
Track your overhead rate monthly. Compare it to industry benchmarks. Use it to make smarter decisions about spending, pricing, and growth.
Get started with Coefficient to automate your overhead tracking and keep costs under control.
 Sync Live Finance Data into Your Spreadsheet


