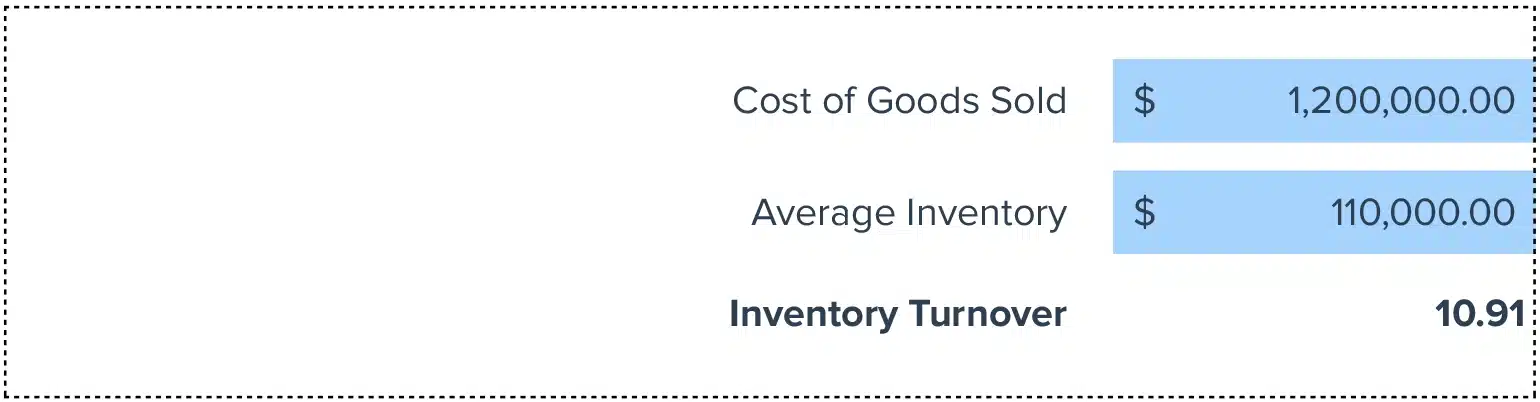


Inventory Turnover = Cost of Goods Sold / Average Inventory
How to Calculate Inventory Turnover?
– Determine Cost of Goods Sold (COGS): This is the total cost of all goods sold by the company during a specific period.
– Calculate Average Inventory: This is the average value of inventory held over a specific period. It’s found by adding the value at the beginning and end of the period, then dividing by two.
– Formula Application: The formula then divides COGS by the average inventory to find the turnover rate.
What is Inventory Turnover?
Inventory Turnover is a crucial metric that measures how often a business sells and replaces its stock over a certain period. This KPI helps companies understand how efficiently they manage inventory, affecting overall operational efficiency and profitability.
Why is Inventory Turnover Important?
Efficient inventory management is essential for optimal cash flow and minimizing holding costs. High inventory turnover indicates strong sales or effective inventory management, while low turnover might suggest overstocking or issues in product selling.
Calculating “Inventory Turnover” – Example
Let’s assume a business has a beginning inventory of $20,000 and an ending inventory of $15,000, making the average inventory $17,500. If the COGS is $70,000 in the same period, the Inventory Turnover would be 4 (70,000 / 17,500). This indicates the inventory was fully turned over four times during the period.
How to Improve Inventory Turnover
Optimize Inventory Levels
Conduct regular reviews of inventory levels to avoid overstocking, which ties up capital and increases storage costs. Use tools like just-in-time inventory to match stock levels to real-time demand.
Improve Demand Forecasting
Use accurate forecasting methods like historical data analysis, seasonal trends, and market research to predict customer demand more precisely. Better forecasting helps in maintaining optimal inventory levels.
Enhance Supplier Relationships
Work closely with suppliers to reduce lead times and improve the reliability of stock deliveries, ensuring you have the right products when needed without maintaining excessive inventory.
Increase Sales Efforts
Boosting demand through marketing and promotions can help move products faster. Consider discounts or special promotions to clear out slower-moving stock.
Utilize Inventory Management Software
Implement advanced software tools that provide real-time data on inventory levels, trends, and forecasts, allowing for better-informed decisions and improved efficiency in inventory management.
How to Calculate Inventory Turnover in Google Sheets and Excel?
1. Input the COGS for the period in cell A1.
2. Enter the starting inventory value in cell A2 and the ending inventory value in cell A3.
3. Calculate the average inventory in cell A4 using the formula = (A2+A3)/2.
4. Apply the turnover formula in cell A5: =A1/A4.
## Drawbacks of Inventory Turnover Calculator
### External Market Factors
External factors like sudden demand shifts or supply chain disruptions can affect the accuracy of the inventory turnover calculations.
Seasonal Adjustments
The calculator might not account for seasonal variations that can significantly impact inventory needs and turnover rates.
Misinterpretations
The metric might lead to misinterpretations if not coupled with context, such as turnover rates varying significantly across different industries.
When to Use the Inventory Turnover Calculator?
– Use this tool when reviewing quarterly or annual performance, planning procurement, and when devising new strategies to improve inventory management. It assists in maintaining a balance between too much and too little stock.
Coefficient.io + Inventory Turnover Calculator: Tips and Tricks
– Use scheduled refreshes to keep data up-to-date and make informed decisions based on the latest inventory and sales figures.
– Set up real-time alerts to monitor significant changes in inventory levels.
– Apply formulas and pivot tables directly in your spreadsheets to enhance data visualization and gain a clearer understanding of inventory trends.
 Sync Live Data into Your Spreadsheet


