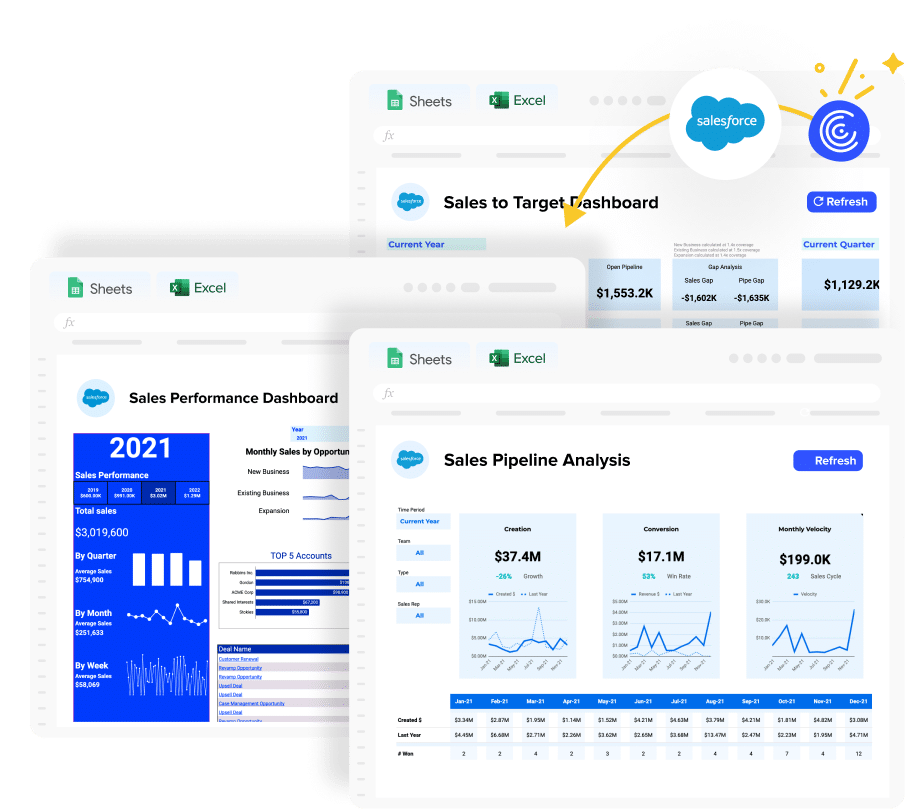
Managing your sales pipeline is hard. Get instant visibility into your weighted pipeline metrics with this free Salesforce template that pulls live data directly into your spreadsheet.
What is a Weighted Pipeline Report?
A weighted pipeline report transforms raw sales data into actionable insights by applying probability factors to each opportunity.
Unlike standard pipeline reports that treat all opportunities equally, weighted pipeline reports adjust deal values based on their likelihood to close. This gives sales leaders a more realistic view of expected revenue. For example, a $100,000 opportunity with a 50% close probability contributes $50,000 to your weighted pipeline value.
With Coefficient’s Salesforce Weighted Pipeline template, you get an automated, real-time view of your weighted pipeline directly in your spreadsheet. The days of manually exporting Salesforce data and applying formulas are over.
Benefits of using Salesforce Weighted Pipeline Template
- See exactly what’s coming. Transform your revenue forecasting with probability-weighted projections that show you what’s really likely to close, not just what’s in the pipeline.
- Spot risks before they hurt. Instantly identify aging deals, overdue opportunities, and at-risk revenue with visual breakdowns by forecast category and deal owner.
- Make decisions with confidence. Base your sales strategy on live Salesforce data that refreshes automatically, eliminating the guesswork of outdated exports and manual calculations.
- Save hours each week. Skip the tedious process of exporting data, applying formulas, and rebuilding reports. One-click refreshes give you up-to-date metrics whenever you need them.
Share insights effortlessly. Schedule automated report distribution to key stakeholders via Slack or email, ensuring everyone works from the same accurate data.
Metrics Tracked in the Report
📊 Top-Level Summary Metrics
- Total Open Opportunities
- Open Pipeline Value
- Weighted Pipeline Value – Shown as a percentage of total open pipeline value
- Total Overdue Pipeline Value – Shown as a percentage of weighted pipeline value
- Total to Close in 1–30 Days – Shown as a percentage of weighted pipeline value
🔍 Breakdowns by Segment
✅ By Deal Type & Aging
- Weighted Sales Pipeline by Deal Type
- Segmented by Deal Aging Buckets (Overdue, 31–60 days, 61–90 days, 91+ days)
- Deal Type (Expansion, New Business, Existing Business)
📦 By Forecast Category
- Weighted Pipeline by Forecast Category
- Includes categories: Commit, Best Case, Pipeline
- Further segmented by: Not Yet Due, Overdue
👤 By Deal Owner
- Weighted Sales Pipeline by Owner
- Displays pipeline value and open opportunity count per rep
📋 Pipeline Table (Deal-Level Details)
- Deal ID
- Deal Name
- Associated Company Name
- Create Date
- Expected Close Date
- Forecast Category
- Forecast Probability
- Opportunity Owner
- Deal Amount
- Weighted Pipeline Value
- To Close In (days until expected close)
More Metrics to track and analyze on Google Sheets
Beyond the weighted pipeline, Coefficient’s Salesforce integration lets you pull additional metrics to enhance your sales analytics:
- Sales Pipeline – Track your entire sales funnel from lead to close
- Lead Source Analysis – Identify which channels generate the highest quality opportunities
- Opportunity by Rep – Compare performance across your sales team
- Closed Won vs. Closed Lost – Analyze win rates and loss patterns
- Sales Forecast – Project future revenue with greater accuracy
- Customer Lifetime Value – Measure long-term customer relationships
- Accounts by Industry – Identify your strongest market segments
- Top Accounts by Revenue – Focus on your highest-value customers
You can also pull data from custom Salesforce objects to create unique reports tailored to your business needs.
How to Get Started with the Weighted Pipeline Template
- Install Coefficient – Add the free Coefficient add-on to Google Sheets or Excel
- Connect Salesforce – Link your Salesforce account with just a few clicks
- Import the Template – Select the Weighted Pipeline template from our library
- Customize (Optional) – Adjust metrics and visualizations to fit your needs
- Set Refresh Schedule – Automate data updates daily, hourly, or on demand
Get started in minutes with no coding required. Your live, weighted pipeline dashboard will give you immediate visibility into your sales forecast based on real-time Salesforce data.
Related Resources
- Salesforce SOQL: Write Queries & Import Data with GPT in Sheets
- How to Create a Sales Commission Calculator
- How to Export Data from Salesforce into Excel
- Forecast Categories in Salesforce: Complete Guide
- How to Forecast in Excel
Take control of your sales pipeline today
Stop guessing about your sales forecast. Our Weighted Pipeline template gives you the clarity you need to make confident decisions based on probability-adjusted data from Salesforce.
The template is completely free, takes minutes to set up, and updates automatically. Your team deserves better than outdated exports and manual calculations.


