


Hourly Wage = Annual Salary ÷ (Hours Per Week × 52 Weeks)
This free hourly wage calculator does the math for you. Turn any annual salary into an hourly rate in seconds, or go the other way. You’ll also learn how to compare rates across jobs, budget your time, and make better pay decisions. Plus, grab our free Excel and Google Sheets template to track wages for your whole team.
Most people know their annual salary but not their hourly rate.
Hourly Wage Formula Explained
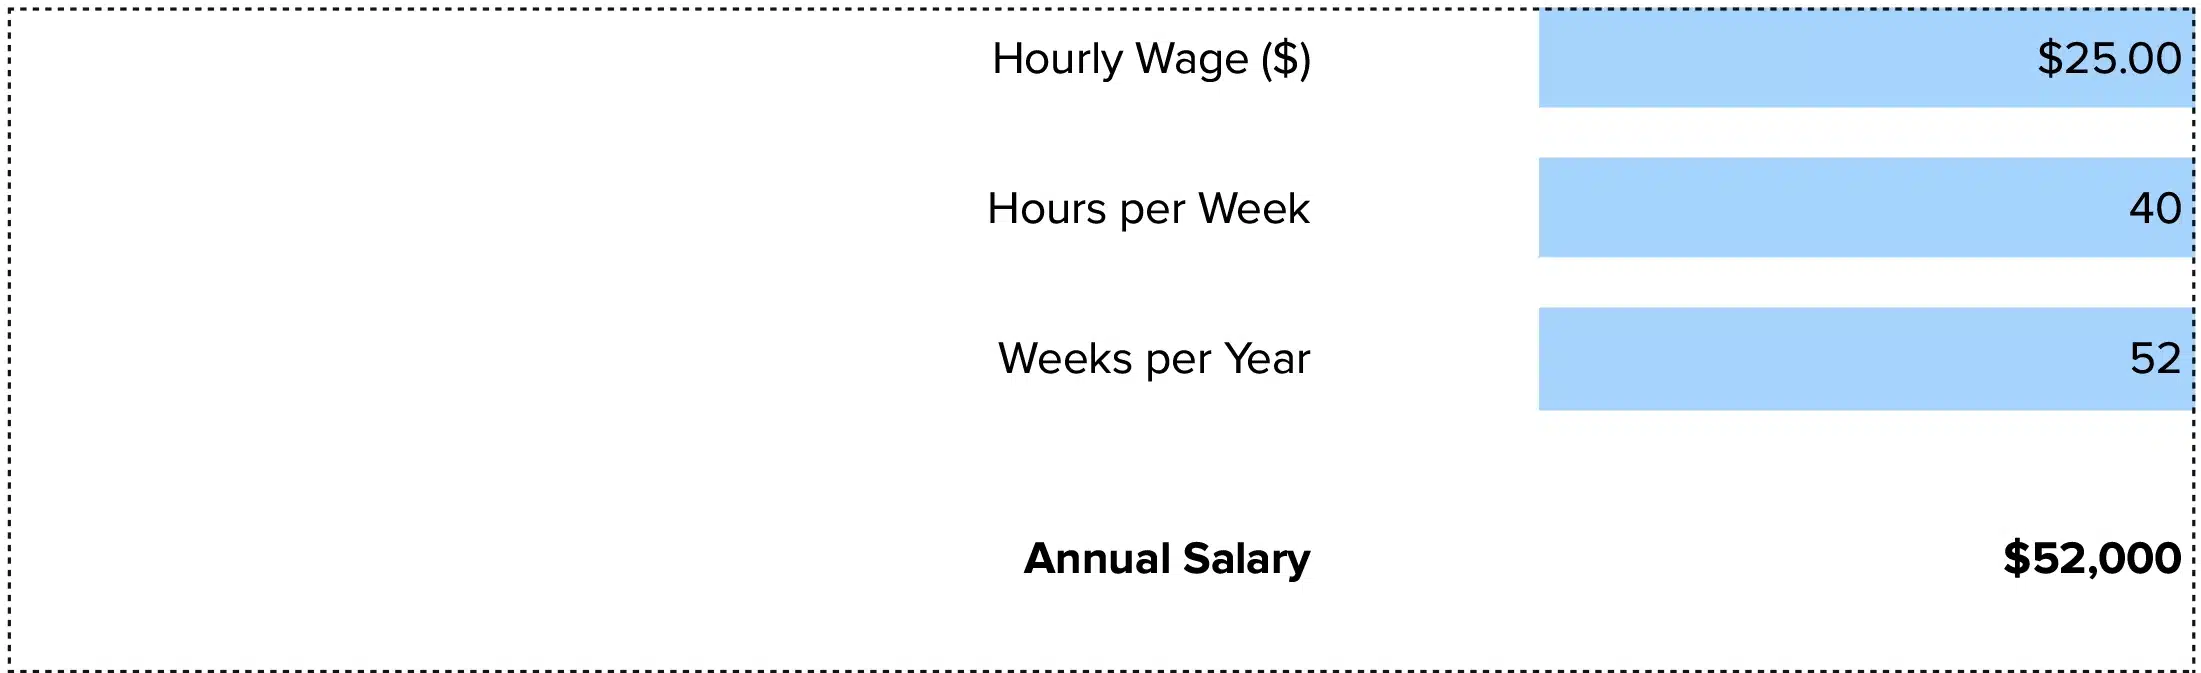
Hourly Wage = Annual Salary ÷ (Hours Per Week × 52 Weeks)
Or, simplified: Annual Salary ÷ 2,080 (for a standard 40-hour work week)
Let’s break down each piece:
Annual Salary: Your total pay before taxes for one year. This is your base salary, not counting bonuses, overtime, or benefits. If you’re salaried, this number shows on your offer letter or pay stub.
Hours Per Week: The standard is 40 hours, but some jobs expect 35 or 45. Use your actual work hours, not what you wish you worked. Part-time? Use 20 or 30 or whatever your schedule says.
52 Weeks: One year has 52 weeks. We multiply your weekly hours by 52 to get annual hours. Standard calculation: 40 × 52 = 2,080 total hours per year.
Why this matters: When you divide annual pay by total hours, you see what each hour of work is worth. This helps you compare job offers, negotiate raises, or decide if overtime is worth it. A $50,000 salary sounds good, but $24.04 per hour might change how you think about it.
What we exclude: This basic formula doesn’t include paid time off, holidays, or sick days. If you get two weeks of vacation, you work 50 weeks, not 52. That changes your real hourly rate.
What Is Hourly Wage?
Hourly wage is the amount you earn for each hour of work. Simple as that. It’s the base rate before taxes, tips, or bonuses. Some workers get paid hourly from day one. Others earn a salary and need to calculate their hourly rate to understand their true pay.
The difference matters for budgeting, taxes, and overtime. Hourly workers track every hour and get paid for exactly what they work. Salaried workers get the same paycheck no matter how many hours they put in. Both groups need to know their hourly rate to make smart money choices.
Who uses this metric?
HR Managers and Compensation Analysts set pay scales and ensure internal equity across roles. They calculate hourly rates to compare part-time and full-time positions and stay compliant with wage laws.
Finance and Payroll Teams process payroll, budget labor costs, and forecast headcount expenses. Converting salaries to hourly rates helps them model costs per project or department.
Job Seekers and Employees compare offers and negotiate pay. Knowing your hourly rate makes it easy to see if a new job pays more per hour, even if the salary looks lower.
Freelancers and Contractors set their rates based on what full-time jobs pay per hour. They add overhead and profit margin to land on a competitive hourly rate that covers their business costs.
Business Owners and Department Heads calculate true labor costs for projects, bids, and budgets. They need hourly rates to price services and track profitability per employee or per hour worked.
How to Calculate Hourly Wage: Step-by-Step
Let’s walk through converting a $60,000 annual salary into an hourly wage using a real example.
- Start with your annual salary
Find your total annual pay before taxes. For this example: $60,000 per year.
- Determine hours worked per week
Most full-time jobs are 40 hours per week. Some are 35 or 37.5. Use your actual schedule. For this example: 40 hours per week.
- Calculate total hours per year
Multiply weekly hours by 52 weeks:
40 hours × 52 weeks = 2,080 hours per year
- Divide annual salary by total hours
Take your salary and divide by total hours:
$60,000 ÷ 2,080 hours = $28.85 per hour
- Adjust for paid time off (optional)
If you get two weeks of vacation, you actually work 50 weeks:
40 hours × 50 weeks = 2,000 hours
$60,000 ÷ 2,000 hours = $30.00 per hour
This adjustment shows your real hourly rate for time actually worked.
- Compare to market rates
Check if $28.85 per hour is competitive for your role and location. Use Bureau of Labor Statistics data or salary sites like Glassdoor.
- Interpret the result
A $60,000 salary equals $28.85 per hour, which is below the national average of $36.53 for all private sector workers as of August 2025. This might signal room to negotiate or look for higher-paying opportunities in your field.
How to Interpret Your Hourly Wage Number
Your hourly rate only makes sense in context. A $25 hourly wage might be great for one job and low for another.
| Wage Range | Interpretation | Recommended Actions |
| Below $15 | Entry-level or minimum wage territory – Common for retail, food service, and early-career roles in most states. | • Identify skills to learn for higher pay<br>• Look for employers offering raises or advancement<br>• Consider certification programs or training |
| $15 – $25 | Moderate pay for mid-level or specialized hourly roles – Typical for administrative, customer service, and skilled trades apprentices. | • Track your accomplishments for raise discussions<br>• Research what peers earn in your market<br>• Build skills that command higher rates |
| $25 – $40 | Solid hourly wage for experienced professionals – Common for supervisors, technical specialists, and credentialed experts. | • Maintain competitive skills and certifications<br>• Negotiate annual increases to keep pace with inflation<br>• Consider management or specialized roles |
| $40 – $60 | Strong hourly rate for senior professionals – Reflects advanced skills, leadership, or in-demand technical expertise like IT, healthcare, or engineering. | • Position yourself for director or executive opportunities<br>• Mentor others and build leadership credentials<br>• Stay current with industry changes |
| Above $60 | Excellent compensation for top-tier talent – Typically requires deep expertise, advanced degrees, or high-demand specializations. | • Focus on strategic career moves, not just pay<br>• Build networks and personal brand<br>• Consider consulting or entrepreneurship |
Context matters: These ranges shift by location. $20 per hour goes far in rural areas but barely covers rent in San Francisco or New York. Always compare your wage to local cost of living and industry benchmarks.
Hourly Wage Benchmarks by Industry
Wages vary dramatically by industry. Here’s what workers earn per hour across eight major sectors, based on Bureau of Labor Statistics data from 2024-2025:
| Industry | Typical Hourly Range | Notes |
| Utilities | $48 – $58 | Highest-paying sector due to specialized technical skills, safety requirements, and union presence. Jobs often require certifications. |
| Mining and Logging | $36 – $45 | High wages reflect physical demands, safety risks, and remote locations. Boom-and-bust cycles affect availability. |
| Construction | $32 – $48 | Wide range based on trade specialization. Electricians and plumbers earn more than general laborers. Regional demand varies. |
| Wholesale Trade | $30 – $48 | B2B sales and logistics roles. Higher-end includes account managers and technical sales specialists. |
| Manufacturing | $28 – $43 | Depends on automation level and product complexity. Skilled machinists earn more than assembly line workers. |
| Transportation and Warehousing | $24 – $40 | Truck drivers and logistics coordinators at the high end. Warehouse associates at the low end. E-commerce growth boosted wages. |
| Retail Trade | $15 – $32 | Broad range from cashiers to store managers. Commission-based sales roles earn more. High turnover sector. |
| Hospitality and Food Service | $12 – $24 | Often supplemented by tips. Hotel managers earn more than servers. Seasonal fluctuations common. |
Why such big differences? Education requirements, skill scarcity, physical danger, and profit margins all play a role. Utilities and mining pay well because mistakes are costly and workers need years of training. Retail and hospitality pay less because entry barriers are low and profit margins are thin.
Location multiplier: These are national averages. Coastal cities pay 20-40% more than rural areas, but cost of living eats the difference. A $25/hour job in Austin feels like $40/hour in San Francisco when you account for rent and expenses.
Benchmark Citations
Bureau of Labor Statistics Employment Situation
BLS Occupational Employment and Wage Statistics
YCharts Average Hourly Earnings Data
Automating Hourly Wage Tracking with Coefficient
Stop copying payroll data from your HRIS into Excel every time you need to analyze labor costs.
Coefficient connects NetSuite, QuickBooks, Sage Intacct, or your data warehouse directly to your spreadsheets. Your hourly wage calculations update automatically with live employee data.
Finance teams use Coefficient to build real-time compensation dashboards, compare actual labor costs to budget, and model headcount scenarios. Set it up once and your sheets refresh on schedule. No more manual exports or version control nightmares. Get started with Coefficient and save hours on payroll analysis.
How to Improve Your Hourly Wage
Your hourly rate isn’t fixed. Here are five practical ways to increase it.
Gain certifications or skills that pay more
Most industries have credentials that command higher wages. Project management certifications, technical skills like SQL or Python, or trade licenses like HVAC or electrical can boost your rate by $5-15 per hour. Check what certifications your industry values and get them.
Negotiate based on market data
Use Bureau of Labor Statistics data and salary sites to prove you’re underpaid. Bring specific numbers to your manager: “The median hourly wage for this role in our city is $32, and I’m at $28.” Companies will often pay more if you can show you’re below market rate.
Switch companies strategically
External moves typically deliver 10-20% pay increases, while internal raises average 3-5%. If you’ve hit a ceiling at your current job, a competitor might pay significantly more for the same work. Job hopping every 2-3 years is normal now, especially early in your career.
Move into management or specialized roles
Supervisors, team leads, and technical specialists earn $8-20 more per hour than individual contributors doing similar work. If you can manage people or develop deep expertise in a niche area, your hourly rate will climb faster.
Relocate to higher-paying markets
Geographic arbitrage works. A software developer earning $35/hour in Nashville might get $55/hour in Seattle. Remote work makes this easier—you can sometimes keep a high-wage job while living in a low-cost area. Research which cities pay the most for your role.
Hourly Wage vs. Annual Salary vs. Total Compensation
These terms all describe pay, but they measure different things.
Hourly Wage
Your base rate per hour before any additions. It’s clean and simple: $30/hour means you get $30 for every hour worked. Easy to calculate, easy to compare across part-time and full-time jobs.
Annual Salary
Your total yearly pay if you work full-time all year. A $60,000 salary sounds bigger than $28.85/hour, but it’s the same money. Salaried workers don’t track hours, so they might work 45 or 50 hours some weeks with no extra pay. That lowers their effective hourly rate.
Total Compensation
Includes everything: base pay, bonuses, health insurance, 401(k) match, stock options, and paid time off. A $60,000 salary with $15,000 in benefits is really worth $75,000 per year, or $36/hour. This is your true hourly value.
When to use each
Hourly wage works for comparing jobs and setting freelance rates. Annual salary makes budgeting easier. Total compensation shows your real worth and helps you weigh offers that include big benefits packages against those with higher base pay but no perks.
Pro tip for finance teams: Always calculate fully-loaded hourly cost when budgeting headcount. A $40/hour employee actually costs $55-60/hour when you add payroll taxes, benefits, and overhead. Use total compensation, not base wage, for accurate project costing and profitability analysis.
Know your worth
Understanding your hourly wage helps you make smarter career and financial decisions. Whether you’re negotiating a raise, comparing job offers, or budgeting your time, this number matters.Get started with Coefficient to automate your wage calculations and build better compensation strategies.
 Sync Live Finance Data into Your Spreadsheet


