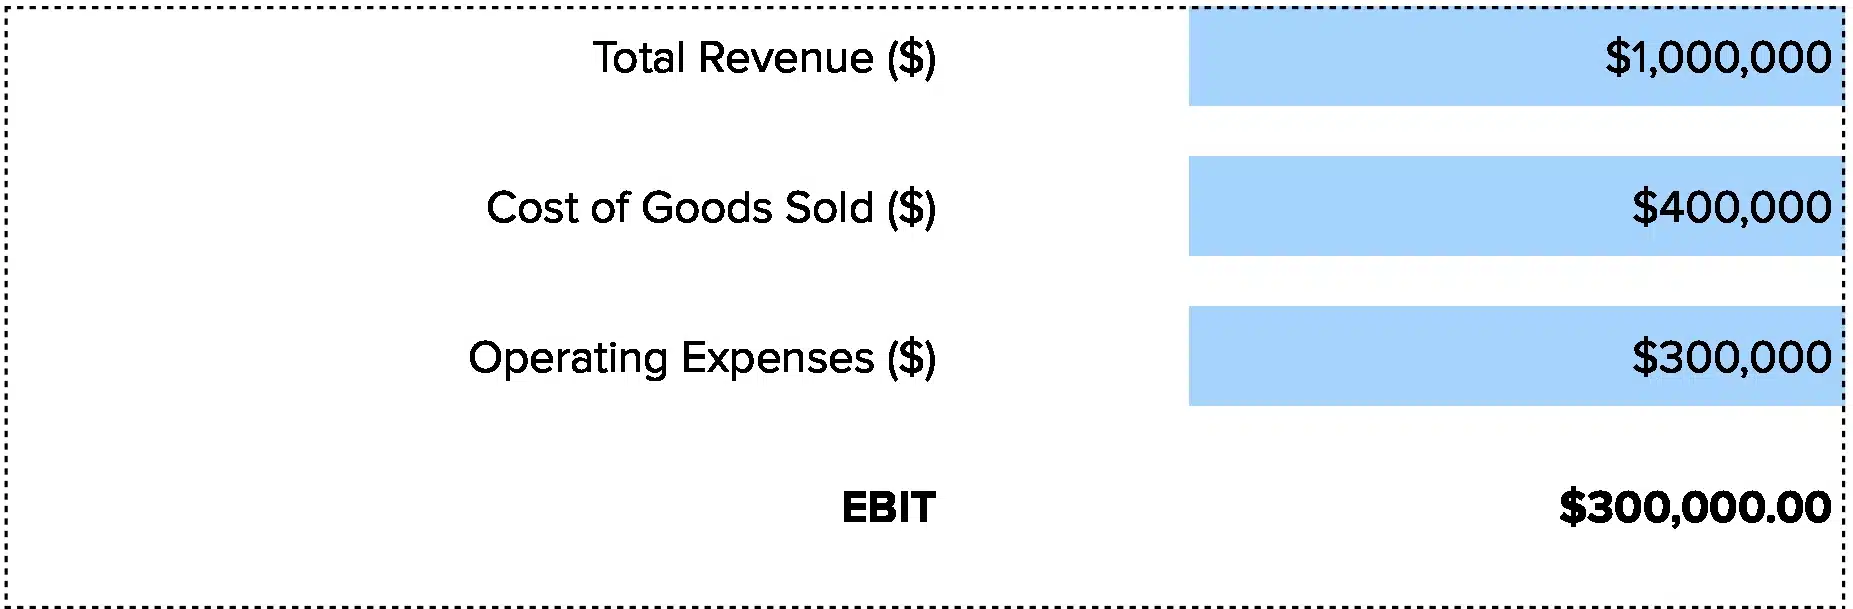


EBIT = Revenue – Cost of Goods Sold – Operating Expenses
Or work from the bottom:
EBIT = Net Income + Interest Expenses + Tax Expenses
Let’s break each part down.
Revenue: All cash from sales before any costs. For a shop, it’s the total ring ups. For a SaaS firm, it’s all fees paid.
Cost of Goods Sold (COGS): Direct costs to make what you sell. Raw goods, labor, and plant costs. A car maker’s COGS has steel, tires, worker pay, and plant power.
Operating Expenses: Day to day costs not tied to making goods. Office rent, admin pay, ads, and R&D spend.
Net Income: Your bottom line after all costs, interest, and taxes.
Interest Expenses: What you pay on loans and debt.
Tax Expenses: Income taxes you owe.
Why This Formula Works: The first way works best when you track ops closely. The second helps when you start from net income and add back what EBIT should skip—interest and taxes.
What Is EBIT?
EBIT stands for Earnings Before Interest and Taxes. It shows profit from your core work, not how you fund it or what you owe in taxes. Think of it as your base profit power.
EBIT cuts through noise. Two firms might have the same net income, but one has heavy debt while the other has none. EBIT lets you see which one runs better at its core task.
Who uses this metric?
CFOs and Controllers track EBIT to see if ops are strong and costs are in check.
Fractional CFOs use it to compare firms with different debt and tax setups.
Financial Analysts rely on EBIT to value firms and build profit models.
Private Equity Firms assess targets based on EBIT to see true business strength.
Lenders and Credit Analysts check if EBIT can cover interest costs before they lend.
How to Calculate EBIT: Step-by-Step
Let’s walk through a real case with clear numbers.
- Gather your income statement
Get your latest P&L. You’ll need revenue, COGS, operating expenses, and possibly net income if working backward.
- Note your total revenue
For our example, let’s say your firm brought in $2,500,000 in sales last year.
- Find your COGS
Your COGS was $1,200,000. This includes all direct costs to make your product.
- Identify operating expenses
You spent $800,000 on rent, pay, ads, and other costs not tied to making goods.
- Apply the EBIT formula
Subtract COGS and operating expenses from revenue:
$2,500,000 – $1,200,000 – $800,000 = $500,000 EBIT
- Interpret your result
An EBIT of $500,000 means your core work made half a million in profit before interest and taxes. This is your ops power. If your EBIT margin is 20% ($500,000 ÷ $2,500,000), you keep $0.20 of every dollar as core profit.
- Compare to prior periods
Track this over time. If EBIT drops while revenue stays flat, your costs are rising or margins are shrinking.
How to Interpret Your EBIT Number
EBIT alone doesn’t tell the full story. You need to look at your EBIT margin (EBIT ÷ Revenue × 100) to judge health.
| EBIT Margin Range | Interpretation | Recommended Actions |
| Below 5% | Weak profitability – Your core work barely makes money. Costs may be too high or pricing too low. | • Cut discretionary spending<br>• Review supplier contracts<br>• Raise prices where possible<br>• Audit all operating costs |
| 5% – 10% | Modest profitability – You’re making money but have little buffer for downturns or surprise costs. | • Improve cost controls<br>• Seek efficiency gains<br>• Track EBIT monthly for trends<br>• Plan for better margins |
| 10% – 20% | Healthy profitability – Strong operational performance. You have room to invest and handle bumps. | • Maintain discipline<br>• Invest in growth initiatives<br>• Monitor competitive shifts<br>• Keep benchmarking peers |
| Above 20% | Excellent profitability – You’re in top form. Few firms reach this level outside tech or pharma. | • Sustain operational excellence<br>• Consider strategic investments<br>• Watch for market saturation<br>• Ensure pricing isn’t too high |
Context matters. A 15% EBIT margin in retail is great. In software, it’s just okay.
EBIT Benchmarks by Industry
EBIT margins vary widely across sectors. Your business model, capital needs, and market set your range.
| Industry | Typical EBIT Margin | Notes |
| Software / SaaS | 20% – 40% | Low COGS, high margins, scalable models with recurring revenue |
| Technology Hardware | 10% – 20% | High R&D costs, but strong pricing power in devices and components |
| Healthcare Services | 8% – 15% | Regulated pricing, high labor costs, reimbursement cycles affect margins |
| Pharmaceuticals | 15% – 30% | High R&D spend offset by patent protection and pricing control |
| Retail (General) | 3% – 8% | Thin margins, high competition, inventory and labor costs eat profit |
| Manufacturing | 5% – 12% | Capital-intensive, cyclical demand, raw material costs impact margins |
| Professional Services | 12% – 20% | Low capital needs, labor-driven model, margins depend on utilization rates |
| Food & Beverage | 4% – 10% | Commodity costs, distribution expenses, intense price competition |
Industry structure drives these gaps. Software has low variable costs once built. Retail must pay for goods, staff, and stores with every sale.
Capital intensity also plays a role. Manufacturing needs plants and gear, so depreciation cuts into profit even if EBIT looks okay. Service firms have fewer fixed assets and can run leaner.
Benchmark Citations
Investopedia: EBIT Formula and Example
FasterCapital: EBIT Margin Benchmarking Across Industries
AccountingInsights: EBITDA Margin by Industry
Automating EBIT Tracking with Coefficient
Stop pulling CSVs from NetSuite or QuickBooks each month. Coefficient links your accounting system to Excel or Google Sheets. Your EBIT updates itself from live data.
You save time. No more copy-paste. No more formula errors. Set it once and let your ratios refresh on a schedule.
Fractional CFOs love this. You can track ten clients from one dashboard. Each sheet pulls fresh numbers without manual work.
Get started now and automate your EBIT tracking.
How to Improve Your EBIT
A low EBIT signals room to grow. Here are five ways to lift your number.
Cut operating costs strategically
Review every line item. Cancel unused software. Renegotiate service deals. Trim travel budgets. Small cuts add up fast. Cutting $50,000 in annual spend drops straight to EBIT.
Improve gross margin
Raise prices where you can. Negotiate better rates with suppliers. Cut waste in production. If you boost gross margin by 2%, a $2M revenue firm gains $40,000 in EBIT.
Increase revenue without adding costs
More sales at current cost levels raise EBIT fast. Focus on high-margin products. Upsell existing clients. Add recurring revenue streams that don’t need new staff.
Automate manual processes
Labor costs eat profit. Automate order entry, billing, and reporting. A $100K annual wage saved goes right to your EBIT line.
Optimize your product mix
Some products make more money than others. Push your high-margin items. Drop or reprice low-margin work. A 10% shift toward better products can lift EBIT by 15-20%.
EBIT vs. EBITDA vs. Operating Income
These three metrics sound similar but differ in key ways.
EBIT (Earnings Before Interest and Taxes)
Your operating profit before financing and tax costs. Includes depreciation and amortization.
EBITDA (Earnings Before Interest, Taxes, Depreciation, and Amortization)
Adds back depreciation and amortization to EBIT. Shows cash-generating power better for capital-heavy firms.
Operating Income
Often the same as EBIT, but some firms include non-operating income. Always check definitions.
When to use each
Use EBIT when you want a clean ops view that includes asset wear. Use EBITDA when you need to see cash flow potential or compare firms with different asset bases. Use operating income when matching GAAP financial statements.
Pro tip for fractional CFOs: Present all three to clients. Show EBIT for core profit, EBITDA for cash generation, and operating income for GAAP compliance. This gives the full picture and helps clients see where their business stands versus peers.
Strengthen your core
A 5-point improvement in EBIT margin can double your bottom line profit. For a $5M revenue business, moving from 10% to 15% EBIT margin adds $250K to operating profit.
Focus on margin expansion first. Most companies find faster wins through pricing and cost control than through volume growth alone.
Get started with Coefficient to track your EBIT in real-time and spot margin problems before they hurt your bottom line.
 Sync Live Finance Data into Your Spreadsheet


