


Cash Conversion Cycle Formula Explained
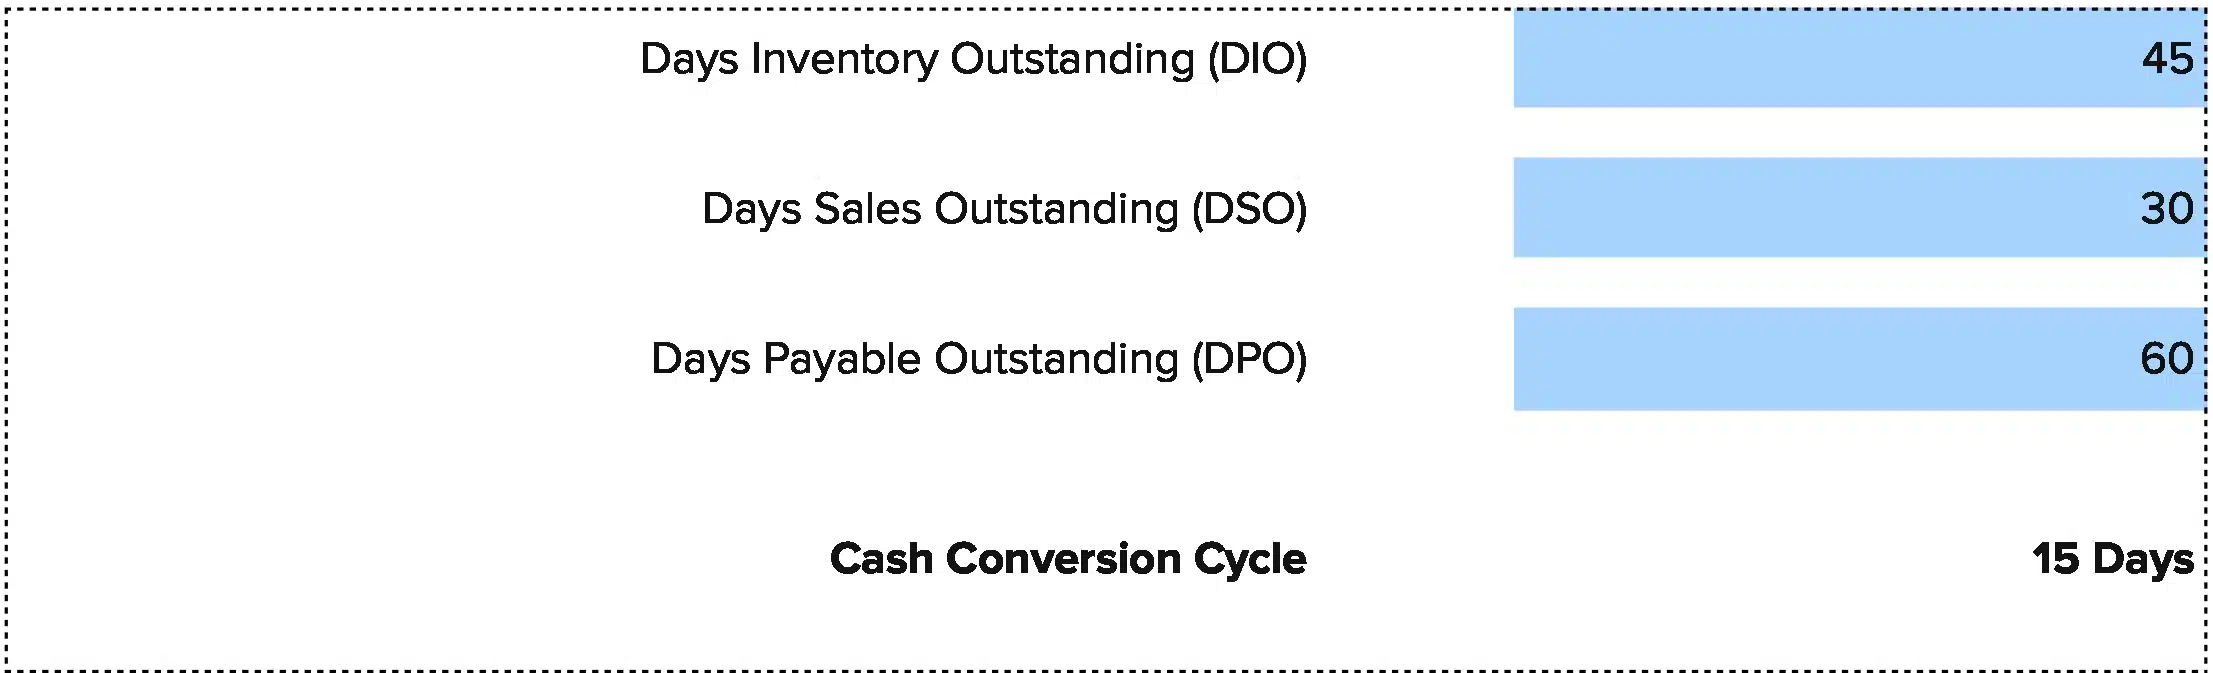
Cash Conversion Cycle (CCC) = Days Inventory Outstanding (DIO) + Days Sales Outstanding (DSO) – Days Payable Outstanding (DPO)
Here’s what each piece means:
Days Inventory Outstanding (DIO): How long you hold items before you sell them. The formula is (Average Inventory ÷ Cost of Goods Sold) × 365. This counts the days from when you buy or make goods until they sell. Longer times tie up more cash in stock.
Days Sales Outstanding (DSO): How long it takes to collect cash after a sale. The formula is (Average Accounts Receivable ÷ Revenue) × 365. This tracks the wait between sending an invoice and getting paid. Slow payers hurt your cash flow.
Days Payable Outstanding (DPO): How long you take to pay suppliers. The formula is (Average Accounts Payable ÷ Cost of Goods Sold) × 365. This shows how long you hold onto cash before paying bills. Longer is better for cash, but don’t risk vendor ties.
Why This Formula Works: The CCC adds the first two and takes away the third. You want to minimize the cash trapped in inventory and receivables while maximizing how long you can hold supplier payments. A shorter cycle means cash flows back to you faster.
What Is Cash Conversion Cycle?
Cash conversion cycle measures the time from when you pay cash to suppliers until you collect cash from customers. It tells you how many days your working capital is tied up in operations.
Think of it as a cash flow clock. A 45-day CCC means 45 days pass from paying for goods to getting customer cash. During those 45 days, you need enough cash or credit to keep running.
Companies with negative CCCs collect from customers before they pay suppliers. That’s rare but strong—you fund growth with other people’s money.
Who uses this metric?
CFOs and Controllers track CCC monthly to manage working capital and plan for cash needs.
Fractional CFOs use CCC to spot cash flow issues across client portfolios and guide improvement plans.
Credit Analysts review CCC trends when evaluating loan applications and setting credit terms.
Financial Analysts model CCC in cash flow forecasts and use it to value companies.
Operations Leaders target CCC reductions to free up cash for growth investments.
How to Calculate Cash Conversion Cycle: Step-by-Step
Let’s walk through a real example. We’ll use a mid-market manufacturing company.
- Gather your balance sheet and income statement data
You need these numbers for the same period: Average Inventory ($280,000), Average Accounts Receivable ($195,000), Average Accounts Payable ($150,000), Cost of Goods Sold annual ($1,825,000), and Revenue annual ($2,920,000).
- Calculate Days Inventory Outstanding (DIO)
DIO = (Average Inventory ÷ COGS) × 365
DIO = ($280,000 ÷ $1,825,000) × 365
DIO = 0.1534 × 365 = 56 days
This means inventory sits for 56 days on average before selling.
- Calculate Days Sales Outstanding (DSO)
DSO = (Average Accounts Receivable ÷ Revenue) × 365
DSO = ($195,000 ÷ $2,920,000) × 365
DSO = 0.0668 × 365 = 24 days
Customers take 24 days to pay invoices after purchase.
- Calculate Days Payable Outstanding (DPO)
DPO = (Average Accounts Payable ÷ COGS) × 365
DPO = ($150,000 ÷ $1,825,000) × 365
DPO = 0.0822 × 365 = 30 days
You pay suppliers 30 days after receiving goods or services.
- Apply the CCC formula
CCC = DIO + DSO – DPO
CCC = 56 + 24 – 30 = 50 days
- Interpret your result
A 50-day CCC means cash is tied up in operations for 50 days. From the moment you pay for materials until you collect from customers, 50 days pass. During this time, you need working capital to cover payroll, rent, and other expenses. For manufacturing, 50 days is solid—it’s in the typical 50-100 day range. But there’s room to improve.
How to Interpret Your Cash Conversion Cycle Number
Your CCC reveals working capital efficiency and cash flow health.
| Ratio Range | Interpretation | Recommended Actions |
| Below 0 (negative) | Excellent cash position – You collect from customers before paying suppliers. Rare and strong. | • Monitor to maintain this edge<br>• Use freed cash for growth<br>• Consider early payment discounts for key suppliers<br>• Watch for terms that risk supplier ties |
| 0 – 30 days | Strong efficiency – Very fast cash flow, typical for high-speed businesses. | • Maintain current practices<br>• Document what’s working<br>• Look for seasonal trends<br>• Benchmark against top performers |
| 31 – 60 days | Healthy range – Good for many industries, especially with recurring revenue or moderate inventory. | • Review monthly trends<br>• Target one area for improvement<br>• Set benchmarks against peers<br>• Plan for growth cash needs |
| 61 – 90 days | Moderate concern – Cash is tied up longer than ideal. Risk grows if sales slow. | • Reduce slow-moving inventory<br>• Tighten credit policies<br>• Negotiate longer supplier terms<br>• Build cash reserves or credit line |
| Above 90 days | Major risk – Long cash cycle strains working capital. Act now. | • Conduct immediate inventory audit<br>• Implement strong collections process<br>• Renegotiate supplier terms<br>• Consider factoring receivables |
Cash Conversion Cycle Benchmarks by Industry
Your CCC target depends on your industry. Here’s how different sectors compare.
| Industry | Typical Range | Notes |
| Food & Beverage | 20-50 days | Fast turnover on perishable goods keeps cycles short |
| Technology/Software | 35-55 days | Quick inventory movement, varies by hardware vs. software |
| Consumer Goods | 40-70 days | Fast-moving products with solid payment terms |
| Retail | 60-90 days | Inventory holds longer despite quick customer payments |
| Automotive | 60-100 days | Long production and sales cycles extend time |
| Manufacturing | 50-100 days | Raw materials and production drive inventory days up |
| Apparel | 50-90 days | Seasonal inventory balanced by good supplier terms |
| Pharmaceuticals | 100-150 days | R&D and regulatory needs slow the cycle |
| Aerospace & Defense | 150-300 days | Complex, long-term contracts create longest cycles |
Business model matters as much as industry. Retailers with strong supplier terms can hit negative CCCs. Manufacturers with custom products face longer cycles due to production time.
Track your CCC trend over time. Dropping CCC means better efficiency. Rising CCC signals problems—maybe inventory is building, customers are paying slower, or you’re paying suppliers too fast.
Benchmark Citations
Ramp: Cash Conversion Cycle Benchmarks
Wall Street Prep: CCC Formula and Analysis
Automating Cash Conversion Cycle Tracking with Coefficient
Stop pulling CSV files from NetSuite, QuickBooks, or Xero each month. Coefficient connects your accounting system straight to Excel or Google Sheets. Your CCC components update on their own—no manual data entry.
Save 20-30 minutes per calculation with live data feeds. Zero copy-paste errors from direct system connections. Track daily or weekly to catch problems early. Manage multiple clients or entities from one dashboard.
Set it up once. Your working capital metrics refresh on schedule. Perfect for finance teams tracking performance across divisions or fractional CFOs managing multiple clients.
Try Coefficient Free and start tracking your CCC automatically.
How to Improve Your Cash Conversion Cycle
A high CCC signals opportunity. Here are five proven ways to free up trapped cash.
Reduce inventory holding time
Cut your DIO by 20-30% through better forecasting and lean inventory practices. Analyze which SKUs move slowly and run promotions to clear them. Switch to just-in-time ordering for high-volume items. Each 10-day reduction in DIO cuts your CCC by 10 days.
Speed up customer collections
Get paid faster by sending invoices within 24 hours of delivery. Offer 2% discounts for payment within 10 days. Automate payment reminders at 15, 30, and 45 days past due. For large customers, negotiate upfront deposits or milestone payments. Cutting DSO from 45 to 30 days frees up real cash.
Extend supplier payment terms
Negotiate longer payment windows with key suppliers. If you’re on net-30 terms, push for net-45 or net-60. This keeps cash in your business longer. Emphasize your strong payment history and growing volume. Even a 15-day DPO extension improves your CCC by 15 days.
Eliminate slow-moving products
Audit inventory quarterly. Any item sitting for more than 90 days should be discounted, bundled, or scrapped. Each dollar freed from dead stock drops straight to your working capital. Focus purchases on proven fast movers.
Tighten credit policies
Review customer credit terms every six months. Require credit checks for orders over $5,000. Set shorter terms for new customers. For chronic slow payers, switch to deposits or shorter terms. Better yet, offer modest discounts for immediate payment.
Cash Conversion Cycle vs. Operating Cycle vs. Working Capital Ratio
People often confuse CCC with related metrics. Here’s how they differ.
Operating Cycle
Measures DIO + DSO only. It ignores when you pay suppliers. Operating Cycle = 56 + 24 = 80 days in our example above. It shows how long cash is tied up in inventory and receivables, but doesn’t account for supplier payment timing.
Cash Conversion Cycle
Adds supplier payment timing. CCC = Operating Cycle – DPO. It gives you the true cash-to-cash timeline. Use CCC when you want to understand working capital needs.
Working Capital Ratio
(Current Assets ÷ Current Liabilities) shows if you have enough liquid assets to cover short-term obligations. A ratio of 1.5 means $1.50 in current assets for each $1.00 of current liabilities. It’s a snapshot measure, while CCC tracks time.
When to use each
Use Operating Cycle to assess how well you move inventory and collect receivables. Use CCC when planning cash needs or comparing to industry benchmarks. Use Working Capital Ratio for liquidity checks and credit analysis.
Pro tip for fractional CFOs: Present all three metrics together. Show clients how a 60-day Operating Cycle becomes a 35-day CCC thanks to 25-day supplier terms. Then connect it to the Working Capital Ratio to tell the complete cash story. This builds trust and highlights where to focus improvement efforts.
Free up your cash
A 20-day improvement in CCC can free up hundreds of thousands in working capital. For a business with $5M in annual revenue, reducing CCC from 60 to 40 days typically frees up $275K in cash.
Focus on your biggest opportunity first. Most companies see the fastest results from inventory reduction or faster collections.
Get started with Coefficient to track your CCC in real-time and catch cash flow problems before they become crises.
 Sync Live Finance Data into Your Spreadsheet


