


Billable Hours = Total Hours Worked × Billable Utilization Rate
Or calculate directly:
Billable Hours = Time Spent on Client Work (excluding non-billable activities)
This free billable hours calculator eliminates the busywork. Whether you need a quick calculation for a single project or want to automate ongoing time tracking, you’ll learn how to calculate, interpret, and track billable hours efficiently.
Professional services firms live or die by billable hours.
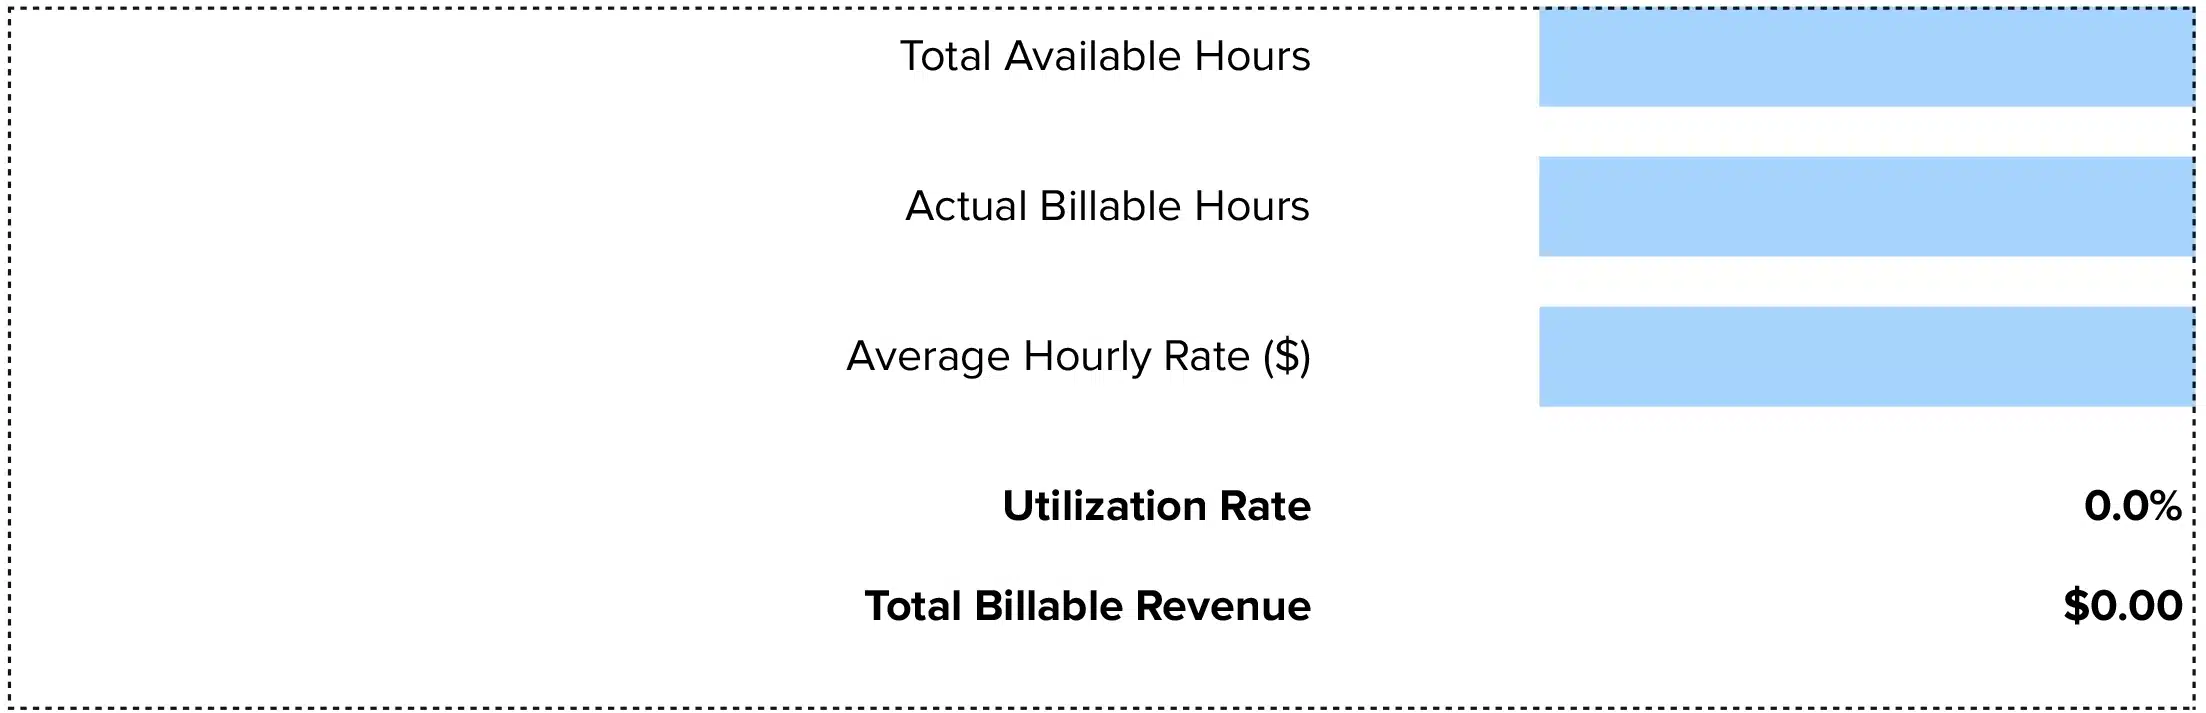
Excel and Google Sheets template you can download and customize for your specific needs.
Billable Hours Formula Explained
Billable Hours = Total Hours Worked × Billable Utilization Rate
Or calculate directly:
Billable Hours = Time Spent on Client Work (excluding non-billable activities)
Let’s break down each component:
Time Spent on Client Work: This includes client meetings, project delivery, research specific to a client matter, document preparation, travel for client engagements, and email correspondence about active projects. This is the time you can invoice to clients because it directly benefits their work.
Non-Billable Time: We exclude this because it doesn’t generate revenue. Non-billable time includes internal meetings, administrative tasks, professional development, business development, general email management, and breaks. While these activities are essential for running your business, clients don’t pay for them.
Billable Utilization Rate: This measures what percentage of your total work time translates to billable hours. If you work 40 hours but only 28 hours are billable, your utilization rate is 70% (28 ÷ 40). This metric reveals how efficiently your team converts time into revenue.
Why This Formula Works: It helps you track both individual and team productivity. You can measure how much time generates revenue versus how much time supports the business. This data drives better pricing, staffing decisions, and profitability planning.
What Is Billable Hours?
Billable hours represent the time your team spends working on activities that directly benefit a specific client and can be invoiced. This is the core revenue driver for professional services firms—from law firms to consulting agencies to accounting practices.
Think of billable hours as your inventory. Unlike retail, which sells products, professional services firms sell time. Your team’s expertise, delivered in hourly increments, is the product. Every hour billed is revenue captured. Every hour lost to poor tracking or inefficient processes is money left on the table.
The challenge? Most professionals only bill 60-70% of their working hours. The rest disappears into administrative tasks, meetings, and activities that keep the business running but don’t generate direct revenue.
Who uses this metric?
CFOs and Controllers track billable hours to monitor revenue performance and forecast cash flow across client engagements.
Professional Services Firm Owners use billable hours to price services, evaluate profitability, and make hiring decisions based on capacity utilization.
Project Managers monitor billable hours to ensure projects stay within budget and identify when scope creep threatens profitability.
Consultants and Attorneys track their own billable hours to meet firm targets, typically ranging from 1,800 to 2,200 hours annually depending on seniority level.
Fractional CFOs analyze billable hours across multiple client portfolios to optimize their own utilization rates and pricing strategies.
How to Calculate Billable Hours: Step-by-Step
Let’s walk through calculating billable hours with a practical example for a mid-sized consulting firm.
- Track total hours worked in a period
Start by recording all time spent working during your measurement period. For our example, your consultant worked 160 hours in March (4 weeks × 40 hours/week).
- Identify billable activities
Review the time log and separate billable from non-billable activities. Billable work includes 92 hours on client project deliverables, 18 hours in client meetings, 12 hours on client-specific research, and 8 hours of client email correspondence.
Total billable time: 92 + 18 + 12 + 8 = 130 hours
- Identify non-billable activities
The remaining time breaks down as 12 hours in internal team meetings, 8 hours on administrative tasks, 6 hours for professional development, and 4 hours on business development calls.
Total non-billable time: 12 + 8 + 6 + 4 = 30 hours
- Verify your math
Check that billable plus non-billable equals total hours: 130 billable hours + 30 non-billable hours = 160 total hours worked. The numbers match.
- Calculate billable hours directly
In this case, your billable hours for March are simply 130 hours. This is the time you can invoice to clients.
- Calculate utilization rate (optional but valuable)
Divide billable hours by total hours worked: 130 ÷ 160 = 0.8125 or 81.25% utilization rate.
- Interpret your result
With 130 billable hours in a 160-hour month, this consultant achieved an 81% utilization rate. This exceeds the professional services average of 68-70% and indicates strong productivity. At a $200/hour rate, these 130 hours generate $26,000 in revenue for the month.
How to Interpret Your Billable Hours Number
Your billable hours and utilization rate reveal efficiency and revenue potential.
| Utilization Range | Interpretation | Recommended Actions |
| Below 50% | Critical underutilization – Revenue at risk from insufficient client work | • Increase business development efforts<br>• Review project allocation process<br>• Assess if team is overstaffed<br>• Examine time tracking accuracy |
| 50% – 65% | Below target – Common for senior staff but concerning for delivery-focused roles | • Reduce non-billable meeting time<br>• Streamline administrative processes<br>• Improve project pipeline visibility<br>• Set role-specific utilization goals |
| 65% – 75% | Target range – Healthy balance for most professional services roles | • Maintain current practices<br>• Document what’s working well<br>• Monitor trends monthly<br>• Share best practices across team |
| 75% – 85% | Strong performance – Excellent utilization indicating efficient operations | • Ensure team isn’t overworked<br>• Look for capacity to take more work<br>• Consider this benchmark for others<br>• Reward high performers |
| Above 85% | Unsustainable – Risk of burnout and quality issues | • Add team capacity immediately<br>• Review for administrative support needs<br>• Check project scoping accuracy<br>• Monitor employee satisfaction closely |
Billable Hours Benchmarks by Industry
Understanding how your billable hours compare to industry peers provides crucial context for setting realistic targets and identifying improvement opportunities.
| Industry | Typical Utilization | Notes |
| Law Firms (Associates) | 70% – 80% | 1,800-2,000 billable hours annually; large firms expect higher utilization |
| Law Firms (Partners) | 55% – 70% | Lower due to business development, firm management, and mentoring responsibilities |
| Management Consulting | 65% – 75% | Project-based work with gaps between engagements; top firms expect 75%+ |
| Accounting & Tax | 60% – 75% | Seasonal peaks during tax season; steady client work year-round |
| IT Consulting | 70% – 80% | Implementation work is highly billable; presales and scoping reduce averages |
| Marketing Agencies | 60% – 70% | Creative work includes non-billable ideation; account management adds overhead |
| Architecture & Engineering | 65% – 75% | Project phases affect utilization; design work more billable than permits |
| Financial Advisory | 60% – 70% | Client relationships require non-billable time; planning work is billable |
Why benchmarks vary
Industry benchmarks differ based on several factors. Client engagement models matter—retainer-based work produces steadier utilization than project-based engagements with gaps between assignments. Seniority level plays a major role, with senior professionals spending more time on business development and strategy. Firm size affects benchmarks too, as smaller firms require partners to wear multiple hats while large firms can specialize roles more efficiently.
The nature of the work itself drives variation. Creative and strategic work requires non-billable thinking time. Complex problem-solving means more research and learning. Regulatory or compliance-heavy industries face documentation burdens that reduce billable percentages.
Benchmark Citations
SPI Research 2025 Professional Services Maturity Benchmark
LeanLaw Mid-Sized Law Firm Billing Study
Automating Billable Hours Tracking with Coefficient
Stop manually exporting time tracking data from your project management tools every week. Coefficient connects your time tracking system directly to Excel or Google Sheets, automatically importing billable hours, utilization rates, and project data. Your reports update themselves from live data.
Coefficient eliminates the monthly scramble to compile billable hours across your team. Connect once to tools like Harvest, Toggl, or your practice management software, and pull real-time data into your existing spreadsheet templates. Schedule automatic refreshes daily or weekly, and your utilization dashboards stay current without manual work.
Perfect for professional services firms tracking billable hours across multiple projects, clients, and team members. Your CFO gets accurate data, your project managers see real-time utilization, and your team stops wasting time on data entry.
Get started with Coefficient and automate your billable hours reporting in minutes.
How to Improve Your Billable Hours
Weak utilization rates signal opportunity, not failure. These proven strategies help professional services firms capture more billable hours without working longer days.
Implement real-time time tracking
The data is stark: Recording time immediately captures 100% of billable hours. Wait until end of day and you lose 10%. Next day loses 25%. By week’s end, you’ve lost 50% of potential revenue. Deploy time tracking software that runs in the background and prompts users to categorize activities throughout the day. This single change can add 5-10% to your billable hours.
Reduce non-billable meeting time
Internal meetings are billable hour killers. Audit your calendar and cut recurring meetings that don’t directly support client delivery. Move status updates to async communication. Set 25-minute defaults instead of 30, and 50-minute defaults instead of 60. These small changes return 200-300 hours annually per team member.
Automate administrative tasks
Administrative work typically consumes 20-30% of professional services time. Automate expense reporting, time sheet approval workflows, and invoice generation. Use templates for proposals and contracts. This automation converts 4-6 hours weekly from non-billable to billable activities, adding $10,000-$15,000 annual revenue per person at typical billing rates.
Set clear utilization targets by role
Different roles should hit different targets. Junior staff should achieve 75-80% utilization since they focus on delivery work. Senior staff need 65-70% due to client development and mentoring responsibilities. Partners realistically target 55-65% as they focus on business development. Clear targets aligned with role responsibilities drive better performance.
Optimize project staffing and allocation
Poor project allocation destroys utilization. Use capacity planning tools to match available hours with project needs. Avoid having team members split across too many small projects—context switching wastes billable time. Aim for 2-3 concurrent projects per person maximum, with one primary focus taking 60%+ of their time.
Billable Hours vs. Utilization Rate vs. Realization Rate
Professional services firms track multiple related metrics that measure different aspects of time and revenue. Understanding the distinctions helps you diagnose where revenue leaks occur.
Billable Hours
Measures the raw count of hours spent on client work that can be invoiced. If a consultant works on a client project for 120 hours in a month, that’s 120 billable hours. This metric tracks volume of client-facing work.
Utilization Rate
Measures the percentage of total working time that becomes billable. It answers: “How efficiently do we convert working time into billable time?” Calculate it as (Billable Hours ÷ Total Hours Worked) × 100. A consultant with 120 billable hours out of 160 total hours achieves 75% utilization. This metric reveals productivity and efficiency.
Realization Rate
Measures what percentage of billable work actually gets invoiced and collected. It answers: “How much of our billable time converts to revenue?” Calculate it as (Revenue Collected ÷ Billable Hours × Standard Rate) × 100. If you work 120 hours at $200/hour ($24,000) but only collect $21,600, your realization rate is 90%. This metric exposes discounting, write-offs, and collection issues.
When to use each
A firm can have high billable hours but still struggle financially. For example: 1,800 billable hours annually × $250/hour = $450,000 potential revenue. But with 88% realization rate, actual revenue drops to $396,000. You worked the hours but lost $54,000 to discounts, write-offs, or unpaid invoices.
Pro tip for fractional CFOs: Track all three metrics monthly for each client engagement. If billable hours are low, fix capacity planning. If utilization is low, address internal inefficiencies. If realization is low, examine pricing, scope management, and collections processes. Each metric points to different operational improvements.
Track what matters
With 130 billable hours captured instead of 90, you’re looking at $8,000 more revenue per month per person. That’s $96,000 annually from better time tracking alone.
Start with real-time tracking, cut non-billable meetings, and set clear targets by role. These three changes typically lift utilization by 10-15 percentage points within 90 days.Get started with Coefficient to automate your billable hours tracking and stop losing revenue to manual processes.
 Sync Live Finance Data into Your Spreadsheet


