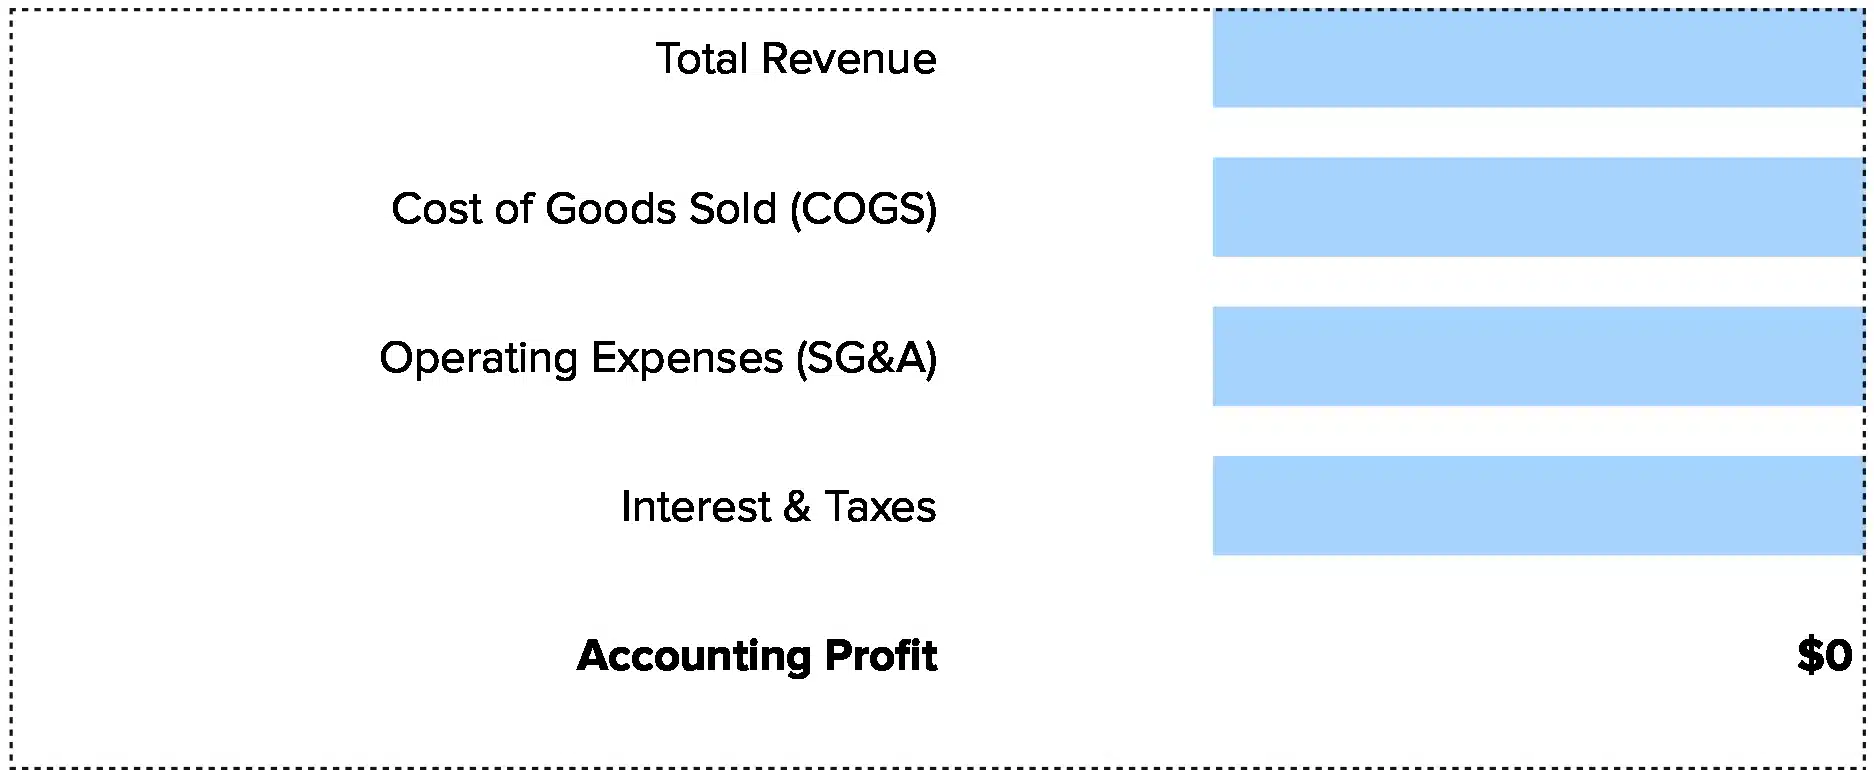


Accounting Profit = Total Revenue – Explicit Costs
This free accounting profit calculator shows you exactly how much profit your company earned in a given period. Whether you need a quick calculation for month-end close or want to automate ongoing profit tracking, you’ll learn how to calculate, interpret, and track accounting profit efficiently. We’ve also included a free Excel and Google Sheets template you can download and customize for your specific needs.
Get the numbers you need without the busywork.
Accounting Profit Formula Explained
Accounting Profit = Total Revenue – Explicit Costs
Let’s break down each component:
Total Revenue: All money your company brings in from sales. This includes product sales, service fees, subscription revenue, and any other income your business generates during the period. Most companies pull this number directly from their income statement.
Explicit Costs: Out-of-pocket expenses you can measure and document. This includes cost of goods sold (materials, production, inventory), operating expenses (salaries, rent, utilities, marketing), depreciation on equipment and buildings, interest payments on loans, and taxes paid to government entities.
Why do we use explicit costs? Because accounting profit measures cash that actually left your business. This is different from economic profit, which includes opportunity costs and theoretical expenses. Accounting profit focuses on real transactions recorded in your books according to GAAP standards.
What Is Accounting Profit?
Accounting profit is your company’s net income. It shows real profit based on actual transactions recorded in your financial statements. This is the number that appears on your income statement as “net income” or “net profit.”
Companies use accounting profit to report performance to investors, file tax returns, evaluate management effectiveness, and compare results across time periods. Unlike economic profit, which includes theoretical costs, accounting profit uses only documented expenses.
Who uses this metric?
CFOs and Controllers rely on accounting profit for financial reporting, board presentations, and compliance requirements. They use it to assess overall company performance and guide strategic decisions.
Fractional CFOs track accounting profit across multiple client portfolios to quickly identify profitable businesses versus those burning cash.
Financial Analysts use accounting profit to build financial models, forecast future performance, and compare companies within the same industry.
Tax Accountants calculate taxable income based on accounting profit, adjusting for specific tax regulations and deductions.
Investors and Lenders evaluate accounting profit to assess creditworthiness, make lending decisions, and determine company valuation.
How to Calculate Accounting Profit: Step-by-Step
Let’s walk through the calculation process.
- Pick your time period
Choose the period you want to measure. Most companies track accounting profit monthly, quarterly, or annually. For this example: Q1 2025.
- Total all revenue sources
Product sales: $850,000
Service revenue: $120,000
Total Revenue: $970,000
- Calculate cost of goods sold
Raw materials: $240,000
Production labor: $180,000
Manufacturing overhead: $60,000
Total COGS: $480,000
- Add operating expenses
Salaries: $175,000
Rent and utilities: $45,000
Marketing: $35,000
Insurance and software: $20,000
Total Operating: $275,000
- Include depreciation, interest, and taxes
Depreciation: $15,000
Interest: $8,000
Taxes: $38,000
Total: $61,000
- Sum all costs
$480,000 + $275,000 + $61,000 = $816,000 Total Costs
- Calculate accounting profit
$970,000 – $816,000 = $154,000 Accounting Profit
This equals a 15.9% net profit margin, which is healthy for most industries.
How to Interpret Your Accounting Profit Number
Your profit margin needs context to be meaningful.
| Profit Margin | Interpretation | Recommended Actions |
| Negative (Loss) | Financial distress – Expenses exceed revenue. The company is losing money and burning through cash reserves. | • Cut discretionary spending immediately<br>• Negotiate extended payment terms with vendors<br>• Accelerate collections on receivables<br>• Consider emergency financing or capital raise |
| 0-5% | Concerning profitability – Minimal margin for error. Small revenue drops or cost increases push you into losses. | • Audit all expense categories for cuts<br>• Review pricing strategy for increases<br>• Improve operational efficiency<br>• Monitor cash flow weekly |
| 5-10% | Adequate profitability – Acceptable for many industries but limited cushion. You’re making money but vulnerable to economic shifts. | • Maintain current cost discipline<br>• Look for margin improvement opportunities<br>• Build cash reserves for buffer<br>• Track metrics monthly |
| 10-20% | Healthy profitability – Strong position with room to invest and grow. You have flexibility for strategic investments. | • Consider growth investments<br>• Maintain operational excellence<br>• Benchmark against competitors<br>• Plan for expansion or R&D |
| Above 20% | Excellent profitability – Very strong financial performance. Either exceptional efficiency or potential underinvestment in growth. | • Evaluate growth opportunities<br>• Consider strategic investments<br>• May have pricing power to test<br>• Ensure not underinvesting in team or infrastructure |
Accounting Profit Benchmarks by Industry
Your profit margin means little without context. Compare your results to industry peers.
| Industry | Typical Net Profit Margin | Notes |
| SaaS / Software | 15-25% | High gross margins (70-90%) but significant R&D and sales costs. Mature SaaS companies often exceed 20%. |
| Professional Services | 10-20% | Labor-intensive with high salary costs. Profit margins depend heavily on utilization rates. |
| Manufacturing | 5-10% | Significant overhead including raw materials, labor, and equipment depreciation. Volume matters. |
| Retail | 2-6% | Thin margins due to high COGS and competitive pricing. Success depends on inventory turns. |
| Healthcare Services | 8-15% | Variable depending on payer mix, reimbursement rates, and service model. |
| Construction | 3-8% | Project-based with high material and labor costs. Margins vary by specialization. |
| Hospitality / Food Service | 3-9% | High fixed costs (rent, labor) and low margins. Location and concept drive profitability. |
| Banking / Financial Services | 20-30% | High margins due to lower COGS, but heavily regulated with compliance costs. |
Several factors explain why benchmarks vary so widely. Business model matters most—asset-light services like software have lower costs than asset-heavy manufacturing. Scale plays a role too, as larger companies negotiate better supplier rates and spread fixed costs across more revenue. Competition intensity affects pricing power, with commoditized industries facing margin pressure while differentiated businesses command premiums.
Capital intensity also drives differences. Industries requiring heavy equipment, real estate, or inventory naturally show lower margins due to depreciation and financing costs. Finally, maturity stage impacts profitability—startups often sacrifice margins for growth while established companies optimize for profit.
Understanding these factors helps you set realistic targets. A 6% margin might signal trouble for a consulting firm but represent excellent performance for a grocery retailer.
Benchmark Citations
Net Profit Margin and Benchmark per Industry
Operating and Net Margins – NYU Stern
Industry Benchmarks – FullRatio
Automating Accounting Profit Tracking with Coefficient
Stop manually exporting CSVs from NetSuite, QuickBooks, or Sage Intacct every month. Coefficient connects your accounting system directly to Excel or Google Sheets, automatically importing revenue, COGS, and expense data. Your accounting profit calculates itself from live data.
You set up the connection once, and your P&L metrics update automatically. No more copy-paste errors or stale spreadsheets. Perfect for finance teams tracking multiple entities or fractional CFOs managing several client portfolios from one dashboard.
Get started with Coefficient to automate your profit tracking today.
How to Improve Your Accounting Profit
Margins don’t improve by accident. Here’s how to boost profitability.
Increase revenue without proportional cost increases
Focus on higher-margin products or services. If your product mix includes both high-margin and low-margin offerings, shift sales efforts toward items with better margins. Add premium features or service tiers that command higher prices without significant cost increases.
Reduce cost of goods sold
Negotiate better rates with suppliers, especially for high-volume materials. Implement just-in-time inventory to reduce carrying costs. Improve production efficiency to lower labor costs per unit. Even a 5% reduction in COGS can significantly boost profit.
Cut operating expenses strategically
Audit all subscriptions and recurring expenses monthly. Renegotiate contracts for insurance, software, and services. Reduce office space if remote work is viable. Focus cuts on expenses that don’t impact revenue generation.
Improve pricing strategy
Many companies undercharge out of fear. Test 5-10% price increases on less price-sensitive products. Implement value-based pricing where customers pay for outcomes, not just your time or costs. Better pricing often delivers faster margin improvement than cost cutting.
Increase operational efficiency
Automate repetitive tasks to reduce labor hours. Streamline workflows to eliminate bottlenecks. Cross-train employees to maximize productivity. Better efficiency means more output with the same or lower costs.
Accounting Profit vs. Economic Profit vs. Gross Profit
These three metrics measure profitability differently. Know which one to use when.
Gross Profit
Revenue – Cost of Goods Sold. Profit before operating expenses. Shows how efficiently you produce or deliver your core product/service. Manufacturing and retail rely heavily on this.
Accounting Profit
Total Revenue – Explicit Costs. Net income after all documented expenses. Official profit number reported to IRS, investors, and stakeholders. Best for financial reporting, tax filing, investor presentations, and management performance evaluation.
Economic Profit
Total Revenue – (Explicit Costs + Implicit Costs). True profitability including opportunity costs like owner’s time or alternative uses of capital. Best for strategic decision-making, comparing business opportunities, and evaluating if you should stay in business.
When to use each
Gross profit tells you if your core business model works. Accounting profit tells you if your company made money according to GAAP. Economic profit tells you if you’re better off running this business versus your next best alternative.
Each metric serves a different purpose. Use gross profit to evaluate operational efficiency and pricing decisions. Use accounting profit for external reporting and compliance. Use economic profit for strategic decisions about resource allocation.
Pro tip for fractional CFOs: Present both accounting profit and economic profit to business owner clients. A company showing $200K accounting profit but requiring $250K of owner time valued at market rates actually produces negative economic profit. This insight often drives decisions about hiring, selling, or pivoting the business model.
Make better decisions
Track your accounting profit monthly. Compare to industry benchmarks. Use the numbers to guide pricing, cost control, and growth investments.
Get started with Coefficient to stop manual exports and start tracking profit automatically.
 Sync Live Finance Data into Your Spreadsheet


