Candlestick Chart Google Sheets: A Comprehensive Guide
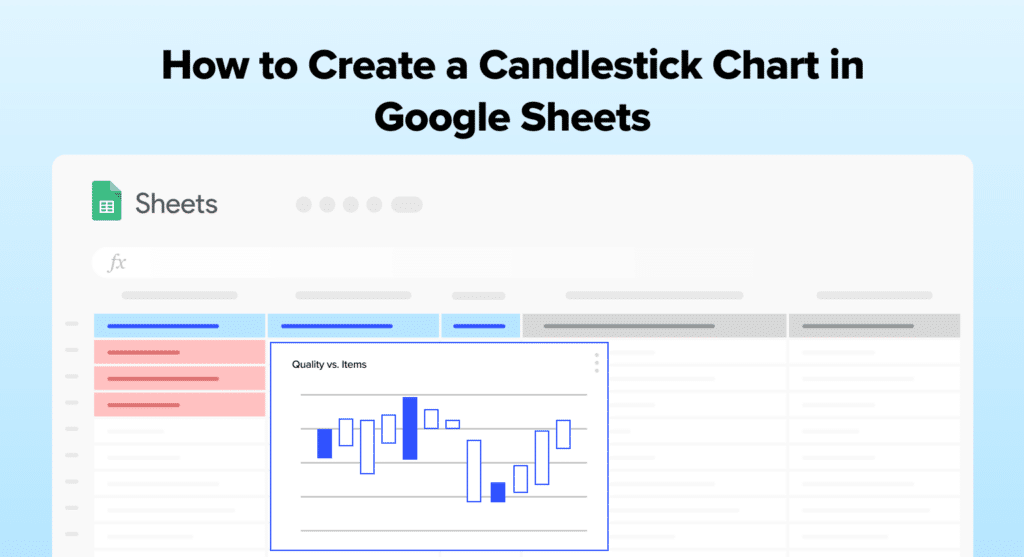
Candlestick charts are a crucial tool for business operations teams in B2B SaaS companies. They provide a clear visual representation of financial data, such as quarterly sales performance,...
Candlestick charts are a crucial tool for business operations teams in B2B SaaS companies. They provide a clear visual representation of financial data, such as quarterly sales performance,...
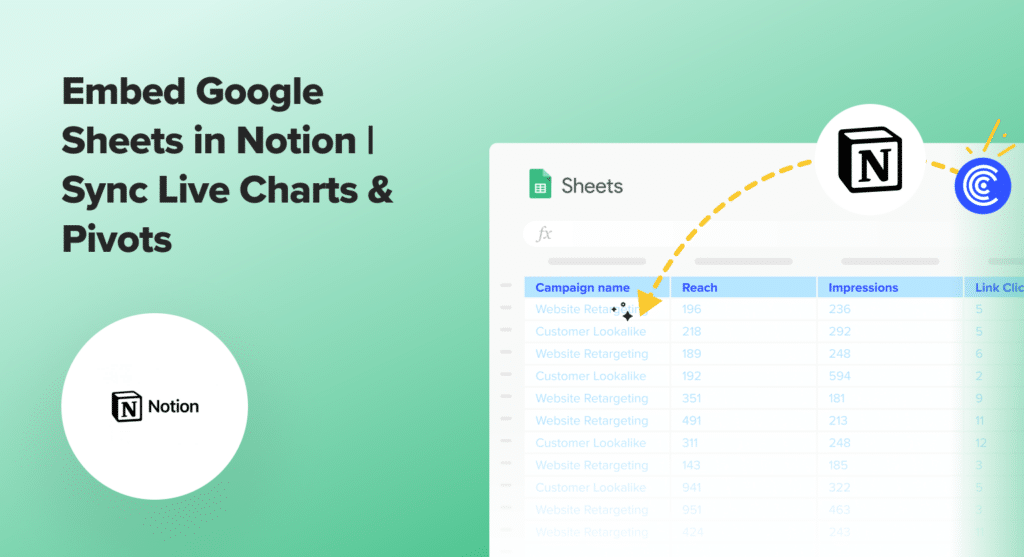
Integrating Google Sheets into Notion elevates productivity for teams and individuals in our increasingly data-driven world. Notion’s flexibility combined with the dynamic capabilities of Google Sheets revolutionizes how...
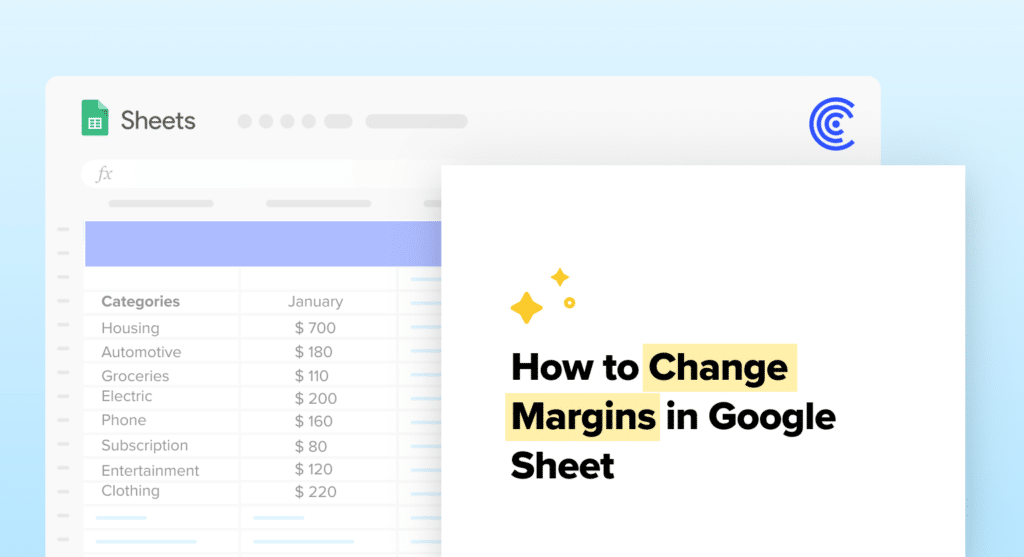
Adjusting margins in your Google Sheets documents is a key step in creating organized, easy-to-read financial reports, sales analyses, or any business-related document. This guide walks you through...
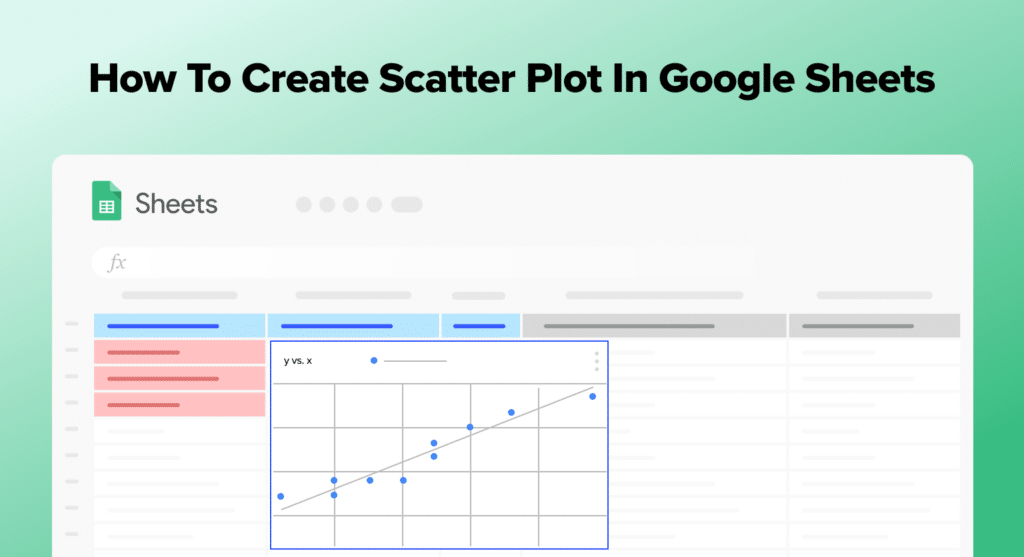
Scatter plots are invaluable for business analysts, revealing insights into relationships between different business metrics. Google Sheets offers a straightforward way to create these plots. This guide will...
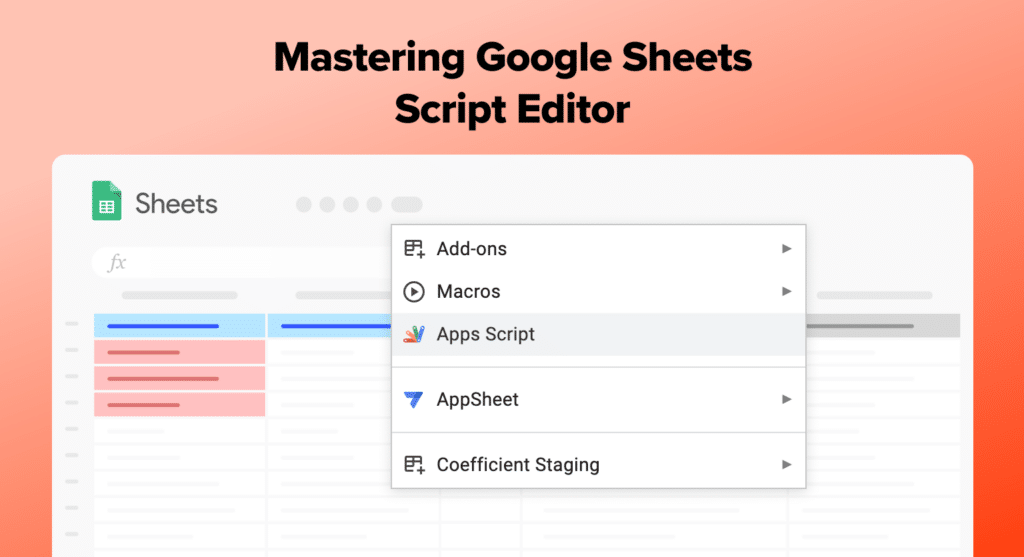
Google Sheets Script Editor is an integral part of the Google Sheets platform, offering users the ability to customize and extend the functionality of their spreadsheets. The Script...
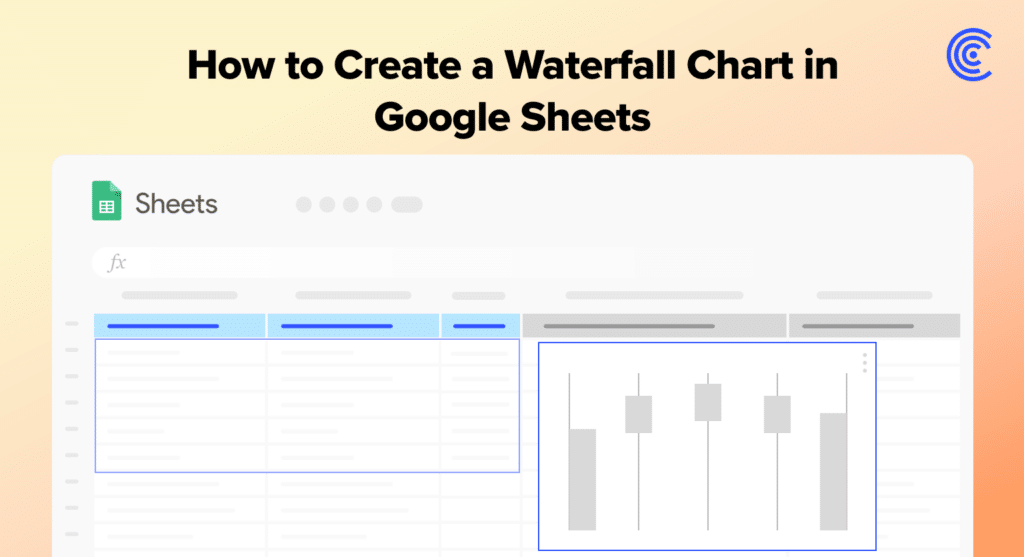
Waterfall charts are indispensable in business analytics for visualizing sequential financial changes. Particularly for B2B SaaS companies, they provide clarity on complex data like revenue streams, expenses, and...

Understanding Heatmaps in Google Sheets Concept and Purpose Heatmaps in Google Sheets use color gradients to represent data values visually. They are essential for businesses to quickly highlight...
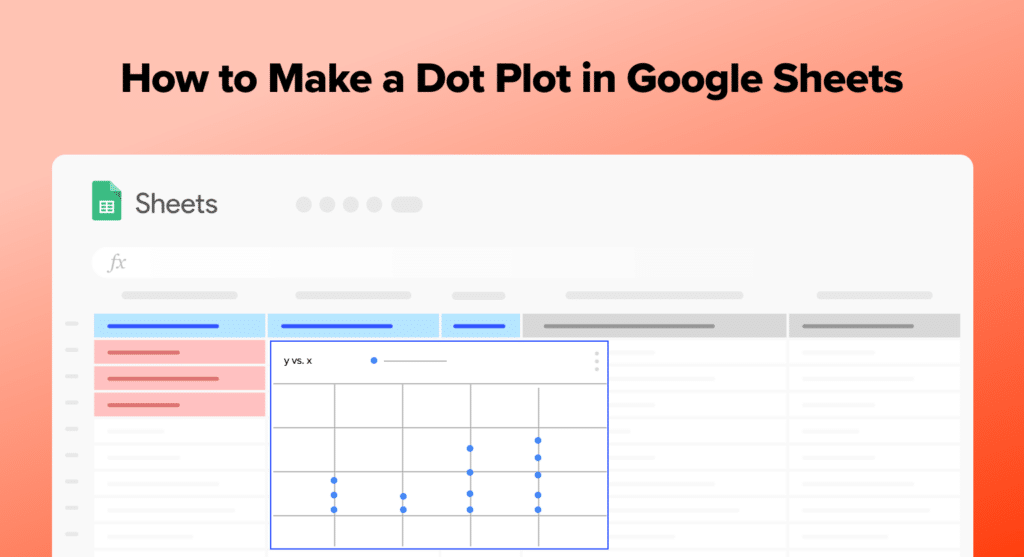
Creating a dot plot in Google Sheets is an essential skill for data analysts, especially in the realm of business operations. Dot plots offer a straightforward method to...
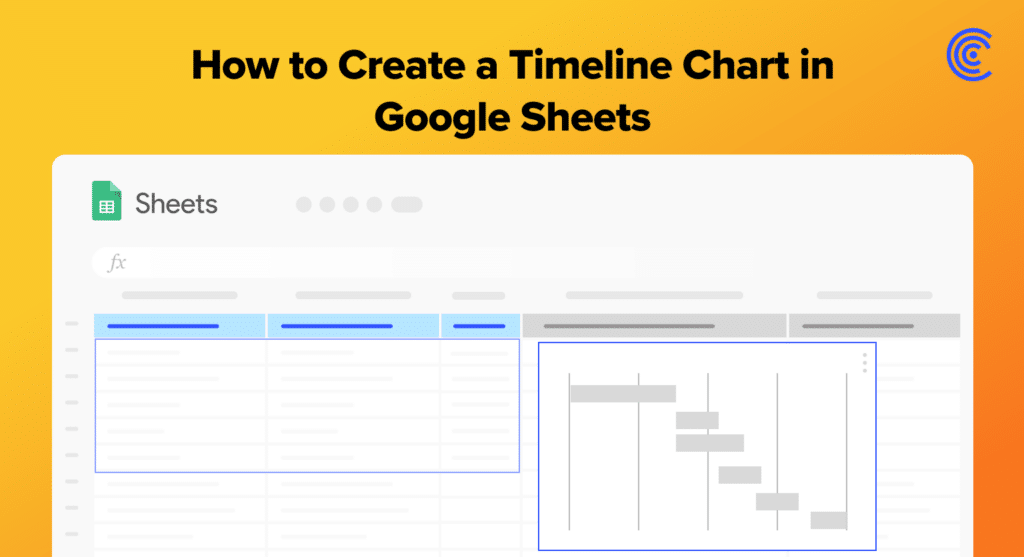
Google Sheets offers a powerful feature for visualizing data over time with timeline charts. These charts help users understand trends, patterns, and make sense of data by presenting...
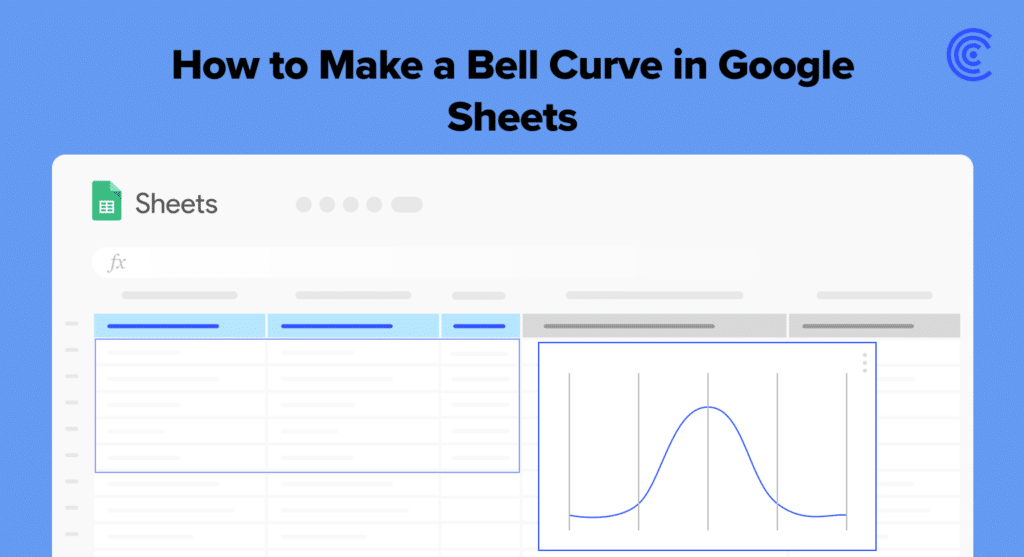
A bell curve is a graphical representation of a normal distribution, which is a type of probability distribution that occurs frequently in various data sets. Bell curves are...
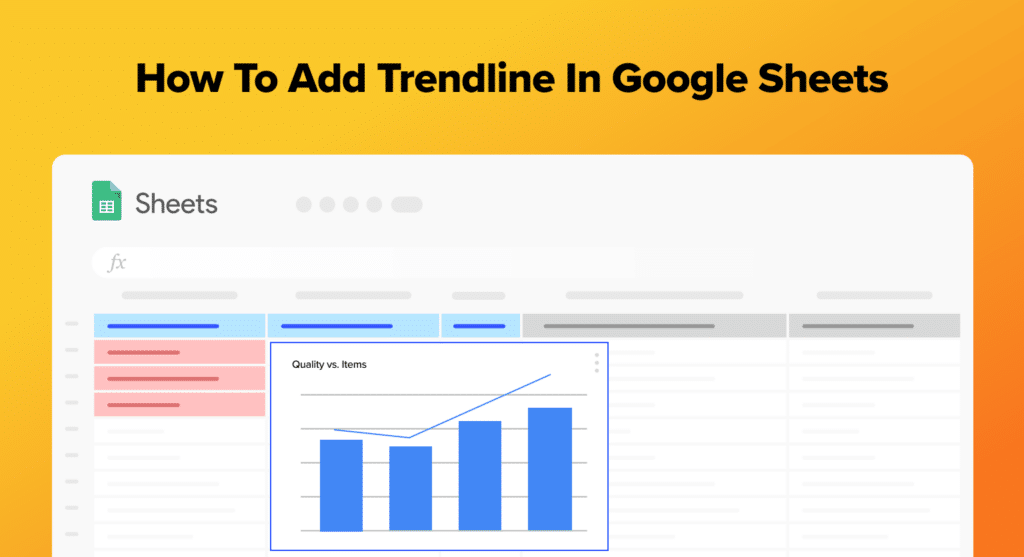
Trendlines in Google Sheets are essential for visualizing data trends, making predictions, and streamlining business operations. This guide will walk you through adding a trendline to your charts,...
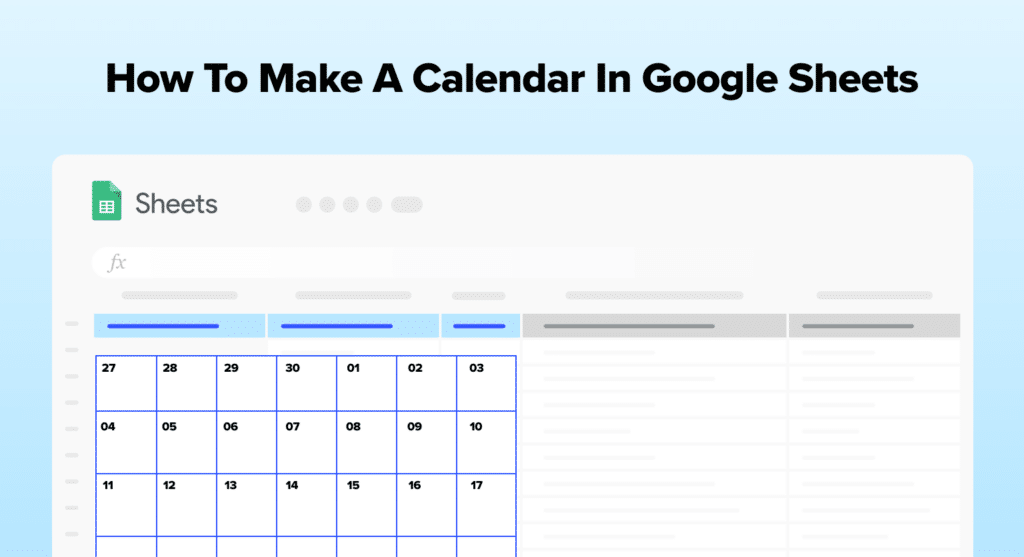
Google Sheets is a versatile and powerful tool that can be used for various purposes, including creating calendars. Making a calendar in Google Sheets allows users to organize...