Google Sheets offers a powerful feature for visualizing data over time with timeline charts. These charts help users understand trends, patterns, and make sense of data by presenting it in chronological order.
Timeline charts are useful in various fields such as project management, finance, and data analysis, where time is a significant variable.
Creating a timeline chart in Google Sheets is simple and requires minimal setup. This guide will walkthrough the process of creating creaking a timeline chart.
Understanding Timeline Charts
Features of Timeline Charts in Google Sheets
Timeline charts are a special type of line chart in Google Sheets designed for displaying data marked with date or time stamps. These charts provide an interactive way to visualize and track data over time, making them helpful for projects or events with specific deadlines.
Some key features are:
- Built-in zoom functions: This allows users to zoom in and out, enabling them to focus on specific days, weeks, or months for a more detailed view of the data.
- Customizability: Users can quickly customize timeline charts by adjusting their format, colors, and other options to better suit their preferences and the data being presented.
Importance of Timeline Charts
Timeline charts in Google Sheets play a vital role in various applications due to their ability to visualize and track complex data over time. They are especially essential in the following areas:
- Project management: Project managers often use timeline charts to monitor project tasks and deadlines, making it easier to identify bottlenecks and ensure timely completion.
- Financial analysis: Businesses and individuals can utilize timeline charts to monitor revenue, expenses, and sales patterns over time. Having a clear understanding of these trends enables informed financial decision-making.
- Inventory management: By using a timeline chart, companies can effectively keep track of their inventory levels, promptly identify low stock or excess supply, and make data-driven decisions to optimize their operations.
Step-by-Step Guide: Creating a Timeline Chart in Google Sheets
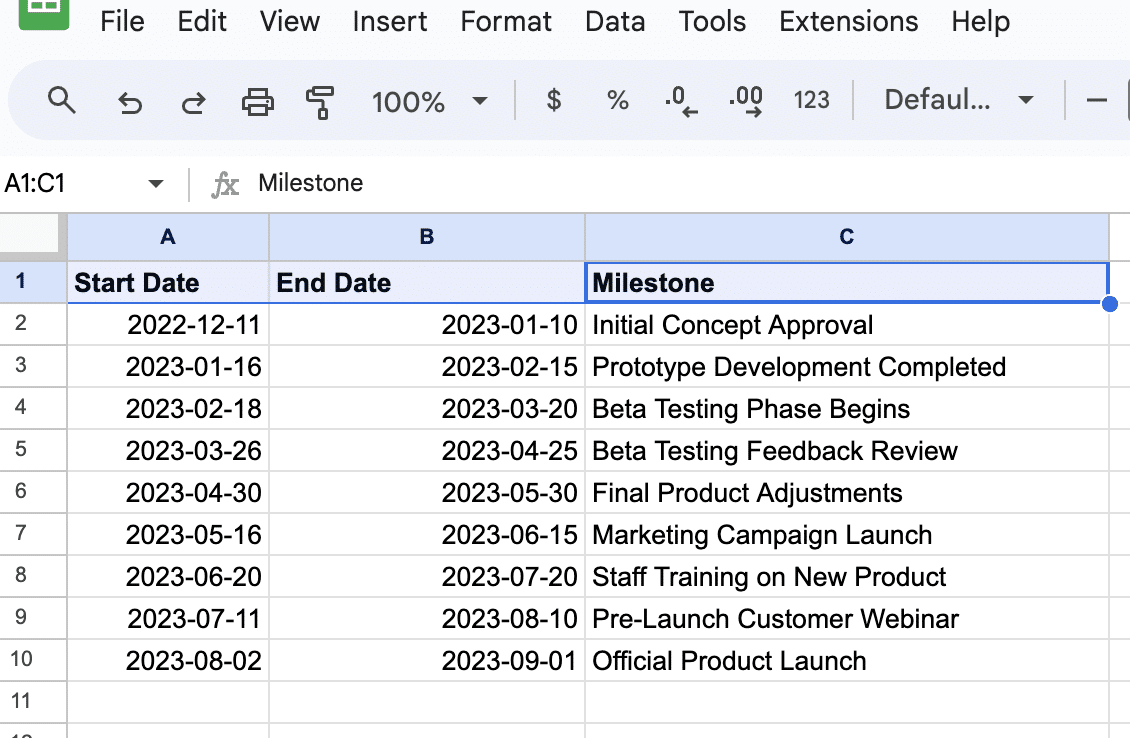
- Select the data: To create a timeline chart, first select the relevant data in Google Sheets. This data should include at least two columns, one for the dates and another for the corresponding events, tasks, or deadlines.
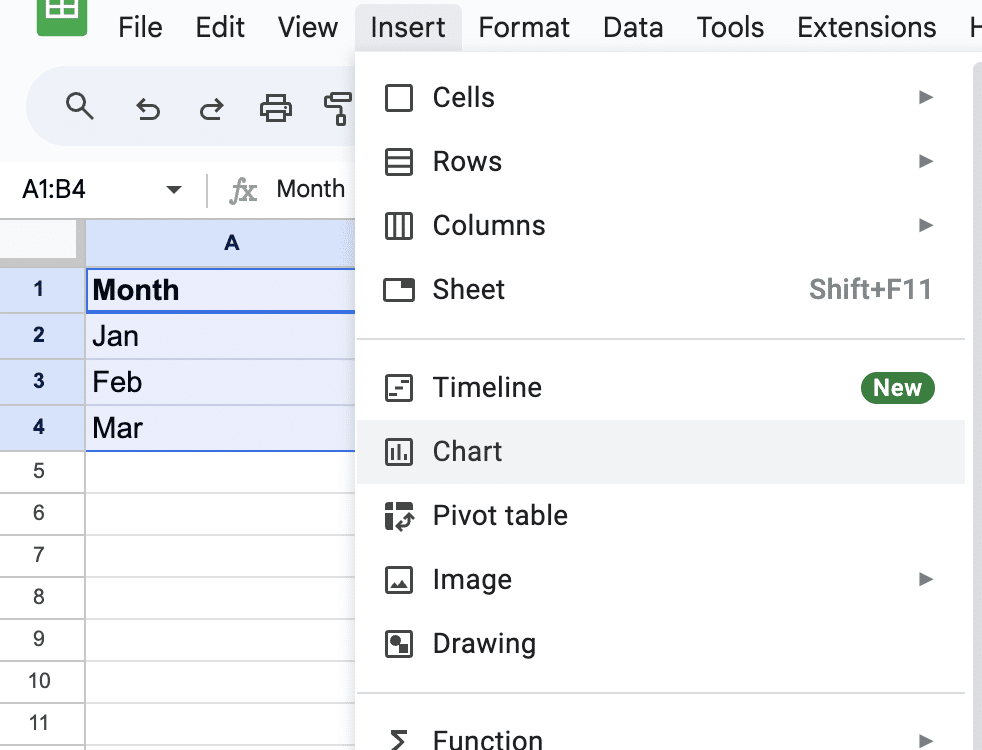
2. Insert a chart: Selecting the data, go to the Insert menu and choose the Timeline option.

Supercharge your spreadsheets with GPT-powered AI tools for building formulas, charts, pivots, SQL and more. Simple prompts for automatic generation.

3. Google Sheets will automatically create your timeline chart based on your data.
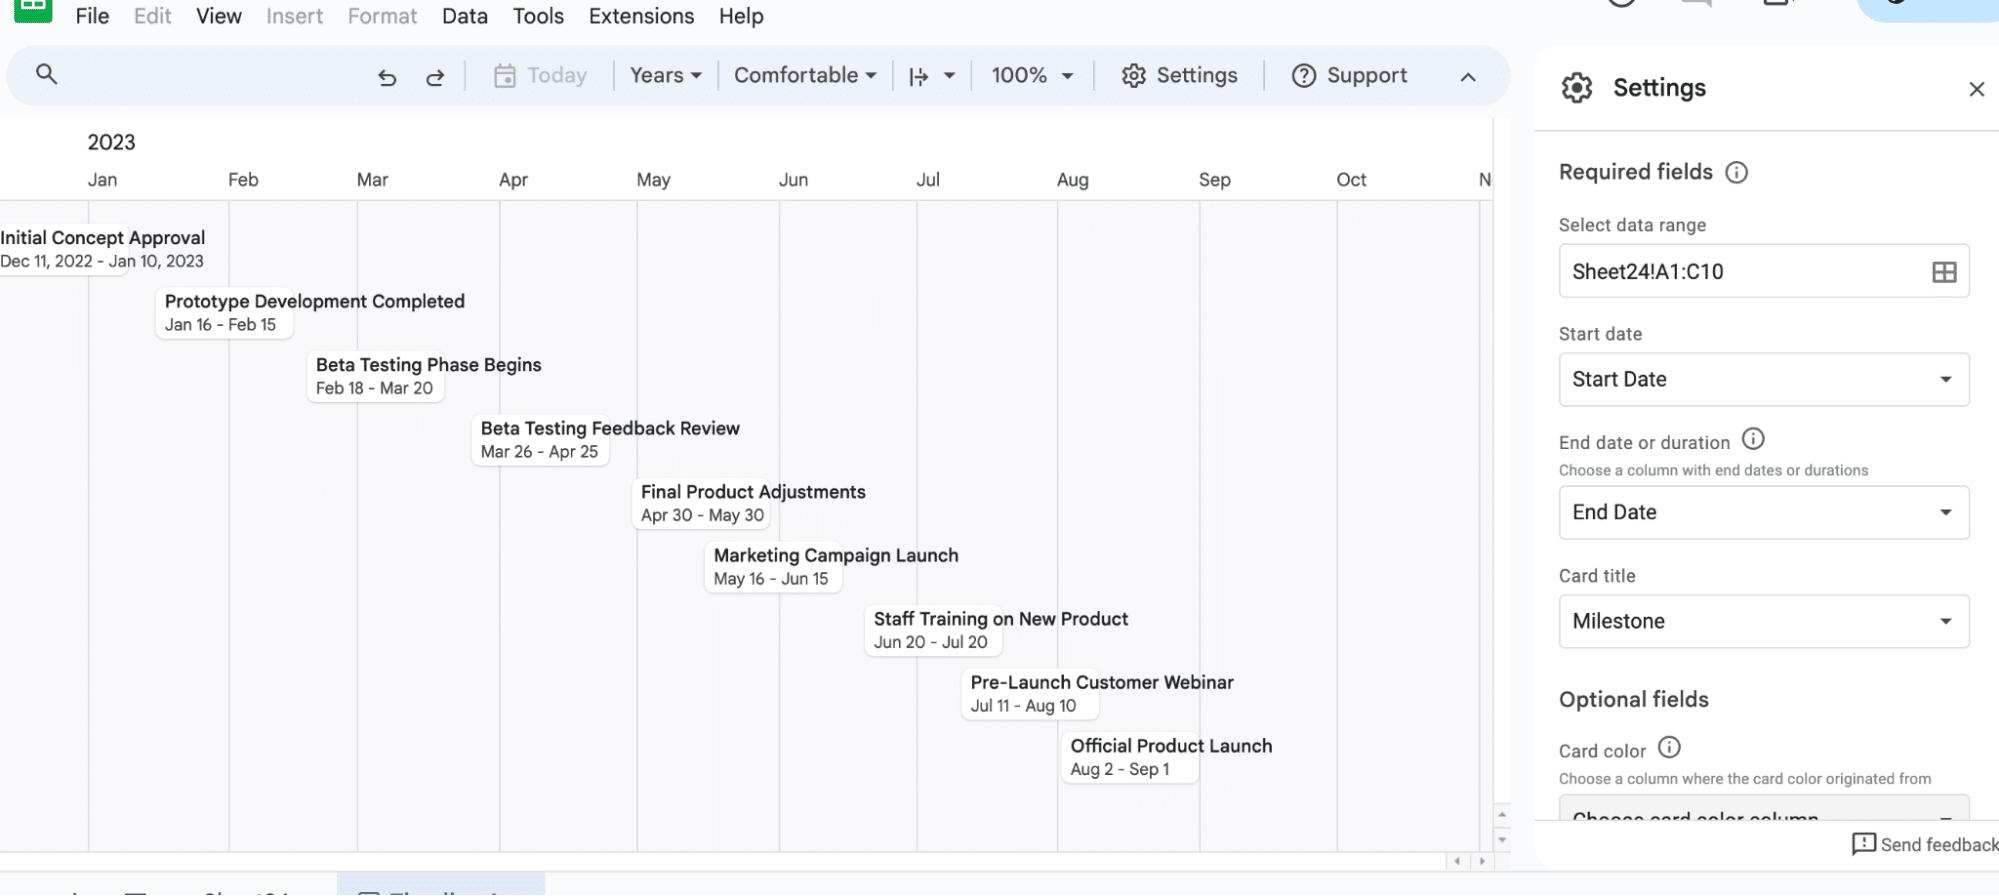
And that’s it. You’ve successfully created a timeline chart in Google Sheets!
Conclusion
Timeline charts in Google Sheets are a game-changer for visualizing project timelines in business operations. By following these steps, you can create a clear, impactful timeline chart for your project.
Elevate your business operations with streamlined data visualization by installing Coefficient today, and enjoy seamless integration of live data in your spreadsheets.


