


Table of Contents
![]()
-
1. Metric Inconsistency – Your Snowflake Data Is Clean. So Why Does Every Team Have a Different Number?
- Fixing Metric Inconsistency - The Problem Is Architectural, Not Organisational
- What Snowflake Semantic Views Actually Change
- The Last Mile Is Where Consistency Breaks Down
- Closing the Loop Between the Semantic Layer and the Spreadsheet with Coefficient
- The Principle That Actually Fixes This
- What to Do Next
- 2. How to Query Snowflake Data Without SQL (And Pull It Straight Into Your Spreadsheet)
- 3. How to Query Snowflake Semantic Views in Google Sheets Without SQL
- 4. How to Connect Snowflake to Google Sheets
- 5. How to Connect Excel and Snowflake?
- 6. How to Export Snowflake Data into Google Sheets
- 7. How to Upload CSV to Snowflake: Top 3 Methods
- 8. How to Upload Data to Snowflake
- 9. How to Download Data from Snowflake
- 10. How to Export Data from Snowflake to CSV

There is a meeting that happens at almost every company with a modern data stack. Someone from finance pulls a revenue number from their spreadsheet model. Someone from RevOps pulls the same number from Salesforce. The CEO asks why they are different. Everyone looks at the data team.
The data team opens Snowflake and shows that the source data is correct. Both numbers are technically defensible. They are calculated differently. Finance counts invoiced revenue on the date payment clears. RevOps counts closed-won opportunity value on the date the deal closes. Both definitions are reasonable. Neither team defined them intentionally. They emerged from the tools and metric defintion each team happened to apply.
This is not a data quality problem. The data is fine. This is a semantic problem. And most organisations are solving it in the wrong place.
| Metric inconsistency is not caused by bad data. It is caused by metric definitions living in the wrong layer of the stack. |
Fixing Metric Inconsistency – The Problem Is Architectural, Not Organisational
The instinctive response to the revenue meeting is to write a definition document. Finance and RevOps sit down with the data team, align on what Revenue means, and document it in a wiki. For about three months this works. Then someone builds a new Salesforce report without reading the wiki. Someone updates the Excel model. A new analyst joins and calculates it the way it was done at their last job. The documentation decays faster than the inconsistency.
The reason documentation fails is that it lives outside the systems that produce the numbers. Every BI tool, every spreadsheet, every Salesforce report, every Tableau dashboard contains an implicit definition of every metric it surfaces. Those definitions are baked into formulas, calculated fields and custom report logic which doesn’t depend on reading a Confluence page before running.
The only durable fix is to push the metric definition into the layer where the data lives. Not documented above the data. Not interpreted by each tool independently. Defined once, in the warehouse, where every downstream system is forced to read it from the same place.
What Snowflake Semantic Views Actually Change
Snowflake introduced Semantic Views to general availability at Summit 2025. The concept is simple and the implications are significant. A Semantic View is a schema-level object that defines business concepts and not just data shapes. It stores the definition of Revenue (sum of invoiced amounts where payment_status = ‘cleared’), the dimensions that modify it (Region, Product, Time Period), and the relationships between underlying tables. It lives natively in Snowflake, versioned alongside the data it describes.
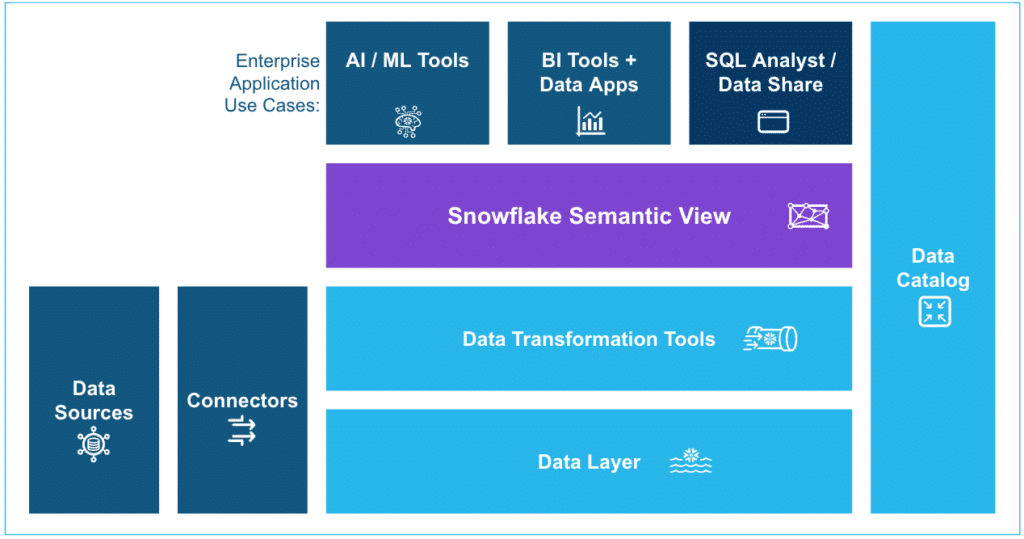
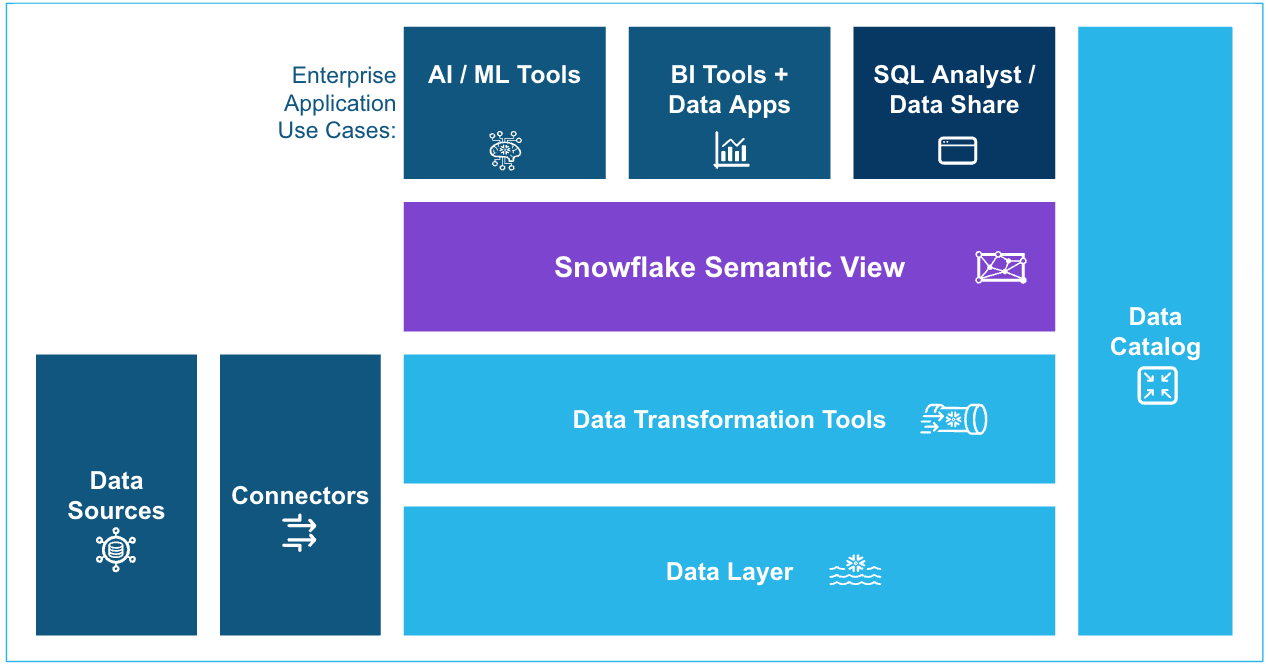
When an AI agent, a BI tool or a connector queries Snowflake through a Semantic View, it does not interpret the data. It reads a definition that the data team has already reviewed and approved. The metric is calculated the same way every time, regardless of which tool is asking for it.
This solves the first part of the problem. Revenue now has one definition and it lives in the right place. But there is a second part that most organisations underestimate.
| A semantic layer only creates consistency if every tool that surfaces data to end users actually reads from it. Most do not. |
The Last Mile Is Where Consistency Breaks Down
Data engineers build Semantic Views. They instrument Looker or Tableau to read from them. Governance is intact for the BI layer. Then the CFO asks for a custom quarterly model. The analyst pulls the data into Excel but not from the Semantic View, but from a saved Salesforce report they have been using for two years. The number is different again.
The spreadsheet is where the semantic layer most commonly breaks. Not because spreadsheets are bad tools but they are the most widely used analytical interface in the world precisely because they are flexible and familiar. They break the semantic layer because most methods of getting data into a spreadsheet bypass the governance layer entirely. CSV exports, manual copy-paste, direct API calls that hit raw tables skip the Semantic View and the definition it contains.
This is the last mile problem. You can build a perfect semantic layer in Snowflake and it will still produce inconsistent numbers everywhere the data has to leave Snowflake to reach the people who make decisions.
Closing the Loop Between the Semantic Layer and the Spreadsheet with Coefficient
The reason a Snowflake spreadsheet connector matters in this context is not automation. It is governance. When a finance team member pulls Snowflake data into Google Sheets or Excel through a connector like Coefficient, they are not bypassing the Semantic View. They are reading from it.
Coefficient surfaces Semantic Views through a visual Metrics and Dimensions picker. The finance manager selects Revenue, chooses Region and Quarter as dimensions, and clicks Import.
Coefficient pulls the data into Google Sheets against the Semantic View automatically. The number that lands in the spreadsheet is the same number the BI dashboard would show because it came from the same definition, through the same layer, against the same underlying data.
The spreadsheet becomes a governed surface rather than an escape hatch. The analyst does not need to know what a Semantic View is. They do not need to write SQL or understand the underlying table structure. They pick the metric they need and the governance follows automatically.
This matters because the alternative is requiring every business user to query Snowflake directly using SQL which is not realistic at scale.
Most of the people who need governed data are not data engineers. They are finance managers, RevOps analysts, operations leads. They will get their data somehow. The question is whether that path preserves or circumvents the governance layer.
| Governance is only as strong as its weakest downstream path. For most organisations, that path is the spreadsheet. |
The Principle That Actually Fixes This
Metric inconsistency is a systems design problem. The instinct to solve it with documentation, alignment meetings or stronger data governance processes treats the symptom rather than the cause. The cause is that metric definitions are defined in too many places by too many tools.
The fix is architectural: define metrics once, in the semantic layer of the warehouse and build every downstream data path to read from that definition rather than reinterpreting the raw data independently. That requires two things to be true simultaneously.
- First, the semantic layer has to exist and be well maintained.
- Second, the paths by which business users access data have to pass through it rather than around it.
Most data teams have made progress on the first. The second is harder because it requires changing how business users interact with data not just how the data engineering team structures the warehouse. Tools that sit at the intersection of the semantic layer and the end-user workflow are where the consistency problem actually gets solved.
The revenue meeting does not end when you build a Semantic View. It ends when the CFO’s Spreadsheet model and the RevOps Salesforce dashboard and the Looker report all show the same number.
What to Do Next
If your organisation is running into the revenue meeting regularly, three things are worth doing in order.
First, audit where your most contentious metrics are actually being calculated. It will not be in Snowflake. It will be in Salesforce calculated fields, spreadsheet formulas, Looker calculated dimensions. All of which have slightly different logic and no reason to stay in sync.
Second, identify which of those metrics your data team is willing to own a single definition for. Start with the two or three that cause the most organisational pain. Define them in a Snowflake Semantic View. Get the corresponding teams owning the metrics to review the definition before it ships.
Third, audit every downstream path through which business users access those metrics. For each path that bypasses the Semantic View via CSV exports, direct API calls, saved Salesforce reports — find a governed alternative.
Where spreadsheets are involved, a connector that reads from the Semantic View rather than from raw tables is the path of least resistance for the business user and the highest impact choice for the data team.
The goal is not perfect governance everywhere. It is eliminating the gap between the semantic layer you have invested in building and the data that actually lands in the tools where decisions get made. Coefficient’s Snowflake connector is one part of closing that gap. The architectural principle behind it matters regardless of which tools you use.
