In this guide, we’ll highlight several Tableau dashboard examples that will help you build superb data visualizations in the platform.
Tableau is one of the premier BI platforms for visualizing and analyzing data. Data and BI analysts leverage Tableau to produce incisive dashboards, powerful business intelligence, and actionable insights for data-driven teams.
Marketers, customer success managers, sales executives, and other stakeholders rely on BI products from Tableau every day to make critical decisions. This helps businesses operate with more efficiency and profitability.
Check out our five best-in-class Tableau dashboard examples below to draw inspiration for your own BI products.
1. Marketing KPI Dashboard
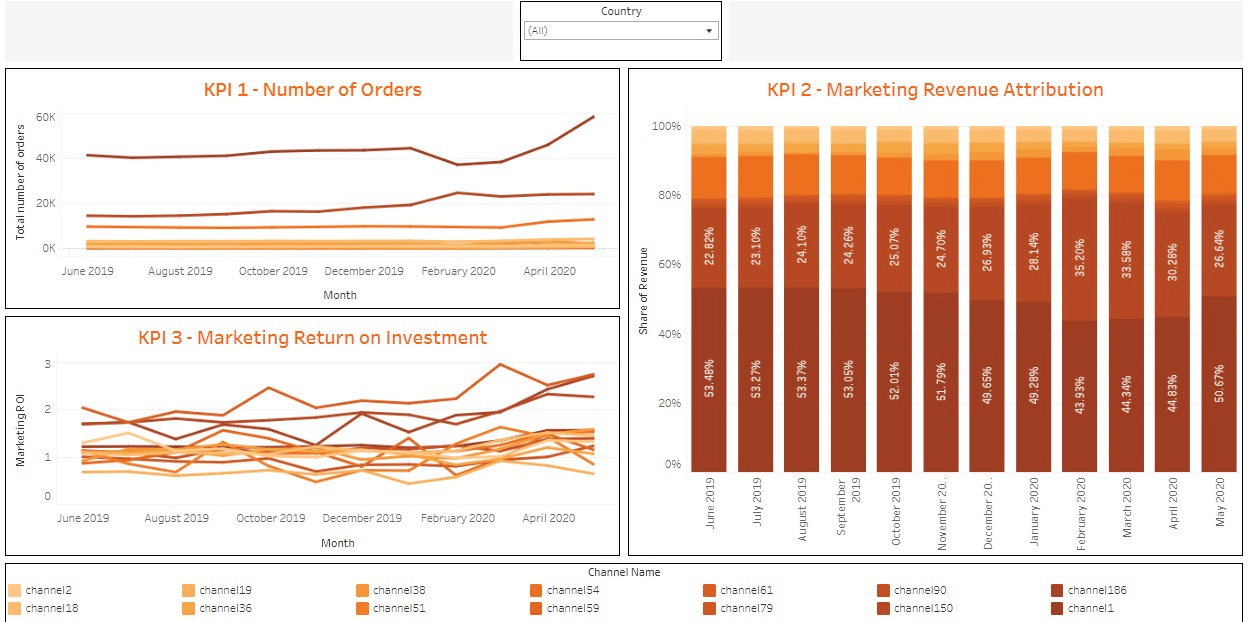
A marketing KPI dashboard in Tableau presents your marketing KPIs in a compelling, story-like way. It unifies all the different components of your marketing operations, from revenue opportunities, to spend, to projected growth, so you can make high-level strategic decisions about marketing strategy.
Take a look the example above, a classic marketing KPI dashboard in Tableau that showcases:
- The number of orders by month
- Marketing revenue attribution by month (spliced by channel)
- Marketing ROI by month
This dashboard works perfectly as a high-level view for an ecommerce company, but specific KPIs will vary by use case. We’ve seen companies use certain KPIs consistently on Tableau dashboards, such as marketing qualified leads (MQLs), customer lifetime value (CLV), and customer acquisition costs (CAC).
However, these KPIs often need more granular specificity, depending on a company’s priorities. These include breakdowns by channel, geo, price plan, account age, and a host of other dimensions.
Here are some other KPIs we’ve seen on Tableau marketing dashboards, based on companies we’ve worked with:
- Revenue per acquisition
- Cost per acquisition
- Marketing spend vs. budget
- Conversion rate (leads or acquisitions)
Once you define the right KPIs, Tableau will provide the flexibility needed to build a first-class marketing dashboard.
2. Sales Performance Dashboard
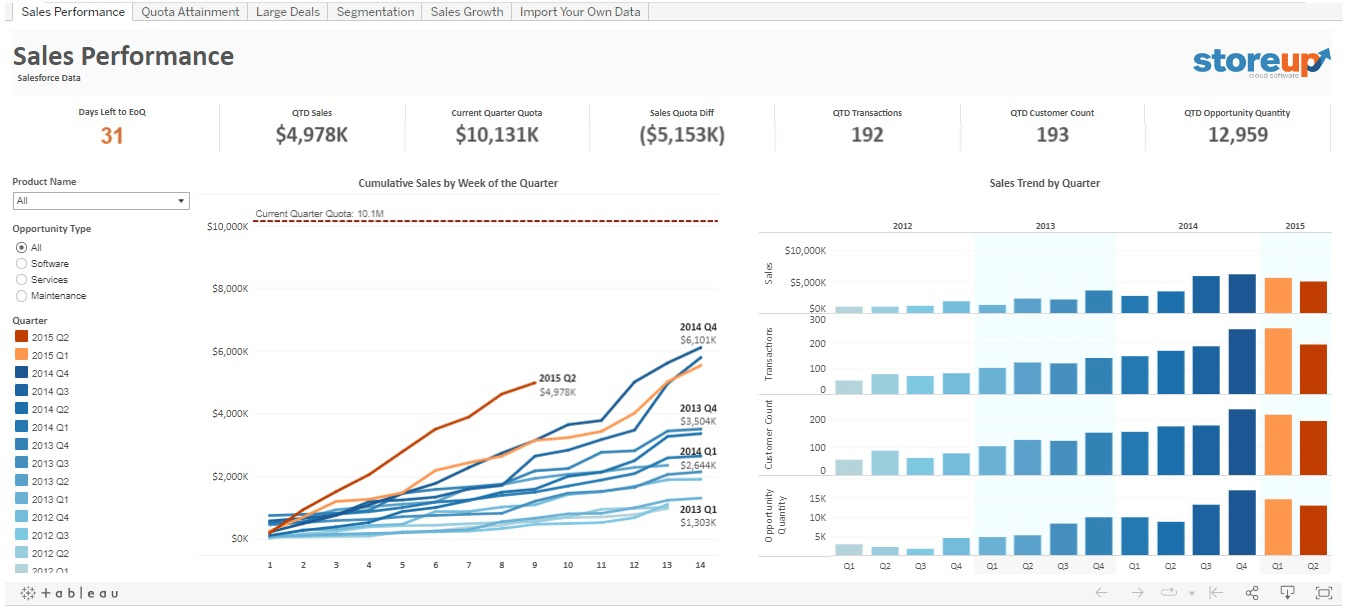
Many sales teams rely on year-over-year sales performance dashboards to analyze growth, adjust tactics, and plan future initiatives. This allows sales leaders to compare year-over-year sales performance by industry, region, and account.
The above example shows an incisive sales performance dashboard in Tableau. The dashboard features interconnected sales KPIs that offer valuable insights into the company’s Quarter-To-Date (QTD) sales performance.
The KPIs include:
- QTD sales
- Current quarter quota
- Sales quote diff
- QTD transactions
- QTD customer count
- QTD opportunity quantity
Depending on the data your team and senior sales leaders want to track and compare, you can add other KPIs, such as:
- Sales growth
- New customers
- Sales margin
- Sales margin growth
- Customer acquisition costs
- Customer lifetime value
However, some sales teams find Tableau products cumbersome and difficult to customize, and often turn to spreadsheet dashboards instead. That’s why we created our free, pre-built Sales Performance Dashboard in Google Sheets.
Now you can slice-and-dice performance data by sales team, deal type, and more, using a pre-built Google Sheets dashboard that automatically syncs with your Salesforce and HubSpot CRM data.
Our Sales Performance Dashboard offers all the sales performance metrics your team needs to measure yearly, monthly, weekly, and daily growth. Give it a try — it only takes one click to launch the dashboard.
3. Financial Performance Dashboard
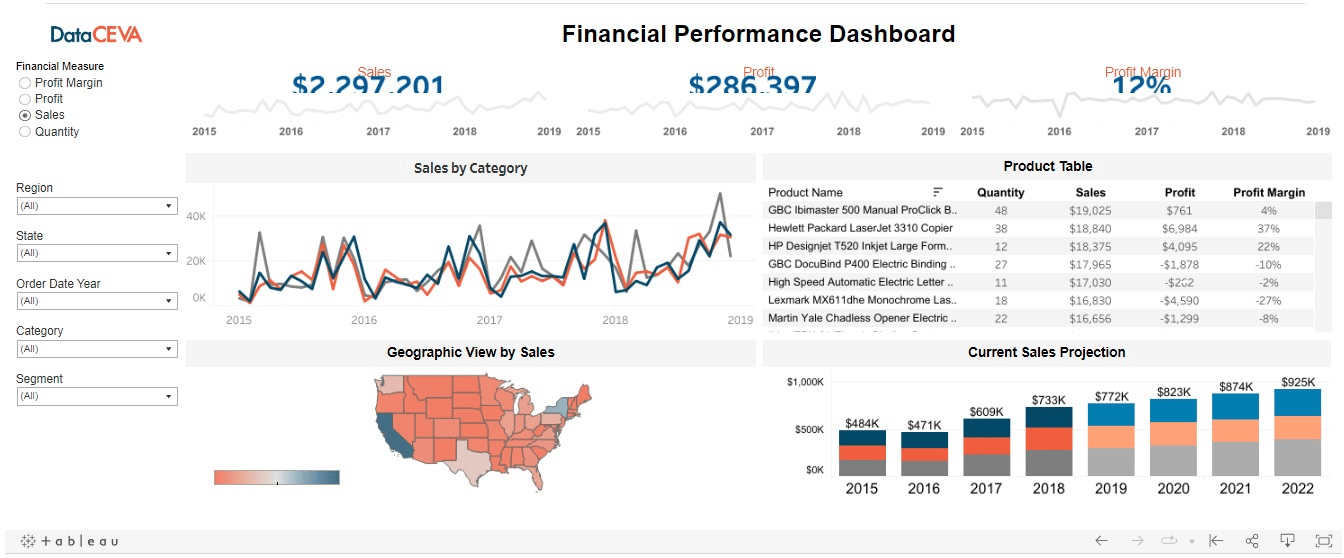
A financial performance dashboard in Tableau allows your business and finance departments to monitor, assess, and share your company’s financial performance. This dashboard often simplifies the tracking of sales expenses, profit margins, and other financial metrics at a higher level.
Check out the example financial performance dashboard above, built in Tableau. This “essentials” dashboard tracks and filters a company’s profit margin, sales, and revenue at a national scale.
You’ll also see a geographic view, a trendline for each metric, and the company’s current sales projection. This makes it easy to understand and gauge your company’s core financial performance.
We’ve also seen these financial KPIs on similar Tableau dashboards, especially ones that track returns on assets and equity:
- Return on equity
- Return on assets
- Debt-equity ratio
- Working capital ratio
Tableau provides companies of any size, from local businesses to global enterprises, with the platform they need to build powerful financial dashboards.
4. Customer Service Dashboard
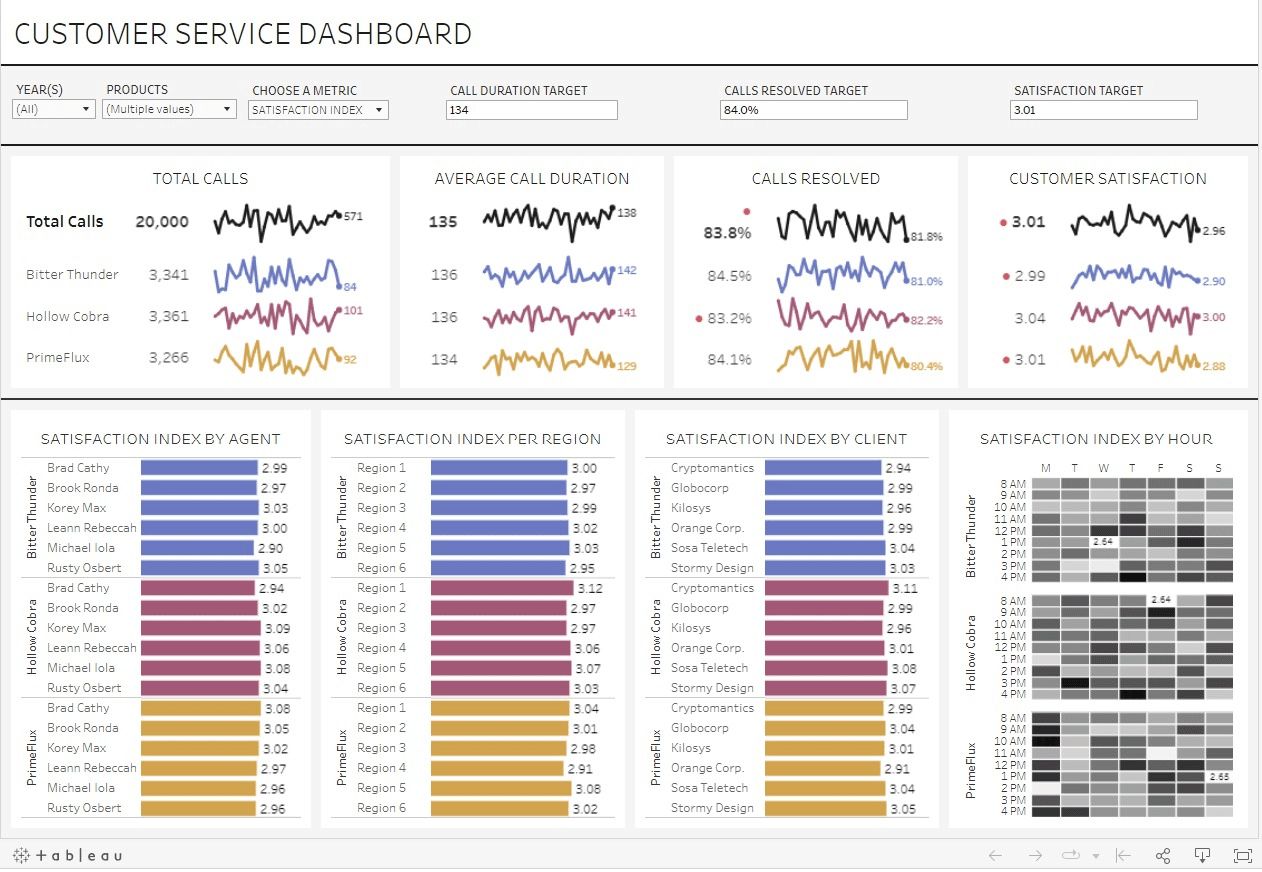
A customer service dashboard helps you respond to client satisfaction, department performance, ticket volume, and other customer-facing metrics.
The Tableau customer service dashboard above is an excellent example to model your own after. The dashboard features essential customer service KPIs, such as the average call duration, calls resolved, and customer scores.
The dashboard also includes satisfaction index breakdown by agent, region, client, and hour. Departmental targets are displayed as well, making it easy to track whether your customer service team is meeting them.

Stop exporting data manually. Sync data from your business systems into Google Sheets or Excel with Coefficient and set it on a refresh schedule.
Get Started
Other helpful KPIs we’ve seen in Tableau customer service dashboards include:
- First call resolution
- Average response time
- Unresolved calls
- Number of complaints
You can use your customer service dashboard to develop more efficient processes and workflows to deal with clients.
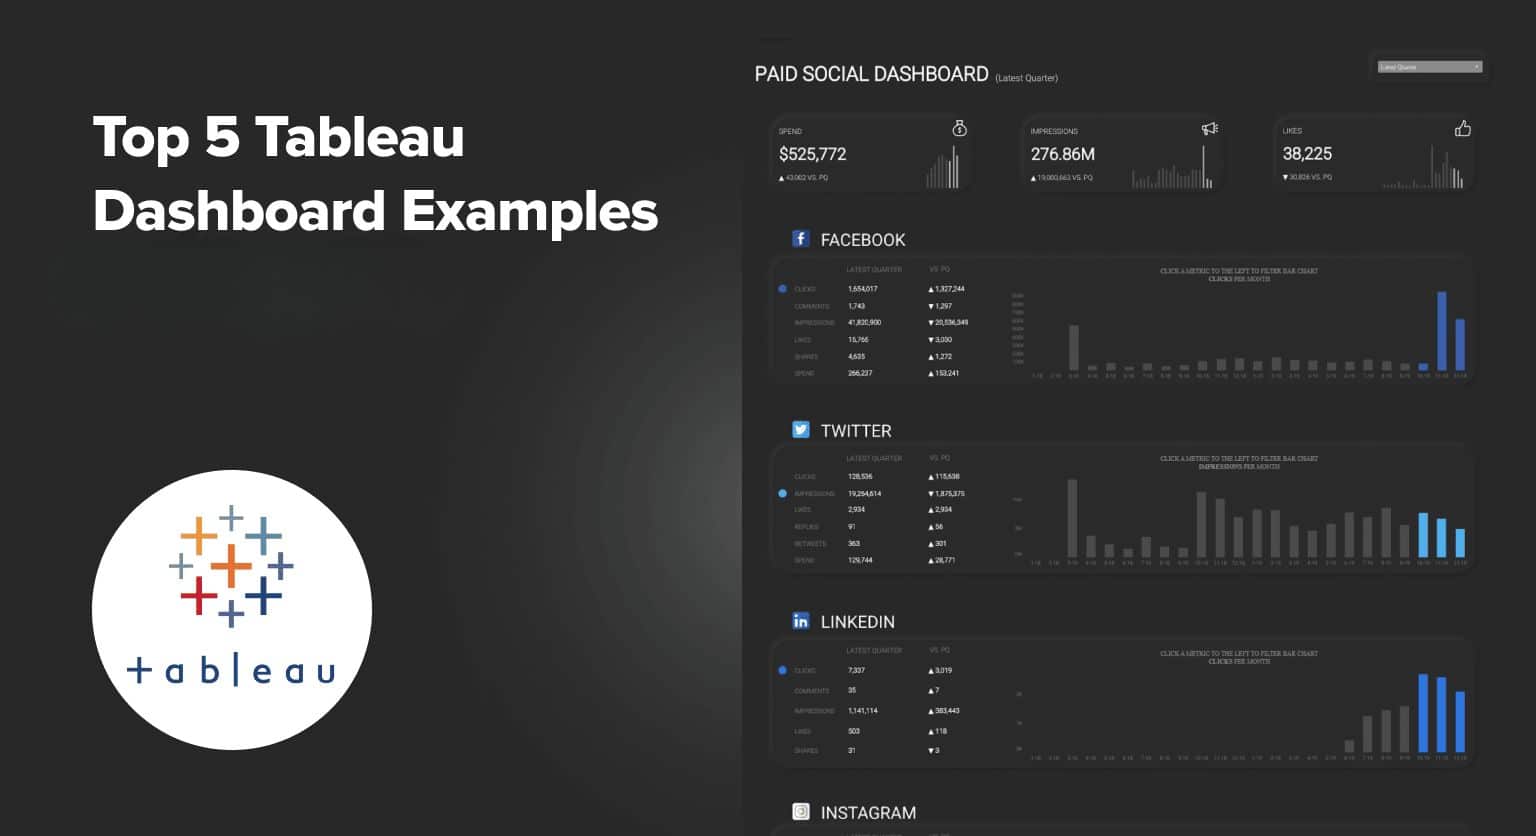
5. Social Media Marketing Dashboard
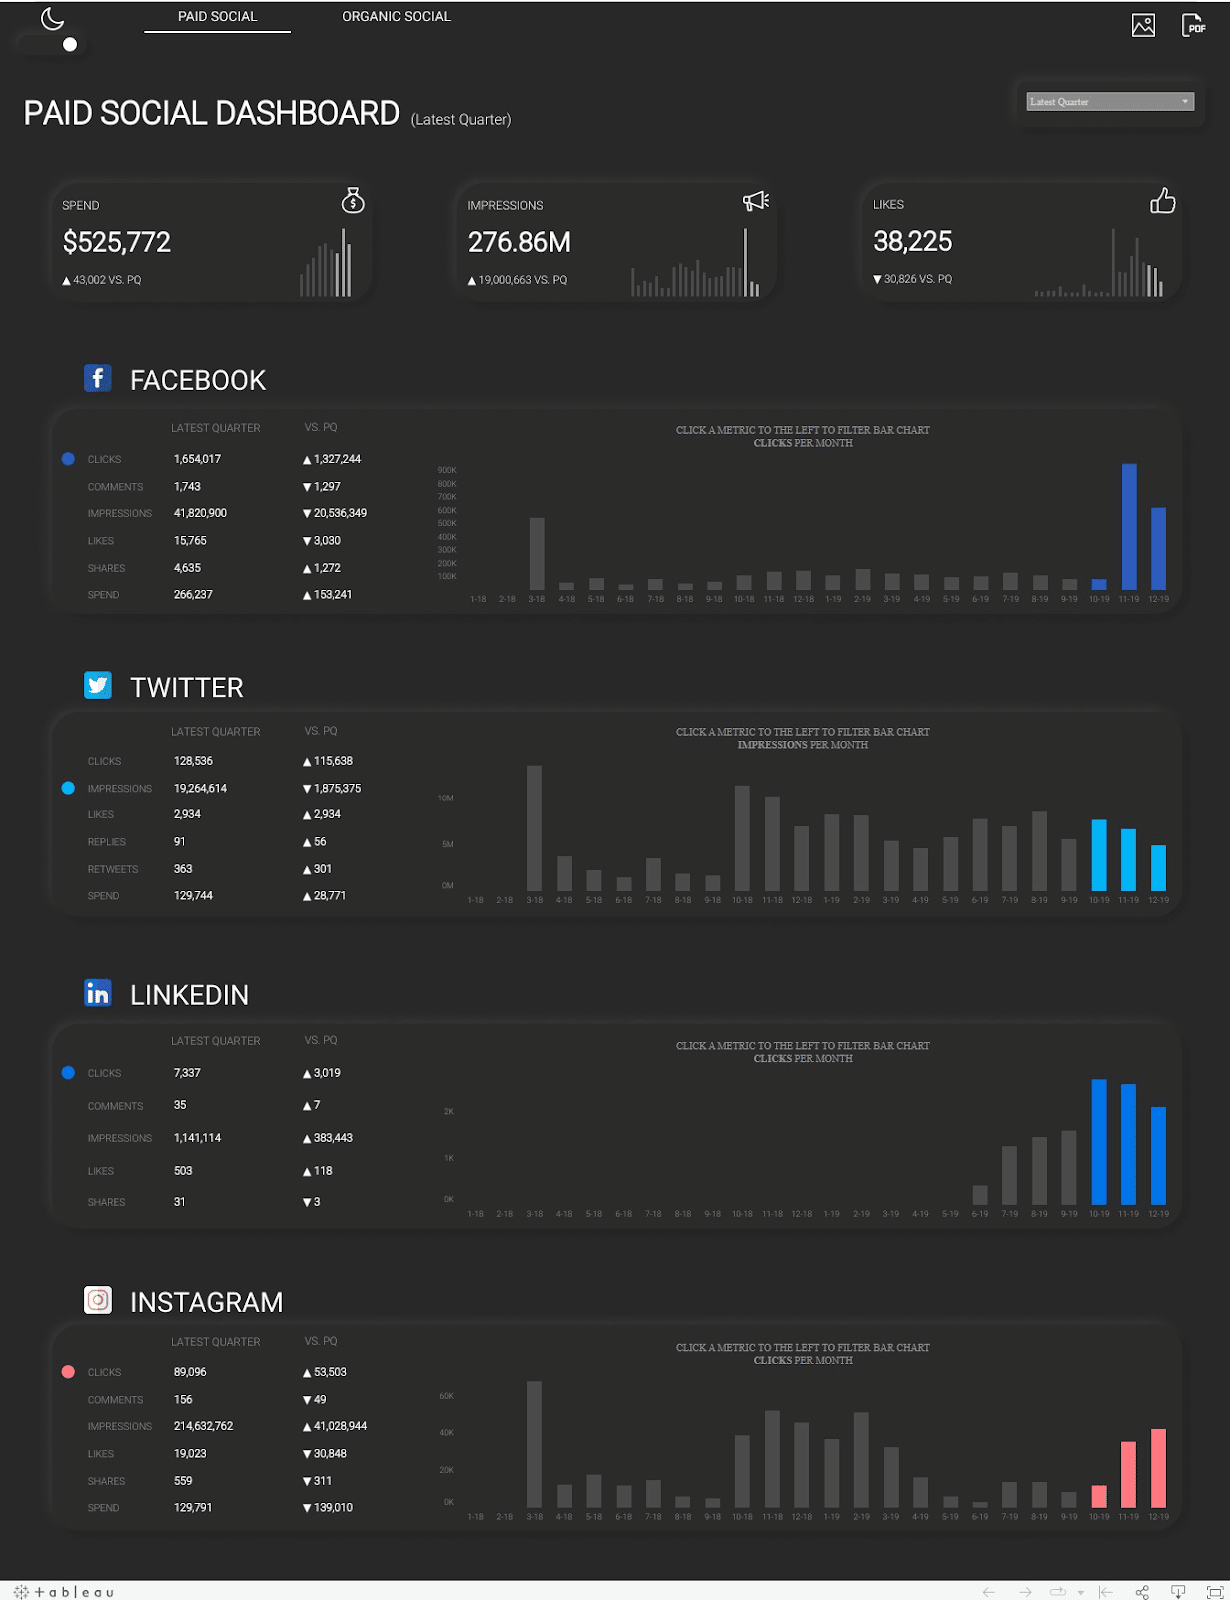
Most companies need a dashboard that offers a holistic view of their multi-platform social campaigns in a single unified view. This allows you to track the effectiveness of your social spend and outcomes.
Consider the example Tableau dashboard above. This social media marketing dashboard tracks a company’s paid and organic social initiatives.
The dashboard highlights metrics that most companies need to monitor across Facebook, Twitter, LinkedIn, Instagram, and other social channels, including:
- Total monthly and quarterly spending
- Impressions
- Likes
- Clicks
- Comments
- Shares
We’ve also seen some companies use a number of other KPIs on this dashboard, such as:
- Engagement rate
- Social sentiment
- Social interactions
- Followers growth
- Web visitors by channel source
- Social visitors conversion rate
- Traffic conversions
Regardless of the KPIs, Tableau allows teams to combine and visualize data from all your social platforms in a single, convenient dashboard.
Connect Tableau Dashboard Data to Google Sheets
Although Tableau dashboards offer visualized insights, many team members still need to make that data actionable, and prefer to do so in Google Sheets.
This allows them to not just view insights, but also to apply their own formulas and visualizations to Tableau data in Google spreadsheets, the analytical platform they feel most comfortable in.
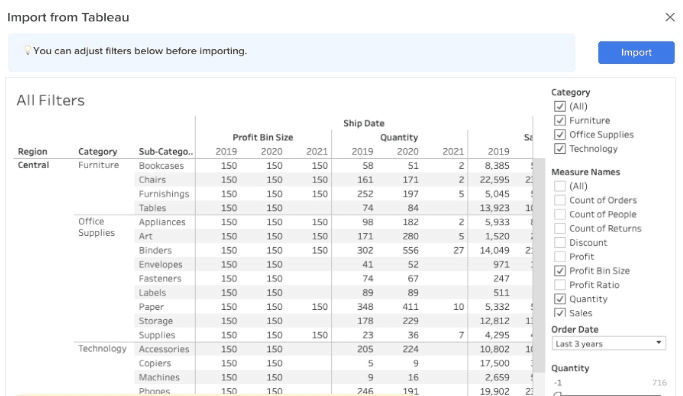
Coefficient connects Tableau to Google Sheets in a single click, allowing teams to access enriched BI data in their spreadsheets.
Pull your desired Tableau dataset, analyze your real-time BI data in Google Sheets, and generate tables and reports to create dashboards in Sheets. Filter your Tableau data before importing it into Google Sheets, so you can work with just the data you need.
Learn more about how to connect tableau to google sheets from this blog post.
Tableau: Limitless Dashboard Possibilities
These five example Tableau dashboards are perfect for popular use cases in marketing, sales, and other departments. But this collection just scratches how many business dashboards you can create in Tableau. Other use cases not covered in this article include:
- Human resources dashboard
- Workflow dashboard
- Descriptive dashboard for your CRM data
- Quarterly forecast dashboard
- Promotional optimization dashboard
- Prescriptive dashboard for data analytics
- Sales pipeline dashboard
- Tableau healthcare data dashboard
Tableau dashboards can help supercharge your business operations. But with tools like Coefficient, you can get even more mileage out of your Tableau data by actually activating the data in Google Sheets.
With the emergence of reverse ETL, BI dashboards are becoming a supplementary companion to actionable data. Coefficient allows you to activate Tableau data quickly and efficiently, so you can get the most out of it.


