


Table of Contents
![]()
- 1. Metric Inconsistency – Your Snowflake Data Is Clean. So Why Does Every Team Have a Different Number?
- 2. How to Query Snowflake Data Without SQL (And Pull It Straight Into Your Spreadsheet)
-
3. How to Query Snowflake Semantic Views in Google Sheets Without SQL
- The Governance Gap Nobody Talks About
- What Snowflake Semantic Views Are (And Why Spreadsheet Users Should Care)
- The Access Gap: Why Most Business Users Cannot Reach Semantic Views
- How Coefficient Surfaces Semantic Views Directly in Google Sheets
- Step by Step: Pulling Snowflake Semantic Views Into Google Sheets
- What This Looks Like for Real Teams
- What Coefficient Does Not Do
- Bring Snowflake Semantic Views Into the Tools Your Team Already Uses
- 4. How to Connect Snowflake to Google Sheets
- 5. How to Connect Excel and Snowflake?
- 6. How to Export Snowflake Data into Google Sheets
- 7. How to Upload CSV to Snowflake: Top 3 Methods
- 8. How to Upload Data to Snowflake
- 9. How to Download Data from Snowflake
- 10. How to Export Data from Snowflake to CSV

| Quick Answer You can query Snowflake Semantic Views in Google Sheets without writing SQL using Coefficient. Once connected, Semantic Views appear alongside regular tables in the import sidebar. A Metrics and Dimensions picker lets you select the governed KPIs your data team defined, such as ARR or net revenue retention, choose your dimensions, and Coefficient generates the correct SEMANTIC_VIEW() query automatically. The result lands in your sheet and auto-refreshes on schedule. |
The Governance Gap Nobody Talks About
Your data team spent real engineering time building Snowflake Semantic Views. They defined what Revenue means, what Churn means, how tables join, which metrics are canonical. The goal was one source of truth for every team and every tool. The problem is that most of the people who need those numbers, finance managers, RevOps leads, FP&A analysts, cannot reach them. They do not have Snowsight access. They cannot write the SEMANTIC_VIEW() syntax. So they fall back on CSV exports or saved reports that bypass the governed layer entirely. This article covers how to close that gap using Coefficient’s Snowflake connector, which is now GA, and get Semantic Views data directly into Google Sheets without a single line of SQL.
What Snowflake Semantic Views Are (And Why Spreadsheet Users Should Care)
Semantic Views are schema-level objects where data teams define business metrics, dimensions and entity relationships directly inside Snowflake. Instead of storing raw column names like amt_ttl_pre_dsc that mean nothing to a finance manager, a Semantic View exposes that same data as a clearly named, correctly aggregated metric called Net Revenue, defined once by the data team and inherited by every tool that queries it.
The business logic lives at the warehouse layer, not inside a BI tool dashboard or a spreadsheet formula. When a tool queries the Semantic View, it reads the definition the data team built, not a copy or reinterpretation of it. That is what makes them valuable.
For spreadsheet users specifically, this matters because the alternative is every analyst building their own version of Net Revenue in their own formula. Different filters, different aggregation logic, different answers. Semantic Views solve that by design. The question is whether the spreadsheet can actually read from them, which until recently required SQL knowledge most business users do not have.
Snowflake’s Semantic Views documentation covers the full object specification for teams building or maintaining them.
The Access Gap: Why Most Business Users Cannot Reach Semantic Views
Semantic Views are queryable in three ways natively: via the SEMANTIC_VIEW() SQL construct in Snowsight, through Cortex Analyst for natural language queries, and through BI tools like Sigma and Tableau that have native Semantic Views integration announced at Snowflake Summit 2025.
None of those surfaces work for a finance manager who lives in Google Sheets. SQL requires Snowsight access and query knowledge they do not have. Cortex Analyst stays inside Snowflake’s own interface. Sigma and Tableau are dashboard tools, powerful ones, but not the environment where a finance team maintains a rolling forecast model or an FP&A analyst runs budget versus actuals.
The result is a predictable workaround. The analyst asks the data team for a data pull, waits for a CSV, uploads it to their spreadsheet, and builds from a snapshot that is already out of date. The Semantic View gets bypassed at exactly the point where human decision-making happens. The governance investment stops working the moment data leaves Snowflake through an ungoverned path.
How Coefficient Surfaces Semantic Views Directly in Google Sheets
Coefficient’s Snowflake connector, now generally available, solves this by bringing Semantic Views into the Google Sheets import flow. When a user opens the Coefficient sidebar and connects to Snowflake, Semantic Views appear in the tables list alongside regular tables, marked with a distinct icon so they are easy to identify. No switching between tools. No new interface to learn. It is all inside the product the team already uses.
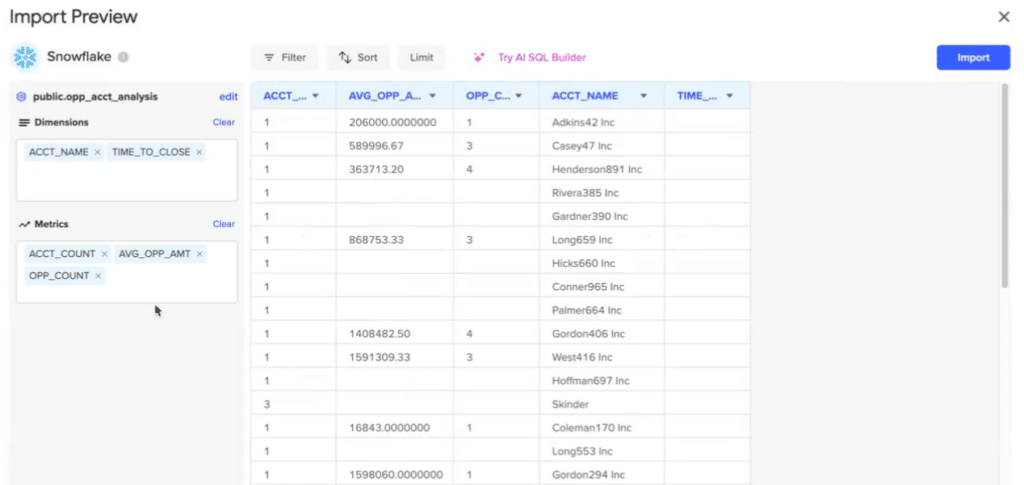
Clicking into a Semantic View opens the Metrics and Dimensions picker. This is a grouped checkbox interface where fields are labelled using the business-friendly names the data team defined, not the underlying column names. Field descriptions pulled from Snowflake metadata appear alongside each option, so a finance manager can see exactly what each metric means before selecting it.
The user selects the metrics they need, say total_revenue and net_revenue_retention, chooses dimensions like region and quarter, and clicks Import. Coefficient generates the correct SEMANTIC_VIEW() query automatically. The user never writes a line of SQL. The governance chain is preserved end to end.
Schema-level permissions carry through the connection. If a user does not have access to a particular Semantic View or metric in Snowflake, they will not see it in Coefficient either. The data team retains control even as access expands to 50 or 100 business users.
Step by Step: Pulling Snowflake Semantic Views Into Google Sheets
Here is the full flow from connection to live data in your sheet. Start with a free Coefficient account if you have not already.
Step 1: Install Coefficient in Google Sheets. Go to Extensions, then Add-ons, then Get add-ons and search for Coefficient. Install and launch from the Extensions menu.
Step 2: Connect your Snowflake account. In the Coefficient sidebar, select Import From and choose Snowflake. Enter your account name, database, username and password. OAuth authentication is also supported if your org uses SSO.
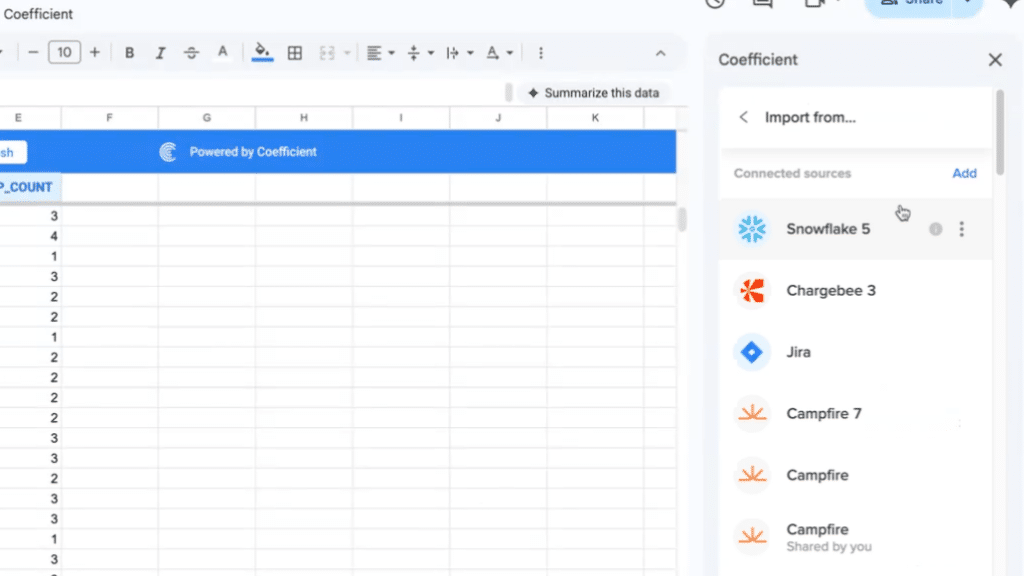
Step 3: Open the import flow and locate Semantic Views. In the tables list, Semantic Views appear alongside regular tables with a distinct icon. Browse or search for the Semantic View your data team has built for the domain you need, revenue metrics, pipeline data, customer health, and so on.
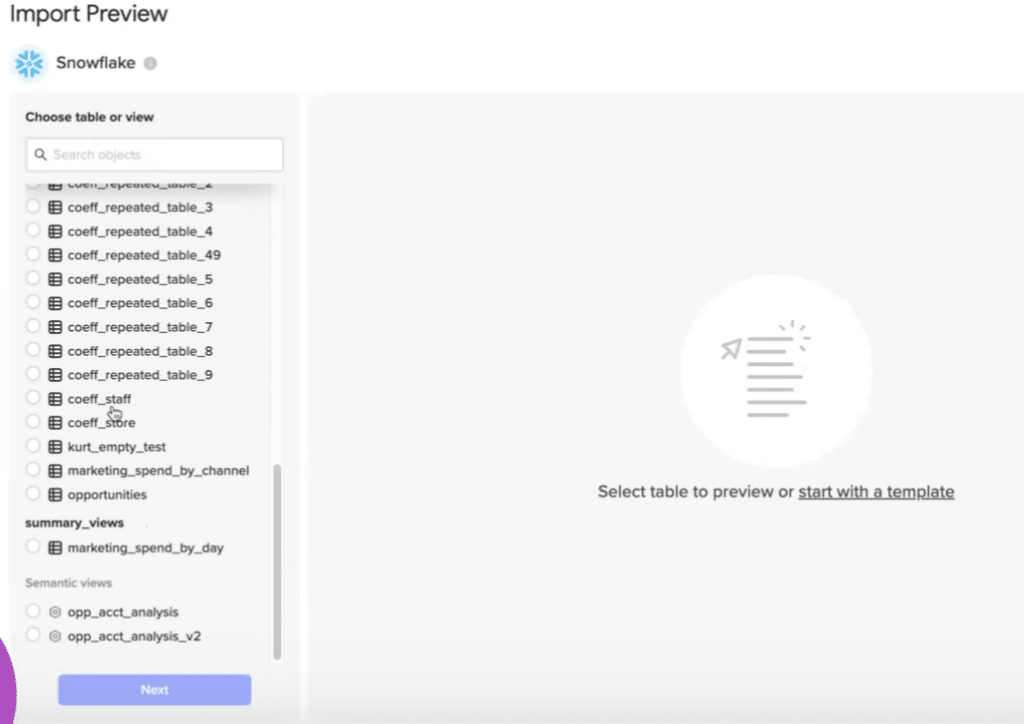
Step 4: Use the Metrics and Dimensions picker. Click into the Semantic View and you will see grouped checkboxes of available metrics and dimensions, labelled with the business-friendly names and descriptions your data team defined. Select the metrics you need and the dimensions you want to slice by.
Step 5: Click Import. Your Snowflake Semantic Views data lands in the sheet, queried correctly via the governed definitions your data team built.
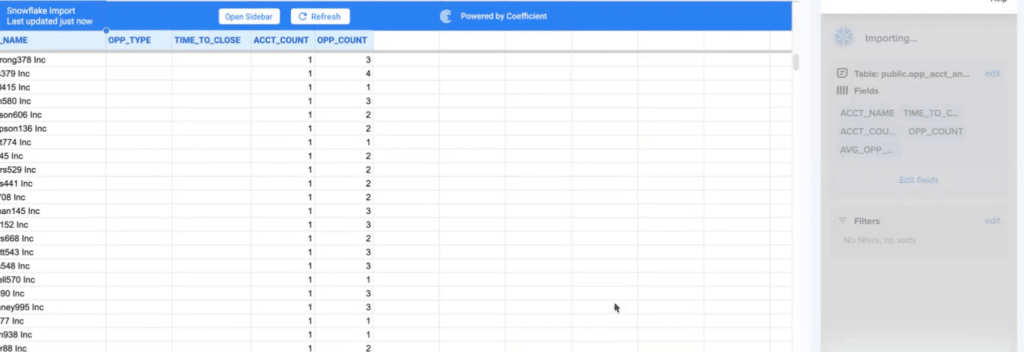
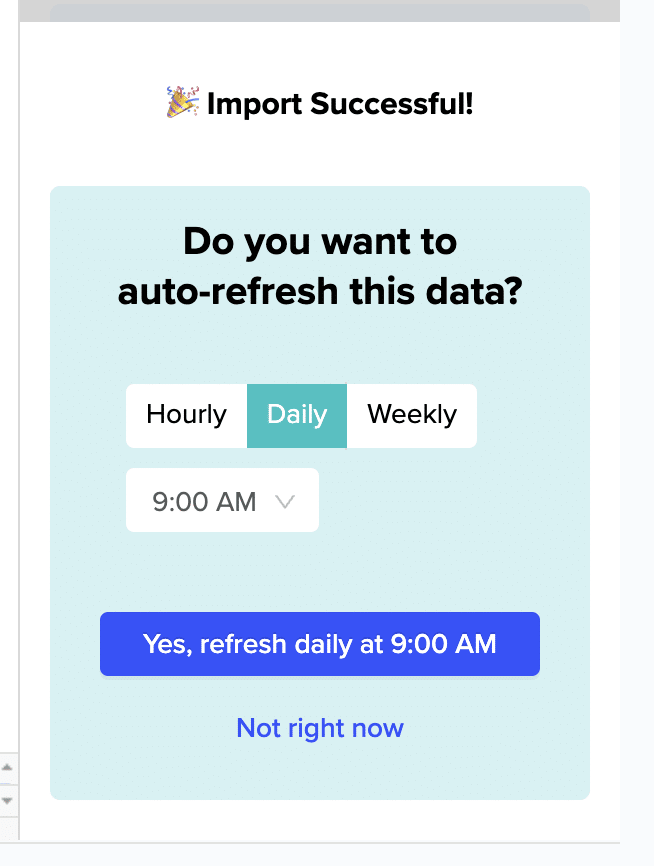
Step 6: Set your refresh schedule. In the sidebar, open Scheduled Run and choose how often you want the data to update: hourly, daily or weekly. From that point, the sheet stays current automatically.
Two Additional Capabilities Worth Knowing
- If your team needs to push data back to Snowflake from the spreadsheet, Coefficient’s two-way sync handles that. Update a value in the sheet and write it back to the source without leaving Google Sheets. The full data loop stays inside the governed pipeline.
- For imports that require custom logic beyond what the Metrics and Dimensions picker covers, the GPT SQL Builder lets you describe what you need in plain English and Coefficient generates the query. Custom SQL Query is also available for users who prefer to write their own.
Klaviyo extended their Snowflake investment to over 50 business users using Coefficient. Reports that previously took months of manual data operations were built in days. Governance was preserved throughout. Read the full story.
What This Looks Like for Real Teams
Finance Manager: Weekly Board Deck
A finance manager needs ARR by region and customer tier for a weekly leadership review. Instead of asking the data team for a pull, they open their Google Sheet, and the Coefficient import connected to the Semantic View has already refreshed with the latest numbers. The metric definition matches exactly what the data team defined in Snowflake. No reconciliation meeting. No version drift. The model is always current.
RevOps Lead: Pipeline Dashboard
A RevOps lead builds a pipeline dashboard using governed deal metrics and conversion rates from a Snowflake Semantic View. The dashboard auto-refreshes daily. When leadership asks why pipeline dropped week over week, the RevOps lead has the answer immediately, from the same governed data source the data team uses, not a saved Salesforce report with its own filter logic.
FP&A Analyst: Rolling Forecast Model
An FP&A analyst maintains a rolling 12-month forecast connected to live Snowflake metrics via Coefficient. When actuals update in Snowflake, the forecast model updates automatically. Scenario changes flow through formulas rather than requiring a new data pull. The analyst spends time on the analysis, not rebuilding the data layer every month.
What Coefficient Does Not Do
A few honest guardrails before you build your workflow around this.
Coefficient surfaces what your data team defined in Semantic Views. It does not create, maintain or update the definitions. If a metric is wrong in the Semantic View, it will be wrong in the sheet. The data team owns the semantic layer. Coefficient delivers it to the spreadsheet.
Writeback via two-way sync pushes cell values back to Snowflake. It does not log the analytical rationale or decision context behind a change. The value is keeping the data loop connected to the governed pipeline rather than breaking into an ungoverned spreadsheet silo.
Cortex Analyst natural language querying against Semantic Views is not part of this integration. If your use case requires asking questions in plain English directly against a Semantic View inside Snowflake, that stays within Snowflake’s own interface. Coefficient covers the structured import flow and the scheduled refresh layer.
Bring Snowflake Semantic Views Into the Tools Your Team Already Uses
Your data team built the governance layer so every team works from the same numbers. Coefficient makes sure the finance team’s Google Sheet is part of that system, not an exception to it. Semantic Views data, auto-refreshed, governed end to end, inside the spreadsheet where the work actually happens. Try Coefficient free and have your first Semantic View in Google Sheets in under five minutes.
