Business intelligence tools have split into two distinct categories in 2026. Enterprise platforms (Power BI, Tableau, Looker, Qlik) serve organisations with dedicated data teams, six-figure budgets and complex governance requirements. Modern lightweight tools (Metabase, Looker Studio, Zoho Analytics, Coefficient) serve the 80% of teams whose primary problem is not governance but access: getting live data into the hands of the people making decisions without filing a ticket.
This guide covers 10 tools across both categories, with current 2026 pricing, honest AI feature assessments and a buyer framework to match the right tool to the right organisation.
| Market context: According to Gartner’s 2026 Magic Quadrant for Analytics and BI Platforms, Microsoft Power BI holds approximately 20% market share, Tableau 16.4% and Qlik 10%. All three have been Gartner Leaders for 16 consecutive years. But market share does not equal best fit, especially as AI-first tools and spreadsheet-native solutions challenge the traditional BI model. |
What Is a Business Intelligence Tool?
A business intelligence tool is software that connects to data sources, transforms raw data into metrics and visualisations, and surfaces those insights to the people making decisions. At minimum, a BI platform provides three capabilities: data connectivity (connecting to warehouses, databases and SaaS systems), data modelling (defining what ‘revenue’ means and how metrics relate to each other), and visualisation (charts, dashboards and reports that users can filter and explore).
In 2026, a fourth capability has become table stakes: AI-assisted querying. Natural language interfaces, automated anomaly detection and AI-generated report narratives now appear in every major platform. The difference between tools is not whether they have AI, but how reliably their AI produces governed, consistent outputs.
BI Tools at a Glance
| Tool | Starting Price | Best For | AI Feature |
|---|---|---|---|
| Microsoft Power BI | $14/user/month (Pro) | Microsoft-stack organisations | Copilot ($30/user/month add-on) |
| Tableau | $75/user/month (Creator) | Visualisation-first, Salesforce CRM teams | Tableau Pulse (Tableau+) |
| Coefficient | Free. Paid From $49/month | Non-technical teams and heavy spreadsheet users | AI Sheets Assistant + Live AI Dashboards |
| Looker (enterprise) | ~$5,000/month platform + per-user | Google Cloud, LookML governance | Gemini NLQ, Semantic Views |
| Qlik Cloud Analytics | $825/month (Starter, 20 users) | Associative exploration, SAP/Oracle pipelines | Insight Advisor, AutoML (included) |
| ThoughtSpot | $25/user/month (Essentials) | Search-driven analytics for business users | Spotter AI (Pro: 25 queries/user/month) |
| Domo | Custom (contact sales) | Enterprise data integration at scale | Domo.AI natural language querying |
| Zoho Analytics | Free; from $30/month | SMBs, Zoho ecosystem users | Zia AI (all plans, no add-on cost) |
| Metabase | Free (open source); Cloud from $500/month | SQL-fluent teams, quick self-service setup | Limited; focused on SQL query simplicity |
| Looker Studio | Free (Pro $9/user/month) | Google ecosystem, free dashboards | Gemini AI (Looker Studio Pro) |
1. Microsoft Power BI
Best for: Microsoft-stack organisations that need enterprise BI at the lowest per-user cost in the market.
Power BI is now the visualisation and reporting layer of Microsoft Fabric, Microsoft’s unified data platform. At $14/user/month Pro, it is the most cost-effective enterprise BI platform. Microsoft Copilot ($30/user/month add-on, included in Fabric capacity) generates complete report pages from plain-English prompts, writes DAX formulas automatically and summarises KPI changes with narrative insights. Power BI’s 500+ connector library and native Azure, Excel, Teams and SharePoint integration make it the default choice for organisations already on Microsoft 365.
Key limitation: DAX formula language has a meaningful learning curve for complex custom metrics. Copilot requires an additional licence. Every report viewer needs a paid licence.
Pricing: Free Desktop; Pro at $14/user/month; Premium Per User at $24/user/month; Copilot add-on $30/user/month. Full pricing at microsoft.com.
2. Tableau
Best for: Enterprise teams where visualisation quality is the primary requirement and Salesforce CRM is the primary data source.
Tableau’s chart library and VizQL engine remain the benchmark for interactive data visualisation. The 2025 addition of Tableau Pulse (available in Tableau+) is the most significant product development: rather than checking dashboards, users receive personalised metric summaries via Slack, email or Salesforce when something changes. This proactive monitoring model is unique in the enterprise BI category. Native Salesforce integration makes Tableau the natural choice for Salesforce-centric revenue teams.
Key limitation: $75/user/month Creator is among the most expensive per-user BI licences. Tableau Pulse requires the Tableau+ cloud tier. No live connection to Google Sheets or Excel. Only static CSV exports.
Pricing: Creator at $75/user/month; Explorer at $42/user/month; Viewer at $15/user/month (all annual).
3. Coefficient
Best for: Finance, RevOps and ops teams whose analytical work lives in Google Sheets or Excel and who need live source system data without learning a new BI tool.
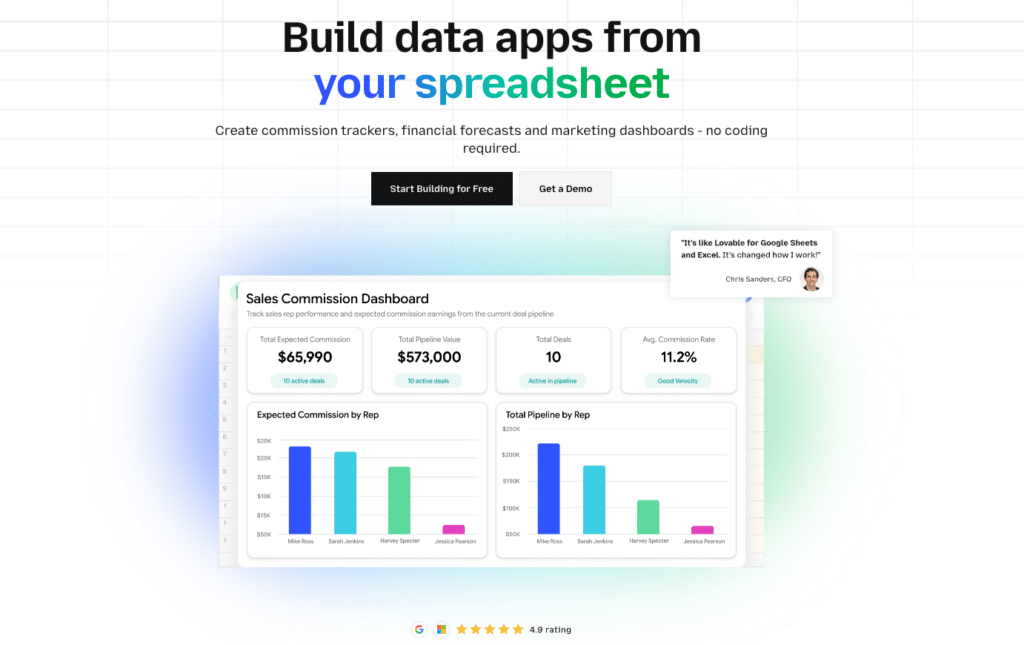
Coefficient connects Google Sheets and Excel directly to 100+ source systems, including Salesforce, HubSpot, NetSuite, Snowflake, QuickBooks, Xero and more, with scheduled auto-refresh and two-way sync. AI Dashboards (early access April 2026) generates live, shareable web dashboards from spreadsheet data via a plain-English description. The AI Sheets Assistant builds formulas, charts and pivot tables from natural language. Coefficient is not a replacement for enterprise BI. It is the right tool when the requirement is live data in spreadsheets, not a separate BI platform.
Key limitation: Not a standalone BI platform. Requires Google Sheets or Excel as the working environment. Less suited to complex cross-departmental analytics or warehouse-level governance than enterprise BI.
Pricing: Free plan available. Paid from $49/month. No per-user fees. See coefficient.io/pricing.
| “Coefficient automated everything. Instead of manually exporting data every day, I just sit back and watch the data update automatically.” Christian Budnik, FP&A Analyst, Solv |
4. Looker (Enterprise)
Best for: Google Cloud-native organisations that need LookML metric governance and embedded analytics in customer-facing products.
Looker is Google Cloud’s enterprise BI platform. Its LookML semantic layer defines metrics once in code (Revenue, ARR, Churn Rate) and surfaces them consistently across every downstream tool that queries them. Looker Semantic Views, announced at Google Cloud Summit 2025, extend this governance further. Gemini AI integration enables natural language querying against the governed semantic model. For SaaS companies embedding analytics in customer-facing products, Looker’s API-first embedded edition is the strongest option in the market.
Key limitation: Platform fee starts at approximately $5,000/month before per-user licences. LookML requires data engineering expertise. Total cost of ownership is the highest of any tool in this list for most deployments.
Pricing: Contact sales. Platform from ~$5,000/month plus Viewer ~$30, Standard ~$60, Developer ~$125 per user/month.
5. Qlik Cloud Analytics
Best for: Organisations with complex, heterogeneous data sources that need unscripted cross-dimensional exploration, or SAP/Oracle pipeline integration.
Qlik’s associative engine remains its defining differentiator. Unlike query-based tools, Qlik indexes all possible data relationships in memory. Click any value in any visualisation and the entire dataset recalculates instantly, showing what is related (green), excluded (grey) and unrelated (white). This enables exploration patterns that predefined drill paths cannot replicate. Qlik Talend Cloud (from the 2023 Talend acquisition) adds full ETL and data integration to the analytics platform. AutoML for predictive modelling is included in Premium and Enterprise plans, not an add-on.
Key limitation: QlikScript and the associative model require dedicated training. Qlik talent is scarcer than Power BI or Tableau expertise. Minimum Starter plan is $825/month (20 users).
Pricing: Starter $825/month; Standard $2,500/month; Premium from $5,000/month (all annual, 20 users included).
6. ThoughtSpot
Best for: Organisations where the core problem is that business users cannot get answers from data without depending on a data team.
ThoughtSpot’s search-first model and Spotter AI allow business users to type questions in plain English (‘Show me revenue by product line for Q1 2026 vs Q1 2025’) and receive instant visualisations queried live against Snowflake, BigQuery, Databricks or Redshift. No predefined dashboard required. SpotIQ automatically surfaces anomalies. The trade-off is Spotter AI’s query cap on the Pro plan (25 queries/user/month). High-usage teams need Enterprise.
Key limitation: Pro plan’s 25-query-per-user monthly Spotter cap is a material constraint for power users. Neither the cheapest nor the most feature-rich BI platform per dollar. Weaker data modelling depth than Looker.
Pricing: Free (1M rows, 5 users); Essentials $25/user/month; Pro $50/user/month; Enterprise custom. See thoughtspot.com/pricing.
7. Domo
Best for: Large enterprises that want one platform covering data integration, dashboards, collaboration and mobile analytics.
Domo is a cloud-native, mobile-first platform with 1,000+ pre-built data connectors and Magic ETL for no-code data transformation. Domo.AI adds natural language querying that makes the platform more accessible for non-technical users. Buzz (built-in social collaboration), App Studio (no-code application builder) and the Domo Appstore distinguish it from pure BI tools. For organisations that want one vendor for the full data-to-dashboard workflow, Domo is one of the most complete options.
Key limitation: Custom pricing with no published rates makes it difficult to budget without engaging sales. Generally the most expensive platform in this list for comparable deployments. Minimum user requirements can be prohibitive for smaller teams.

Stop exporting data manually. Sync data from your business systems into Google Sheets or Excel with Coefficient and set it on a refresh schedule.
Get Started
Pricing: Custom. Contact sales at domo.com. User reviews suggest $83/user/month as a common reference point.
8. Zoho Analytics
Best for: Small to mid-market teams in the Zoho ecosystem, or any team needing affordable published-pricing BI.
Zoho Analytics is one of the few BI tools with fully transparent published pricing across all tiers. Zia AI provides natural language querying on all plans at no extra cost, unlike Copilot ($30 add-on) or Spotter Pro (capped queries). For organisations using Zoho CRM, Zoho Books or Zoho Desk, the native integrations are the most frictionless path to connected dashboards. See zoho.com/analytics/pricing for current tiers.
Key limitation: Visualisation depth and chart customisation fall short of Tableau or Power BI. Performance slows above 10 million rows. Non-Zoho integrations require more technical effort than native Zoho connections.
Pricing: Free (2 users, 10K rows); Basic $30/month; Standard $60/month; Premium $145/month; Enterprise $575/month (all annual).
9. Metabase
Best for: Technical teams that need fast, lightweight self-service analytics without enterprise BI complexity or cost.
Metabase is open source, self-hostable and free for teams with the infrastructure to run it. Its question-builder interface lets SQL-fluent users explore data without writing queries. The Cloud version starts at $500/month (5 users) with managed hosting. For data teams evaluating BI tools on a tight budget, Metabase provides a useful baseline: fast setup, readable interface, and direct SQL access for power users. It lacks the governance depth of Looker or the visualisation polish of Tableau, but for internal data exploration it punches above its price.
Key limitation: No semantic layer for metric governance. Limited visualisation customisation. AI capabilities are minimal compared to enterprise platforms. Enterprise features require the Pro or Enterprise cloud plans.
Pricing: Open source free (self-hosted); Cloud Starter $500/month (5 users); Pro $1,000/month (10 users); Enterprise custom.
10. Looker Studio
Best for: Google ecosystem teams that need free, shareable dashboards built on Google Analytics, Ads or BigQuery data.
Looker Studio (formerly Google Data Studio) is free for the standard product and covers the majority of Google ecosystem reporting needs without a paid licence. It is not the same product as enterprise Looker. Looker Studio Pro at $9/user/month adds enterprise governance, workspace management and scheduled reports. No native connector for Salesforce, HubSpot or NetSuite. These require a paid third-party connector or a Google Sheets intermediary.
Key limitation: Slow load times on complex or multi-source dashboards are consistently flagged by users. No native non-Google connectors without additional cost. Limited semantic layer for metric consistency.
Pricing: Free (standard); Pro at $9/user/month (annual).
How to Choose the Right BI Tool
| Your situation | Recommended tool |
|---|---|
| You run on Microsoft 365 and Azure | Power BI. Native ecosystem, lowest per-user cost, Copilot AI included in Fabric. |
| You run on Google Cloud and BigQuery | Looker (enterprise). Native integration, LookML governance, Gemini NLQ. |
| Your team works in Google Sheets or Excel and needs live data | Coefficient. Live source system data in spreadsheets, AI Web Dashboards with live data. |
| Visualisation quality is your primary requirement | Tableau. The benchmark for interactive data visualisation and Salesforce integration. |
| Business users cannot self-serve answers without SQL | ThoughtSpot. Spotter AI and search-first interface are built for this problem. |
| You have complex, heterogeneous data sources (SAP, Oracle) | Qlik. The associative engine and Qlik Talend Cloud handle this better than alternatives. |
| You need the full stack: ETL, analytics, mobile, collaboration | Domo. Most complete single-vendor platform, but also the most expensive. |
| Budget is a constraint and you use Zoho CRM/Books | Zoho Analytics. Published pricing, Zia AI included, native Zoho integrations. |
| You want free, fast BI for internal technical teams | Metabase. Open source, lightweight, SQL-accessible. |
| You need free dashboards on Google Analytics/Ads data | Looker Studio. Free, native Google connectors, shareable links. |
Frequently Asked Questions
What is the most popular BI tool in 2026?
Microsoft Power BI holds the largest market share at approximately 20%, followed by Tableau at 16.4% and Qlik at 10%, according to Gartner’s 2026 Magic Quadrant for Analytics and BI Platforms. All three have held Gartner Leader status for 16 consecutive years. Market share reflects adoption, not necessarily the best fit for your organisation.
What is the difference between a BI tool and a data visualisation tool?
A data visualisation tool (Looker Studio, Datawrapper) focuses primarily on creating charts and dashboards from data you supply. A full BI platform includes data connectivity (pulling from multiple sources), data modelling (defining what metrics mean and how they relate), and visualisation. Enterprise BI tools like Power BI, Tableau and Looker cover the full stack. Simpler tools cover visualisation only.
Are there free BI tools?
Yes. Looker Studio is free for standard use. Metabase is free and open source (self-hosted). Power BI Desktop is free for report creation but requires a $14/user/month Pro licence to share. Zoho Analytics has a permanent free plan for 2 users and 10,000 rows. Coefficient has a free plan for getting started with live spreadsheet data.
What BI tools have AI features in 2026?
All major platforms now include AI in some form. Power BI has Copilot ($30/user/month add-on). Tableau has Pulse for proactive metric monitoring (Tableau+ tier). Looker has Gemini NLQ and Semantic Views. Qlik has Insight Advisor and AutoML (included in Premium). ThoughtSpot has Spotter AI (Pro: 25 queries/month cap). Domo has Domo.AI. Zoho Analytics has Zia AI included on all plans at no extra cost. The key differentiator is not whether AI is present but whether it produces governed, consistent outputs, which depends on the quality of the underlying data model.
How do I connect BI tools to Google Sheets or Excel?
Most enterprise BI tools (Power BI, Tableau, Looker) can import data from Google Sheets or Excel as a source. None of them offer a live, auto-refreshing two-way connection to spreadsheets as a native feature. Coefficient takes the opposite approach: rather than pulling spreadsheet data into a BI tool, it connects Google Sheets and Excel directly to source systems (Salesforce, HubSpot, NetSuite, Snowflake and 100+ others) so the spreadsheet itself contains live, auto-refreshing data that can feed any BI tool.
Is BI software worth it for small businesses?
It depends on the problem. If the bottleneck is getting live operational data to the people who need it, Coefficient or Zoho Analytics solve this at $49/month or $30/month respectively without the complexity of enterprise BI. If the bottleneck is complex data modelling, metric governance across many teams, or polished executive dashboards, a platform like Power BI or Tableau is worth the investment. Most small businesses do not need Looker or Domo. The cost and implementation complexity exceed the value for teams under 50 people.


