


WACC Formula Explained
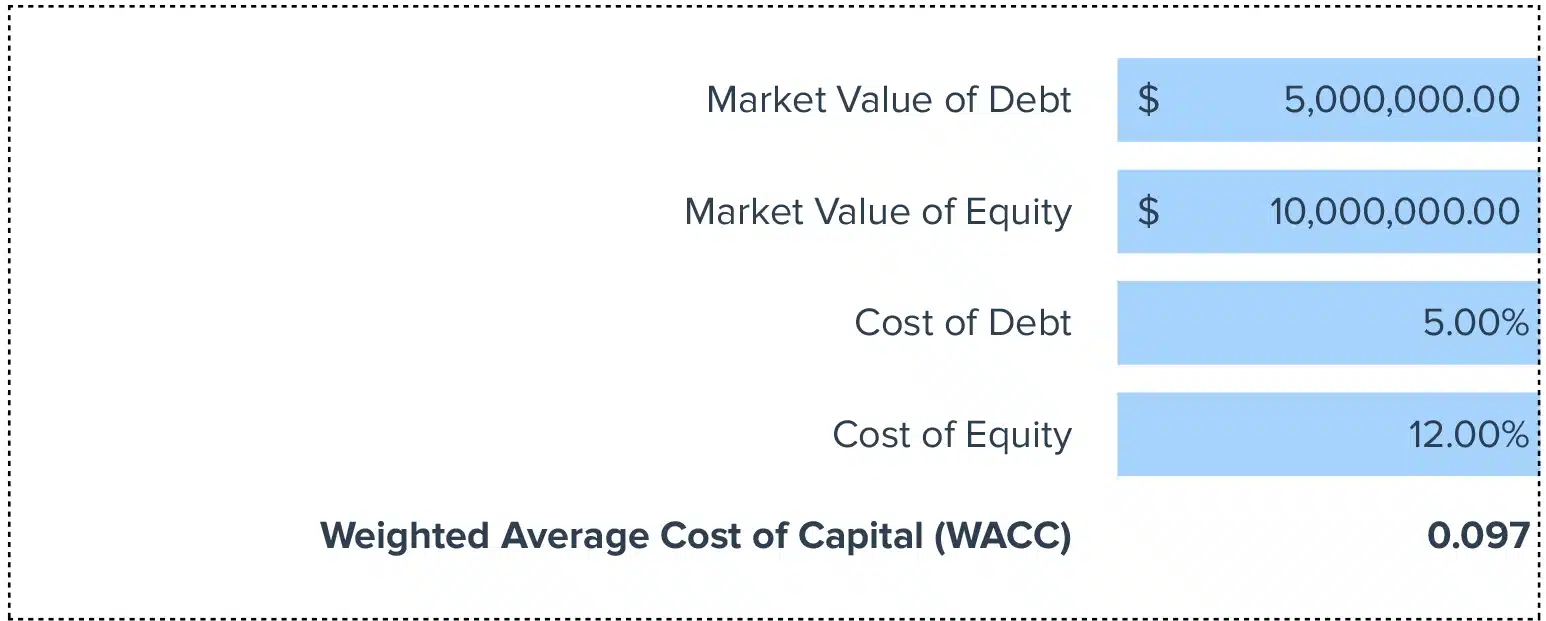
WACC = (E/V × Re) + (D/V × Rd × (1 – T))
Let’s break down each component:
E (Equity): The market value of your company’s equity. For public companies, this is shares outstanding times share price. For private companies, use comparable company analysis to estimate equity value.
D (Debt): The market value of your company’s debt. You can typically use book value from the balance sheet as an approximation, since debt market value rarely differs much from book value unless interest rates have changed dramatically since issuance.
V (Total Value): The sum of equity and debt (E + D). This represents your company’s total capital.
Re (Cost of Equity): The return equity investors expect for investing in your company. We calculate this using the Capital Asset Pricing Model (CAPM), which considers the risk-free rate, market risk premium, and your company’s beta.
Rd (Cost of Debt): The interest rate your company pays on its debt. Use the yield to maturity on publicly traded bonds or the interest rate on recent long-term debt issuances.
T (Tax Rate): Your company’s effective tax rate. We include this because interest payments are tax deductible, creating a tax shield that lowers your effective cost of debt.
Why we subtract inventory from the calculation? Interest on debt is tax deductible. This tax benefit lowers your actual cost of borrowing. A company paying 6% interest with a 25% tax rate has an after-tax cost of debt of just 4.5%.
What Is WACC?
WACC measures the average rate your company must pay to finance its assets through debt and equity. It answers the question: “What does it cost us to raise one more dollar of capital?”
Think of WACC as your hurdle rate. Any project or investment that returns less than your WACC destroys value. Any project that returns more than your WACC creates value. A company with an 8% WACC should only pursue investments that generate returns above 8%.
Who uses this metric?
- CFOs and Corporate Finance Teams evaluating capital budgeting decisions and setting return hurdles for new projects
- Investment Bankers valuing companies using discounted cash flow analysis for M&A transactions
- Private Equity Investors assessing acquisition targets and determining appropriate leverage structures
- Equity Research Analysts building financial models and determining fair value for public companies
- Fractional CFOs advising portfolio companies on capital structure optimization and investment decisions
How to Calculate WACC: Step-by-Step
Let’s walk through calculating WACC with a realistic example for a mid-sized technology company.
Step 1: Gather your capital structure data
Start with your most recent balance sheet. For our example, TechCo has $300 million in market cap (equity) and $200 million in outstanding debt, giving us a total enterprise value of $500 million.
Step 2: Calculate your capital weights
Equity weight = $300M / $500M = 60%
Debt weight = $200M / $500M = 40%
These percentages tell you how much of your capital comes from each source.
Step 3: Determine your cost of debt
TechCo’s recent bond issuance carries a 5.5% yield to maturity. The company’s effective tax rate is 24%, so the after-tax cost of debt is:
5.5% × (1 – 0.24) = 4.18%
Step 4: Calculate your cost of equity using CAPM
The risk-free rate (10-year Treasury) is 4.2%. The market risk premium is 6.0%. TechCo’s beta is 1.15.
Cost of equity = 4.2% + (1.15 × 6.0%) = 11.1%
Step 5: Apply the WACC formula
WACC = (60% × 11.1%) + (40% × 4.18%)
WACC = 6.66% + 1.67% = 8.33%
Step 6: Interpret the result
TechCo’s WACC is 8.3%. This means TechCo must earn at least 8.3% on investments to create value. Any project returning less than 8.3% destroys value.
How to Interpret Your WACC Number?
| WACC Range | Interpretation | Recommended Actions |
|---|---|---|
| Below 5% | Exceptionally low cost – Highly stable business with strong credit profile and low equity risk | Consider opportunistic investmentsMay be underleveragedEvaluate strategic growth initiatives |
| 5% – 8% | Low to moderate cost – Established company with predictable cash flows and solid market position | Maintain current capital structurePursue selective investmentsMonitor market conditions |
| 8% – 10% | Moderate cost – Typical for growing companies in competitive industries | Focus on high-return projectsOptimize debt-to-equity mixBuild competitive moat |
| 10% – 15% | Elevated cost – Higher risk profile, growth-stage company, or cyclical industry | Prioritize best opportunities onlyWork to lower cost of capitalImprove financial metrics |
| Above 15% | High cost – Significant risk, distressed situation, or early-stage venture | Focus on survival and stabilizationImprove operational efficiencyAddress underlying risk factors |
WACC Benchmarks by Industry
Understanding how your WACC compares to industry peers provides crucial context for evaluating your capital efficiency and competitive position.
| Industry | Typical WACC Range | Notes |
|---|---|---|
| Technology (Software) | 8.5% – 12.0% | Higher equity costs due to growth expectations and volatility; minimal debt usage |
| Healthcare & Pharma | 7.0% – 10.5% | Moderate costs; biotech higher than established pharma; regulatory risk premium |
| Energy & Natural Resources | 6.3% – 13.5% | Wide range; traditional oil/gas higher than renewables; commodity price sensitivity |
| Industrial Manufacturing | 6.5% – 9.5% | Lower range; tangible assets support debt; stable cash flows reduce risk |
| Real Estate | 5.5% – 8.5% | Lowest costs; asset-backed financing; predictable rental income |
| Consumer & Retail | 7.5% – 11.0% | Mid-range; varies by segment; discretionary spending risk |
| Financial Services | 6.0% – 9.0% | Low debt costs due to nature of business; regulatory capital requirements |
The range in WACCs across industries reflects fundamental differences in business risk. Real estate benefits from tangible collateral that lowers debt costs. Technology faces higher equity costs due to uncertain cash flows and rapid change.
Manufacturing companies with physical assets access cheaper financing than biotech firms burning cash in clinical trials. Compare your WACC to peers to benchmark performance.
Benchmark Citations
- KPMG Cost of Capital Study 2025
- NYU Stern Damodaran Cost of Capital Data
- Phoenix Strategy Group Industry Analysis
Automating WACC Tracking with Coefficient
Stop manually updating spreadsheets with data from multiple sources each quarter. Coefficient connects your financial systems directly to Excel or Google Sheets, pulling live market data, balance sheet figures, and debt schedules automatically. Your WACC calculates itself from current information.
Link real-time Treasury rates, market betas, and capital structure from your ERP. Set up once, refresh automatically. Perfect for teams managing multiple entities. Get started with live data connections today.
How to Improve Your WACC
A lower WACC means your company can pursue more value-creating projects and improve your valuation. Here are five proven strategies.
1. Optimize your capital structure
Most companies can lower WACC by adjusting their debt-to-equity mix. Adding debt reduces WACC because debt is cheaper than equity after taxes. Find the optimal leverage ratio that balances lower costs against increased risk.
2. Improve your credit profile
Lower credit spreads directly reduce your cost of debt. Focus on metrics lenders care about: maintain strong interest coverage ratios above 3.0x, keep leverage ratios below 3.0x net debt to EBITDA, and build consistent free cash flow generation.
3. Reduce business volatility
A lower beta means lower cost of equity. Diversify revenue across customers and markets. Build recurring revenue models. Long-term contracts and subscriptions reduce risk.
4. Communicate with investors
Information gaps increase perceived risk. Regular earnings calls and transparent reporting help investors understand your business. Better understanding leads to lower required returns.
5. Take advantage of the interest tax shield
Since interest is tax deductible, higher tax-paying companies benefit more from debt financing. If you’re paying full corporate tax rates, debt becomes more attractive relative to equity. Companies with NOLs or low taxable income lose this advantage.
WACC vs. Cost of Equity vs. Cost of Debt vs. Hurdle Rate
These terms are related but distinct. Understanding the differences helps you apply each concept appropriately.
WACC blends your costs of debt and equity based on how much of each you use. It represents your overall cost of capital.
Cost of Equity is what equity investors demand as compensation for owning your stock. It’s always higher than cost of debt because equity is riskier—stockholders get paid last.
Cost of Debt is the interest rate you pay to borrow money, adjusted for the tax deduction you get on interest payments.
Hurdle Rate is the minimum return you require before approving an investment. Companies often set their hurdle rate at or above WACC, sometimes adding a risk premium for certain project types.
A practical example: A company has a WACC of 8%, cost of equity of 11%, cost of debt of 5% (after tax), and sets its hurdle rate at 10%. The CFO uses WACC to value the entire company in a DCF model, cost of equity to determine dividend policy, cost of debt to evaluate refinancing opportunities, and the hurdle rate to screen capital projects.
Pro tip for fractional CFOs: When advising clients, remember that WACC changes if you change the capital structure. A company planning to add significant debt for an acquisition needs a new WACC calculation reflecting the post-deal capital structure—don’t use the current WACC to evaluate a transaction that fundamentally changes leverage.
 Sync Live Finance Data into Your Spreadsheet


