

Liquidity Ratio = (Current Assets – Inventory) / Current Liabilities
Simplify your financial analysis with this accessible TIE Calculator for your spreadsheets.
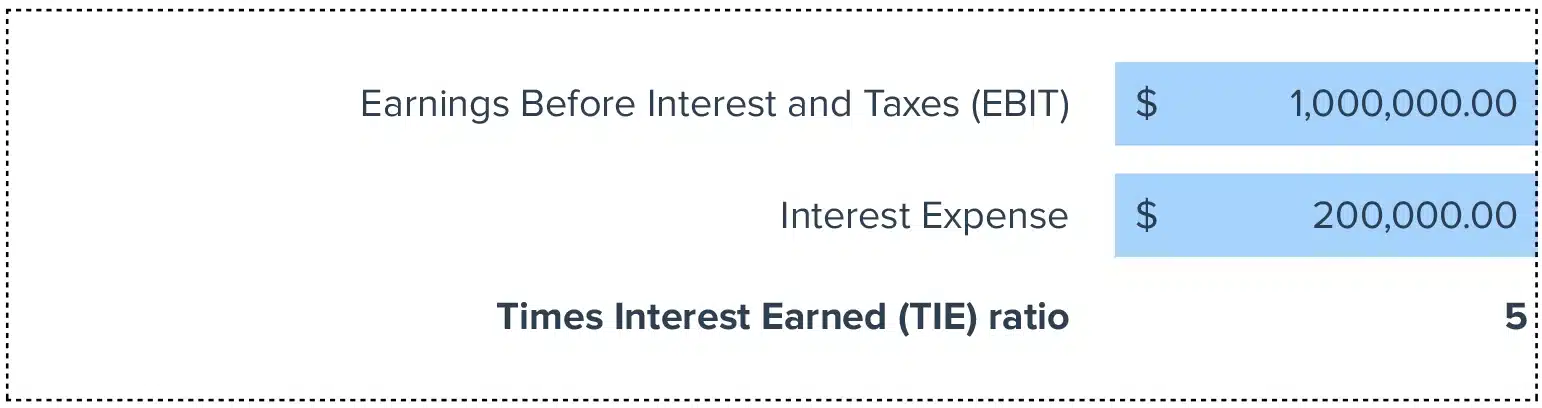
How to Calculate Times Interest Earned (TIE)?
EBIT (Earnings Before Interest and Taxes): This represents the company’s earnings before subtracting interest and taxes— a key indicator of a company’s profitability.
Interest Expenses: This refers to the periodic cost incurred by a company due to its borrowings, generally noted in the financial statements as interest payable.
What is Times Interest Earned (TIE) Ratio?
The Times Interest Earned (TIE) Ratio is an essential financial metric that measures a company’s ability to meet its debt obligations based on its current income. It provides a clear snapshot of financial health, focusing specifically on profitability and debt.
Why is the Times Interest Earned (TIE) Ratio Important?
Understanding the TIE ratio helps companies monitor their financial stability and ability to pay interest on outstanding debt—crucial for maintaining good credit standings and operational freedom.
Calculating TIE Ratio Example with Numbers
Imagine a company with an EBIT of $500,000 and annual interest expenses of $100,000. The TIE ratio would be calculated as:
TIE = $500,000 / $100,000 = 5
This indicates that the company earns 5 times its interest expenses, signaling strong financial health.
How to Improve Times Interest Earned Ratio
- Increase Operational Efficiency: Focus on optimizing operational costs and enhancing productivity to increase profits, thus improving your TIE ratio.
- Debt Restructuring: Consider restructuring debts to achieve lower interest rates or extended payment terms, reducing the interest burden.
- Revenue Optimization: Explore new markets or adjust pricing strategies to boost revenue without elevating operating expenses.
- Cost Management: Rigorously manage operating expenses, avoiding unnecessary expenditure to retain more earnings.
- Strategic Financial Planning: Employ comprehensive budgeting and financial forecasting to foresee future earnings and expenses better, aligning them suitably.
How to Calculate TIE in Google Sheets and Excel?
- Enter EBIT in cell A1.
- Input Interest Expenses in cell A2.
- Type the formula
=A1/A2in cell A3 to compute the TIE ratio.
Drawbacks of the Times Interest Earned (TIE) Ratio
- Does Not Account for Amortizations: The TIE ratio often overlooks amortization expenses, potentially skewing the understanding of a company’s ability to cover interest expenses.
- Ignores Cash Flow Scenarios: TIE is calculated based on earnings, not actual cash available, which can be misleading in tight cash flow situations.
- May Not Reflect Seasonal Variations: TIE figures might not adequately represent businesses with seasonal fluctuations, as it calculates based on annual data.
When to Use the TIE Calculator
Utilize the TIE Calculator when evaluating loan agreements, during financial reviews, or when assessing the overall financial health of your company. It’s particularly effective for financial professionals in industries where debt levels are frequently reviewed.
TIE Calculator: Tips and Tricks
- Quick Reference: Keep a TIE calculator handy in your spreadsheet to quickly assess financial stability.
- Integrate Data: Link your financial sheets directly with your accounting software to pull real-time data for more accurate analysis.
- Use Scheduled Refreshes: Set data to refresh automatically to ensure your TIE calculations always utilize the most recent financial data.
 Sync Live Data into Your Spreadsheet


