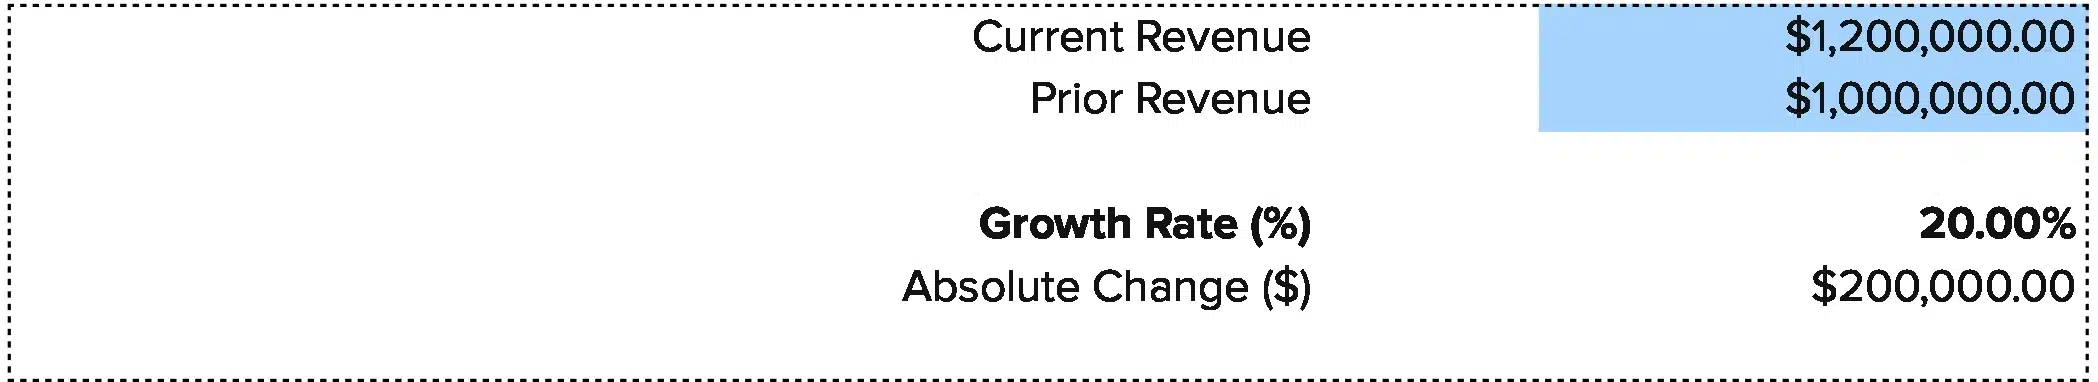


Revenue Growth Rate = ((Current Period Revenue – Prior Period Revenue) / Prior Period Revenue) × 100
This free revenue growth calculator cuts through the math. You can track how fast your sales grow month to month or year to year, spot trends, and make data-driven calls about where to put your money next.
Get your revenue growth rate in seconds.
We’ve also built a free Excel and Google Sheets template you can grab and use right away.
Revenue Growth Formula Explained
Revenue Growth Rate = ((Current Period Revenue – Prior Period Revenue) / Prior Period Revenue) × 100
Let’s break this down:
Current Period Revenue: Total sales revenue for the time frame you’re measuring. This includes all product sales, service fees, and recurring revenue from subscriptions. It’s the top line from your income statement for this month, quarter, or year.
Prior Period Revenue: Total sales revenue from the last time frame. If you’re looking at Q2 2025, this would be Q1 2025 for quarter-over-quarter growth, or Q2 2024 for year-over-year growth. Always compare equal time frames.
Why we divide by prior period revenue: This creates a percentage that shows relative growth, not just dollar change. A $100,000 jump means more to a $500,000 company than a $5 million one.
Why we multiply by 100: Converting to a percentage makes the number easier to read and compare. “25% growth” is clearer than “0.25 growth.”
What Is Revenue Growth Rate?
Revenue growth rate shows how fast your sales are going up or down over time. It’s a percentage that tells you if your business is getting bigger, staying flat, or shrinking.
This is your most basic health check. Strong revenue growth means you’re winning new customers, keeping old ones, and selling more. Weak or negative growth means you need to fix something fast.
Who uses this metric?
CFOs and Controllers tracking overall business performance and building financial forecasts.
CEOs and Founders proving traction to investors and boards while setting growth targets.
VPs of Sales measuring if sales efforts turn into actual revenue increases.
Financial Analysts building models, running scenarios, and valuing companies.
Fractional CFOs comparing growth across client portfolios to spot outliers.
How to Calculate Revenue Growth Rate: Step-by-Step
Let’s walk through a real example. You’ll see exactly how the math works.
- Pick your time frame
Choose what you want to compare. Most companies track quarter-over-quarter and year-over-year. We’ll use annual growth for this example.
- Get your prior period revenue
Pull your total revenue from your income statement for last year. For our example: $3,200,000 in 2024.
- Get your current period revenue
Pull this year’s total revenue from your income statement. For our example: $4,000,000 in 2025.
- Calculate the revenue change
Subtract last year from this year: $4,000,000 – $3,200,000 = $800,000 increase
- Divide by prior period revenue
Take that $800,000 and divide by last year’s revenue: $800,000 ÷ $3,200,000 = 0.25
- Convert to percentage
Multiply by 100 to get your growth rate: 0.25 × 100 = 25%
- Read your result
A 25% revenue growth rate means your sales grew by one quarter compared to last year. You added $800,000 in new revenue, which is solid growth for most industries.
How to Interpret Your Revenue Growth Number
Understanding what your growth rate means depends on your business stage and industry.
| Growth Rate | Interpretation | Recommended Actions |
| Below 0% | Declining revenue – Your business is shrinking. This signals major problems with customer retention, market fit, or competition. | • Cut costs fast to preserve cash<br>• Interview lost customers to find why they left<br>• Review pricing against competitors<br>• Audit product quality and service delivery |
| 0% – 10% | Slow growth – Your business is barely moving forward. This is too slow for most startups and concerning for established companies. | • Analyze why growth stalled<br>• Test new marketing channels<br>• Review sales team performance<br>• Consider product improvements or new features |
| 10% – 25% | Moderate growth – Decent for established companies, weak for startups. You’re growing but not fast enough to dominate your market. | • Look for growth accelerators<br>• Invest in top-performing channels<br>• Expand sales team if CAC allows<br>• Test pricing increases |
| 25% – 50% | Strong growth – Healthy expansion rate. You’re building momentum and gaining market share. This attracts investors. | • Maintain current strategies<br>• Scale what’s working<br>• Start planning for next growth stage<br>• Build infrastructure for bigger size |
| Above 50% | Rapid growth – Exceptional performance. You’re crushing it, but watch for growing pains like cash flow issues or service quality drops. | • Ensure unit economics stay healthy<br>• Build systems before they break<br>• Hire ahead of need<br>• Monitor churn closely as you scale |
Revenue Growth Benchmarks by Industry
Growth rates vary widely by industry. What’s good for retail might be weak for SaaS.
| Industry | Typical Annual Range | Notes |
| SaaS / Software | 20% – 100% | Early stage SaaS should hit 50-100% growth; mature companies see 20-40% as strong |
| E-commerce / Retail | 10% – 30% | Lower margins mean slower growth; seasonal spikes can skew yearly numbers |
| Professional Services | 5% – 15% | Growth limited by billable hours; scaling requires hiring, which takes time |
| Manufacturing | 3% – 10% | Capital intensive; growth tied to capacity investments and supply chains |
| Healthcare Services | 8% – 15% | Regulated industry with steady demand; growth limited by licensing and staffing |
| Financial Services | 5% – 12% | Mature industry with regulatory constraints; fintech can grow much faster at 30-50% |
| Hospitality | 5% – 20% | Highly cyclical; growth tied to economic conditions and consumer spending |
Why do rates vary so much? SaaS companies have low marginal costs and can scale fast. Manufacturers need to build factories. Service businesses need to hire people. Retail faces thin margins and tough competition.
Stage matters too. A three-year-old SaaS startup growing 30% is failing. A 20-year-old manufacturer growing 8% is doing great.
Benchmark Citations
SaaS Capital 2025 Private B2B SaaS Growth Benchmarks
Lighter Capital 2025 B2B SaaS Benchmarks
Automating Revenue Growth Tracking with Coefficient
Stop exporting CSVs from NetSuite or QuickBooks every month just to update a spreadsheet. Coefficient connects your accounting system straight to Excel or Google Sheets. Your revenue data flows in automatically, and your growth rates calculate themselves.
Set up takes 10 minutes. After that, your financial dashboards refresh on whatever schedule you want – daily, weekly, monthly. Perfect for finance teams tracking metrics across multiple entities or fractional CFOs managing several clients.
Get started free and automate your revenue tracking today.
How to Improve Your Revenue Growth
Accelerating growth requires deliberate strategy. Here are five proven approaches.
Expand into new markets
Find adjacent customer segments or geographic regions that need your product. A B2B software company selling to healthcare might expand to financial services. This adds new revenue streams without changing your core product.
Increase prices strategically
Most companies underprice their products. Test 10-15% increases on new customers first. If conversion rates hold steady, you just boosted revenue without adding costs. Existing customers can see increases at renewal.
Launch complementary products
Sell more to current customers through add-ons, upgrades, or related products. This is cheaper than finding new customers. A project management tool might add time tracking or invoicing features.
Improve sales efficiency
Track which channels and reps drive the most revenue. Double down on what works. Cut what doesn’t. Better sales training, refined targeting, and faster deal cycles all boost growth without spending more.
Reduce churn aggressively
Every lost customer is lost recurring revenue. Fix the top three reasons customers leave. Improve onboarding, add needed features, or provide better support. Keeping customers is easier than finding new ones.
Revenue Growth Rate vs. MRR Growth vs. ARR Growth
These metrics measure related but distinct aspects of business growth.
Revenue Growth Rate
Revenue growth rate measures total sales increase over any time period. It’s your most basic growth metric – simple to calculate, easy to explain.
MRR Growth (Monthly Recurring Revenue)
MRR Growth tracks only subscription revenue that repeats each month. It excludes one-time fees and shows predictable income. SaaS companies watch this closely because it reveals the health of their subscription base.
ARR Growth (Annual Recurring Revenue)
ARR Growth is MRR × 12. It projects yearly recurring revenue based on current monthly subscriptions. Investors prefer this for valuating subscription businesses because it shows committed future revenue.
When to use each
Total revenue growth shows overall business health. MRR and ARR growth reveal subscription business quality. For subscription businesses, MRR and ARR growth rates matter more than total revenue growth because they show sustainable, predictable income.
Pro tip for fractional CFOs: Present all three metrics to clients. Total revenue growth shows overall business health. MRR/ARR growth reveals subscription business quality. The gap between them highlights reliance on non-recurring revenue, which can be a risk factor.
Drive consistent growth
Revenue growth tells you if your business model is working. Strong growth means you’re winning in the market. Weak growth means you need to fix your product, pricing, or go-to-market strategy.
Track this metric monthly. Compare it to your industry benchmarks. Use it to make better decisions about marketing spend, sales hiring, and product investments.Get started with Coefficient to automate your revenue tracking and focus on what drives growth.
 Sync Live Finance Data into Your Spreadsheet


