


Market Capitalization Formula Explained
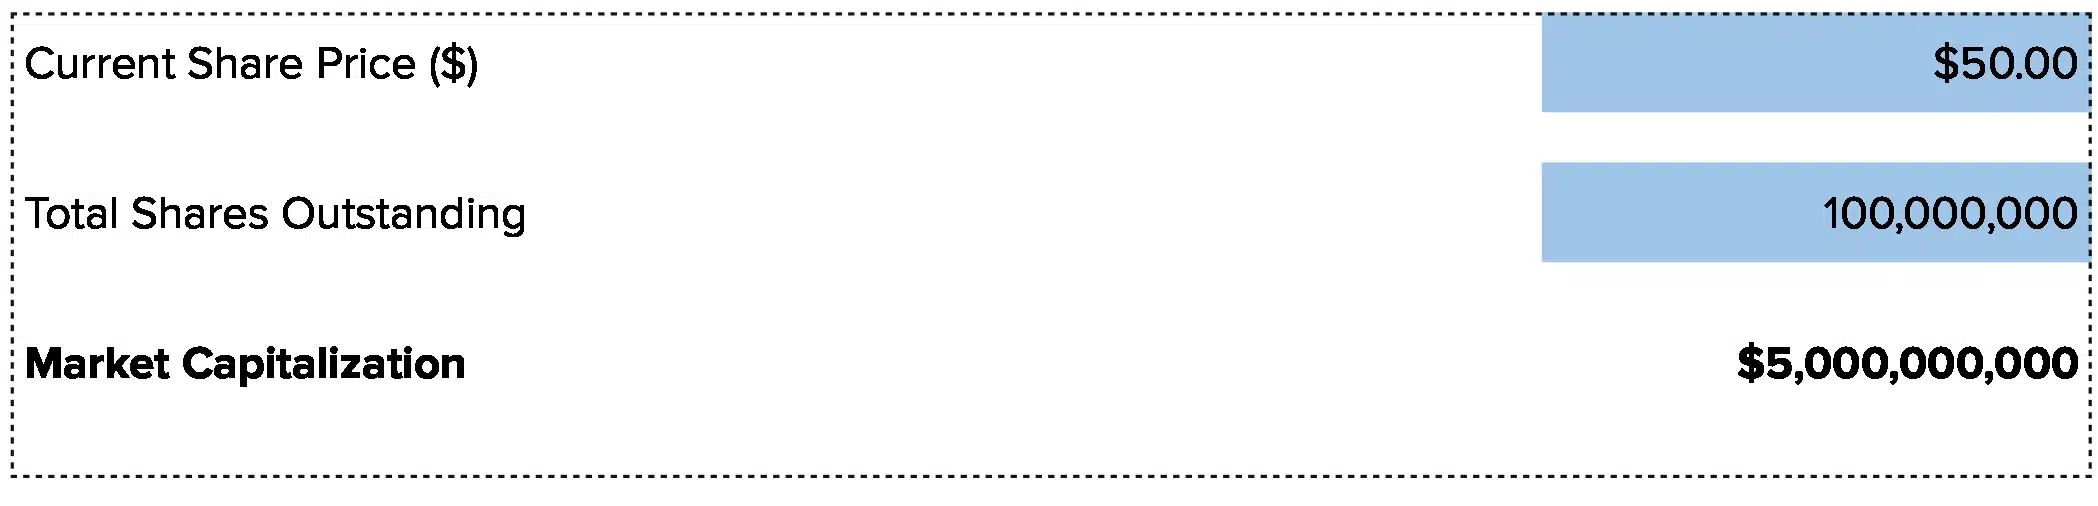
Market Capitalization = Share Price × Total Outstanding Shares
Let’s break down each part:
Share Price: The current trading price per share on the stock market. This reflects what investors will pay for one share right now. The price changes throughout each trading day based on buy and sell orders. You can find the current share price on any financial website or your brokerage platform.
Total Outstanding Shares: All shares that investors currently own. This includes shares held by company insiders, institutional investors, and retail traders. Companies report this number on their balance sheet as “capital stock” or “shares outstanding.” The count changes when companies issue new shares, buy back stock, or convert employee stock options.
Why use these two components? Market cap shows the total value the market assigns to a company. It’s the price you’d pay if you could buy every single share at the current price. This makes it the most direct way to compare company size across industries.
What Is Market Capitalization?
Market cap measures a company’s total value based on its stock price. It answers one simple question: “How much is this entire company worth according to the stock market?”
Think of it this way. If you wanted to buy all of Apple’s stock, market cap tells you what you’d pay. The number reflects what all investors collectively believe the company is worth right now.
Market cap matters because it groups companies into size categories. These categories help investors understand risk levels, growth potential, and how stocks might perform. Smaller companies often grow faster but swing in price more. Larger companies tend to be more stable but grow slower.
Who uses this metric?
Portfolio Managers track market cap to ensure proper diversification across small, mid, and large-cap stocks.
Financial Analysts use market cap to compare companies and build sector-based models.
CFOs and Controllers monitor their own company’s market cap relative to peers and industry benchmarks.
Investment Bankers rely on market cap for M&A valuations and deal structuring.
Equity Research Analysts segment coverage universes by market cap and track valuation trends.
How to Calculate Market Capitalization: Step-by-Step
Let’s walk through calculating market cap with a real example:
- Find the current share price
Look up the stock ticker on any financial website. For our example, let’s say Company XYZ trades at $45.00 per share.
- Locate total outstanding shares
Check the company’s most recent 10-Q or 10-K filing on the SEC website. You can also find this on financial data sites under “shares outstanding.” Company XYZ has 250 million shares outstanding.
- Verify you’re using the right share count
Make sure you’re using diluted shares outstanding, not basic shares. Diluted shares include stock options and convertible securities that could become shares. This gives you a more accurate total. Company XYZ reports 250 million diluted shares.
- Multiply share price by total shares
Take the share price and multiply it by outstanding shares: $45.00 × 250,000,000 = $11,250,000,000
- Convert to billions for readability
Divide your result by one billion: $11,250,000,000 ÷ 1,000,000,000 = $11.25 billion
- Categorize the market cap
Based on the result, Company XYZ falls into the large-cap category with an $11.25 billion market cap.
- Interpret the result
At $11.25 billion, Company XYZ is a large-cap stock. This suggests it’s an established company with a track record. Investors can expect moderate growth with less price volatility than smaller companies. The stock likely trades with high liquidity, making it easy to buy and sell shares.
How to Interpret Your Market Capitalization Number
Understanding market cap categories helps you assess risk and growth potential.
| Ratio Range | Interpretation | Recommended Actions |
| Below $300M | Micro-cap – High risk, high potential reward. Very limited analyst coverage and institutional ownership. Highly volatile with liquidity concerns. | • Only invest money you can lose<br>• Expect 20-40% price swings<br>• Verify financial health carefully<br>• Plan longer hold times due to low liquidity |
| $300M – $2B | Small-cap – Significant growth potential with elevated risk. Some institutional interest and analyst coverage. Price moves can be sharp. | • Diversify across multiple small-caps<br>• Monitor quarterly earnings closely<br>• Set stop losses for protection<br>• Research management team quality |
| $2B – $10B | Mid-cap – Balance of growth and stability. Good analyst coverage and institutional ownership. Moderate volatility. | • Core portfolio holdings for growth<br>• Track industry trends regularly<br>• Monitor competitive position<br>• Review fundamentals quarterly |
| $10B – $200B | Large-cap – Established companies with steady performance. Heavy institutional ownership and extensive coverage. Lower volatility. | • Stable core portfolio holdings<br>• Expect single-digit to mid-teen returns<br>• Monitor dividend sustainability<br>• Track market share trends |
| Above $200B | Mega-cap – Market leaders with global reach. Maximum institutional ownership and coverage. Lowest volatility but slower growth. | • Portfolio foundation for stability<br>• Expect GDP-level growth rates<br>• Focus on competitive moat strength<br>• Monitor regulatory risks |
Market Capitalization Benchmarks by Industry
Understanding typical market caps by industry helps you set realistic expectations for company size and growth potential.
| Industry | Typical Range | Notes |
| Technology | $1B – $3.5T | Wide range from startups to mega-caps like Nvidia ($3.45T) and Alphabet ($1.87T). Software and semiconductor companies dominate the high end. |
| Financial Services | $500M – $500B | Banks and insurance firms cluster in large-cap range. JPMorgan Chase leads. Sector totals $21.1T globally in 2025. |
| Healthcare | $2B – $800B | Pharmaceuticals like Eli Lilly ($791B) reach mega-cap status. Medical devices and biotech firms span mid to large-cap ranges. |
| Retail | $100M – $700B | Walmart leads with traditional retail. E-commerce giants like Amazon ($2.27T) push the top end higher each year. |
| Energy | $500M – $400B | Oil and gas majors dominate large-cap space. Renewable energy firms mostly mid-cap. Commodity price sensitivity drives wide ranges. |
| Manufacturing | $200M – $200B | Industrial firms spread across all categories. Aerospace and defense companies reach large-cap. Most manufacturers stay mid-cap. |
| Real Estate | $50M – $50B | REITs and property companies cluster in small to mid-cap ranges. Sector smallest globally at $3.3T total market cap. |
| Consumer Goods | $500M – $300B | Established brands reach large-cap status. Emerging brands and regional players stay mid to small-cap. |
Technology, energy, healthcare, and financial services lead market cap rankings in 2025. The information technology sector alone accounts for $25.7 trillion in global market cap. Financial services follows at $21.1 trillion. These two sectors represent more than half of global equity value.
Real estate remains the smallest sector at $3.3 trillion, despite having thousands of publicly traded companies. The industrials sector claims the most listed firms at 8,780 worldwide but lacks the concentration of mega-caps seen in technology.
Market caps vary within industries based on business models, geographic reach, and competitive positions. A regional bank might have a $2 billion market cap while JPMorgan exceeds $400 billion. Both operate in financial services but serve different markets with different risk profiles.
Benchmark Citations
Stern School NYU Market Cap by Sector Data
AlphaSense Largest Companies by Market Cap 2025
Visual Capitalist Global Stock Market by Sector
Automating Market Capitalization Tracking with Coefficient
Stop pulling stock prices and share counts manually from multiple sources each quarter. Coefficient connects your Excel or Google Sheets directly to financial data providers, updating market caps in real time.
Your portfolio tracking spreadsheets refresh on the schedule you set—daily, weekly, or monthly. No more copying data from Yahoo Finance or your brokerage platform. Track hundreds of stocks across your portfolio with automatic updates.
Perfect for investment firms managing multiple portfolios or finance teams tracking peer company valuations.
Get started with Coefficient to automate your market cap tracking.
How to Improve Your Company’s Market Capitalization
If you’re tracking your own company’s market cap, these strategies can help boost it over time:
Grow revenue and earnings consistently
Hit or beat earnings guidance for four straight quarters. Market cap follows a clear pattern—companies that grow revenue 15-20% annually with improving margins see their market caps expand faster than earnings growth alone would predict. Focus on recurring revenue streams to show stability.
Improve profit margins through efficiency
Cut unnecessary costs and streamline operations. When margins improve, investors assign higher valuations. A company that moves from 12% to 15% net margins often sees its market cap jump 20-30% even if revenue stays flat.
Communicate clear growth strategy
Investors reward companies with clear, achievable plans. Host quarterly earnings calls, publish annual strategy updates, and share concrete targets. Companies with strong investor relations teams trade at 15-25% premiums to similar firms without them.
Expand market share in core business
Win customers from competitors or grow the total market. Market share gains signal competitive strength. When investors see your share rising quarter after quarter, they project future dominance and bid up your stock price.
Demonstrate strong corporate governance
Build trust through transparency, independent boards, and ethical practices. Companies with strong governance scores trade at higher multiples. Implement clear policies, regular audits, and open communication with shareholders to earn that premium.
Market Capitalization vs. Enterprise Value vs. Equity Value
These three metrics all measure company value but include different components. Here’s when to use each:
Market Capitalization
Share Price × Outstanding Shares. Market cap only looks at equity value. It ignores debt completely. Use market cap when comparing similar companies in the same industry or categorizing stocks by size. It’s the simplest measure and works well for relative comparisons.
Enterprise Value
Market Cap + Total Debt – Cash. Enterprise value shows what you’d actually pay to buy the whole company, including taking on its debt and keeping its cash. Use EV when valuing companies for M&A or comparing firms with different capital structures. A company with $10 billion market cap and $5 billion in debt has a $15 billion enterprise value (minus cash holdings).
Equity Value
Assets – Liabilities. Equity value comes from the balance sheet. It shows book value, not market value. Use equity value when analyzing financial institutions or real estate companies where assets trade close to book value. Most operating companies trade at premiums or discounts to equity value.
When to use each
The key difference: Market cap reflects what the stock market says the company is worth. Enterprise value shows what an acquirer would pay. Equity value shows what’s on the books.
Pro tip for fractional CFOs: When analyzing client companies for potential sale, always present all three metrics. Show market cap for context, enterprise value for deal structuring, and equity value to understand book value per share. This complete view helps clients understand different valuation perspectives.
Know what you own
Track market cap to understand company size, risk level, and growth potential. Use it alongside other metrics for complete portfolio analysis.
Get started with Coefficient to automate your valuation tracking across your entire portfolio.
 Sync Live Finance Data into Your Spreadsheet


