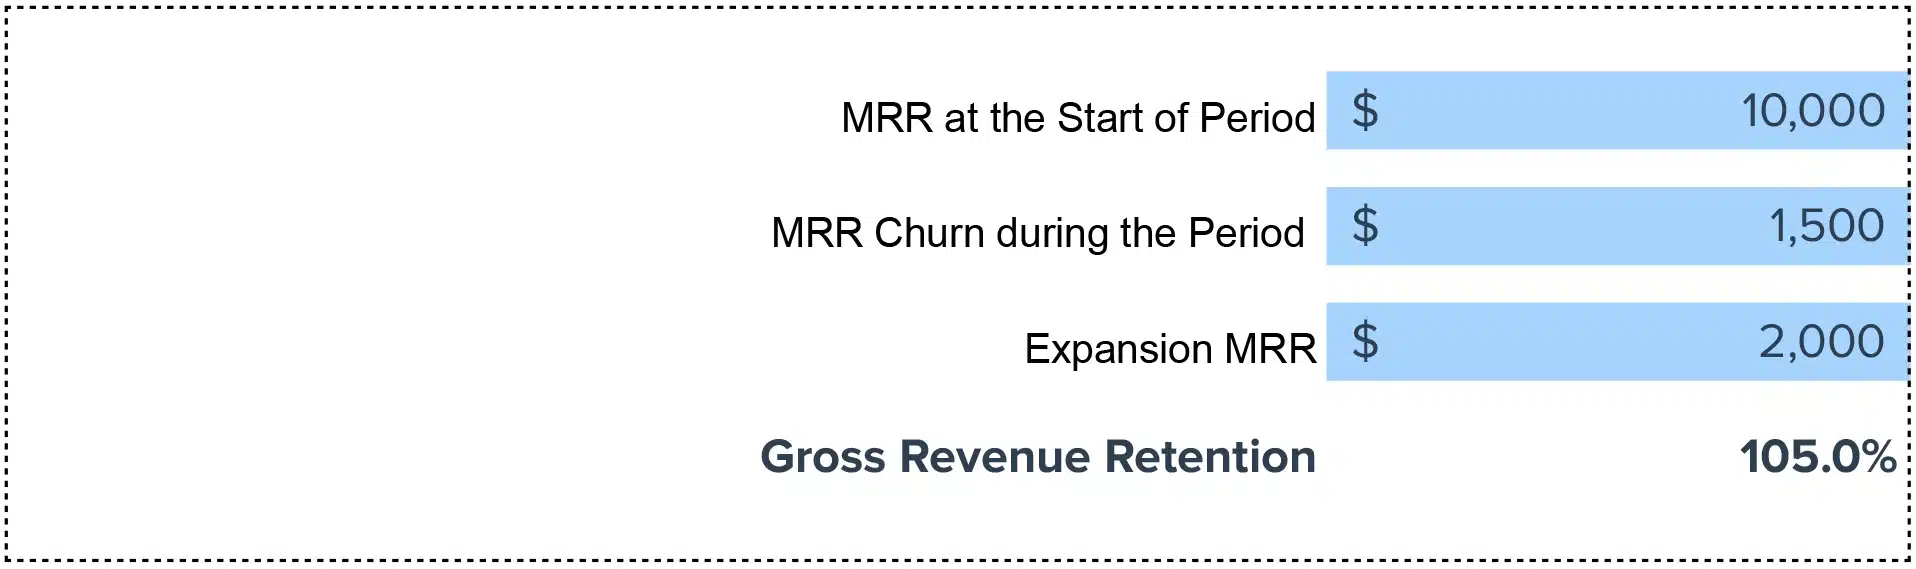


Gross Revenue Retention: (MRR at the Start of Period – MRR Churn during the Period + Expansion MRR) / MRR at the Start of Period
Gross Revenue Retention Simplified: Calculation Guide
- Identify MRR at the beginning of your period.
- Calculate the total MRR lost to churn during the same period.
- Sum any Expansion MRR gained.
- Apply the values to the GRR formula above.
GRR Overview
Gross Revenue Retention (GRR) quantifies a company’s ability to retain revenue, excluding the impact of expansions. It’s a pivotal KPI for understanding your product’s long-term sustainability and customer satisfaction.
Importance of GRR
- Signals customer satisfaction and product-market fit.
- Predicts long-term revenue potential and stability.
- Crucial for investment assessments and valuation.
Real-world Example
A software company starts with $100,000 MRR. By month’s end, it loses $5,000 MRR to churn but gains $10,000 in Expansion MRR. Its GRR would be 105%, signaling healthy growth.
Improvement Strategies
- Enhance Customer Support: A dedicated team can reduce churn.
- Upselling and Cross-selling: Encourage more spending from current customers.
- Customer Feedback Loops: Implement changes based on direct customer insights.
- Loyalty Programs: Reward long-term customers.
- Invest in Training: More skilled employees can provide better services.
Full Tutorial: Calculating GRR in Google Sheets
- Label columns: Start MRR | Churn MRR | Expansion MRR | GRR.
- Enter your data into the first three columns.
- In the GRR column, use the formula: `=(A2-B2+C2)/A2*100`.
- Drag down to apply to multiple rows.
Drawbacks
- Does not account for new MRR: Can mask issues in acquisition.
- Short-term metric: Needs longitudinal analysis for full insights.
Usage Contexts
- Ideal for evaluating customer satisfaction and retention.
- Helps in forecasting future revenue stability.
 Sync Live Data into Your Spreadsheet