
Testimonial

"Coefficient's Google Sheets templates are the next step in spreadsheet evolution–connected spreadsheets. Connected sheets mean faster, better, and more accurate analysis by everyone–especially if you can't code!"
Evan Cover
Director, BI Engineering and Governance, Klaviyo
Table of Contents
Free, pre-built Sales Operations Dashboards in Google Sheets
Upgrade your toolset instantly with this free starter dashboard package with all of the core charts, metrics and filters you need to monitor performance and grow your sales.
- Automatically populate this dashboard with live data from your HubSpot CRM
- Track year-over-year sales results and celebrate growth
- Instantly gain insights into your top performing teams, regions, industries and accounts
- Monitor your fundamental Sales KPIs including Pipeline Creation, Win Rates, Average Opp Sizes, and Sales Velocity
- Be your sales team hero with beautiful, sleek dashboards to answer any question that comes your way
Pre-Built Dashboards in the Package
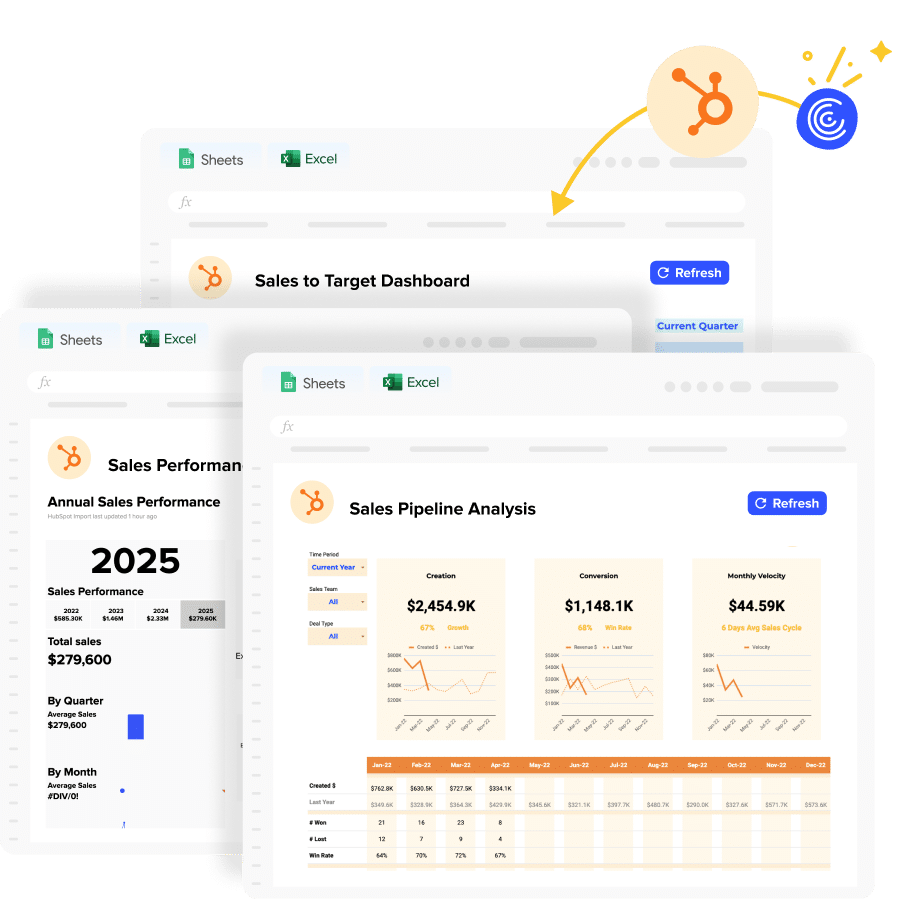
This comprehensive package includes three essential dashboards to power your sales operations:
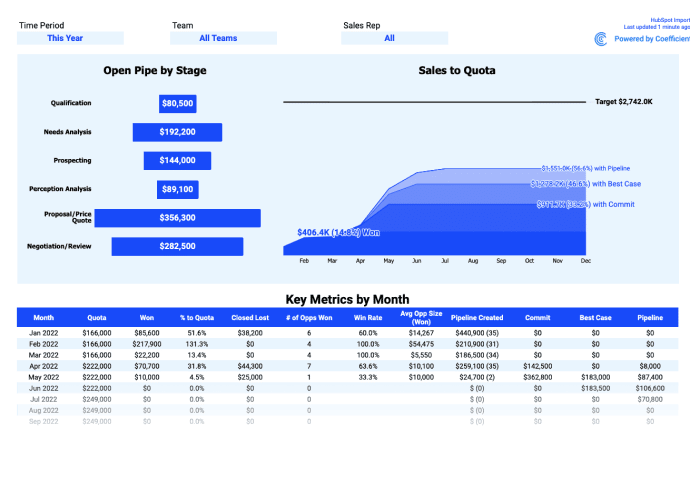
- Sales to Target Dashboard – Track performance against goals with year/quarter views, gap analysis, and team-by-team breakdowns
- Sales Pipeline Analysis – Monitor pipeline creation, conversion rates, monthly velocity, and detailed performance metrics over time
- Annual Sales Performance – Analyze yearly trends, top accounts, largest deals, and geographic/industry performance insights
Metrics Tracked in the Reports
Sales to Target Dashboard

- Revenue vs. Target – Current year and quarter performance against goals
- Sales Gap Analysis – Difference between actual and target performance
- Open Pipeline – Pipeline value and gap analysis by segment
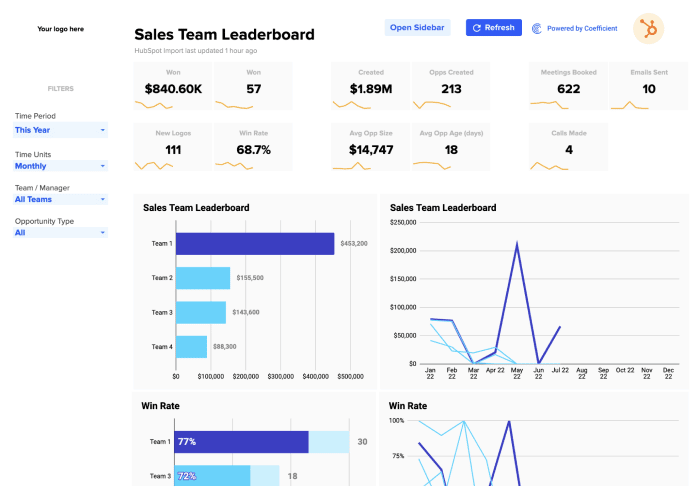
- Team Performance – Individual team metrics and target achievement
- New vs. Existing Business – Revenue breakdown by business type
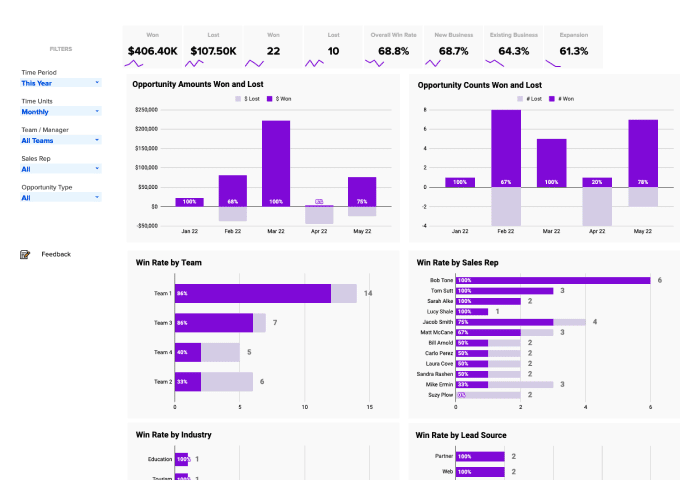
Sales Pipeline Analysis
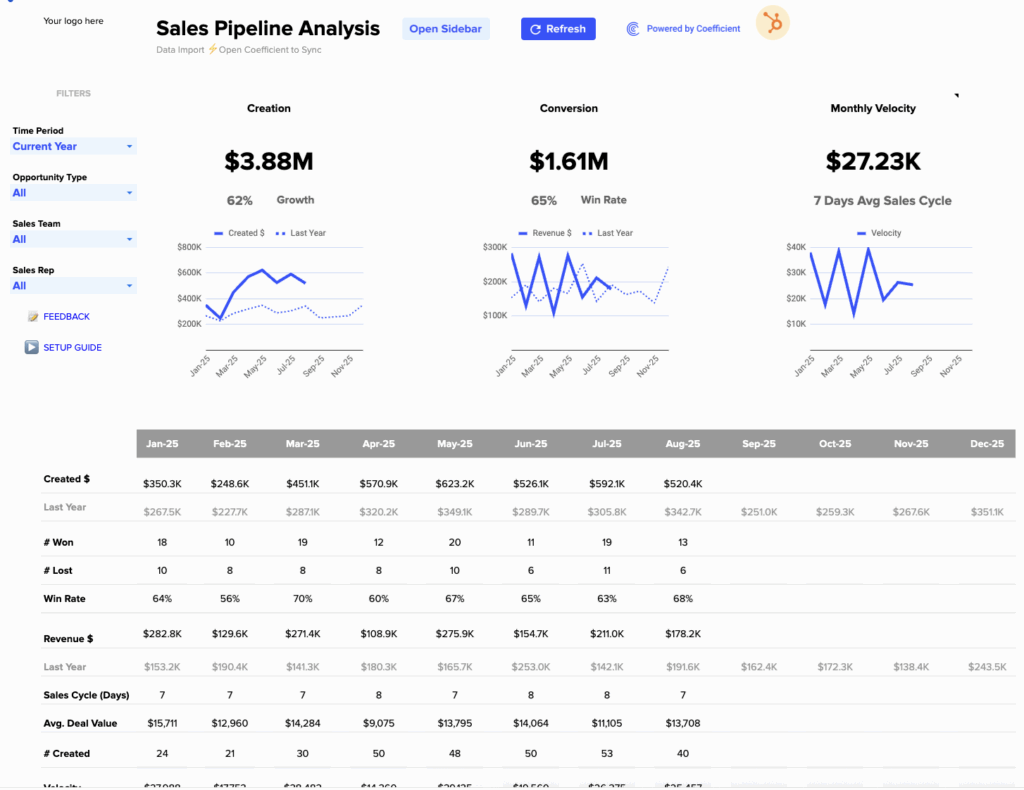
- Pipeline Creation – Total value of opportunities created over time
- Pipeline Conversion – Revenue conversion and win rate percentages
- Monthly Velocity – Average sales cycle length and deal progression
- Created vs. Revenue – Comparison of pipeline generated to revenue closed
- Win/Loss Tracking – Number of deals won and lost by time period
Annual Sales Performance

- Total Sales – Annual revenue performance with historical comparison
- Sales by Quarter/Month/Week – Time-based performance breakdowns
- Top 5 Accounts – Highest revenue-generating customer analysis
- Top 5 Industries – Revenue performance by industry vertical
- Sales by Country – Geographic revenue distribution and mapping
- Largest Deals Closed – Detailed view of biggest opportunities won
Related Resources
How to Connect HubSpot to Google Sheets
Export HubSpot Contacts to Excel or Google Sheets
HubSpot Writebacks: How to Upload Data to HubSpot
How to Automate HubSpot Commission Tracking