


Gross Margin Formula Explained
Gross Margin = (Revenue – Cost of Goods Sold) / Revenue × 100
Here’s what each part means:
Revenue: The total money you bring in from sales before any costs. This number sits at the top of your income statement. It includes all cash from selling your products or services during a set time period.
Cost of Goods Sold (COGS): The direct costs of making or delivering your product. For a manufacturer, this means raw materials, factory labor, and packaging. For a software company, it’s hosting fees, support staff, and server costs. COGS only counts what you directly spend to create what you sell.
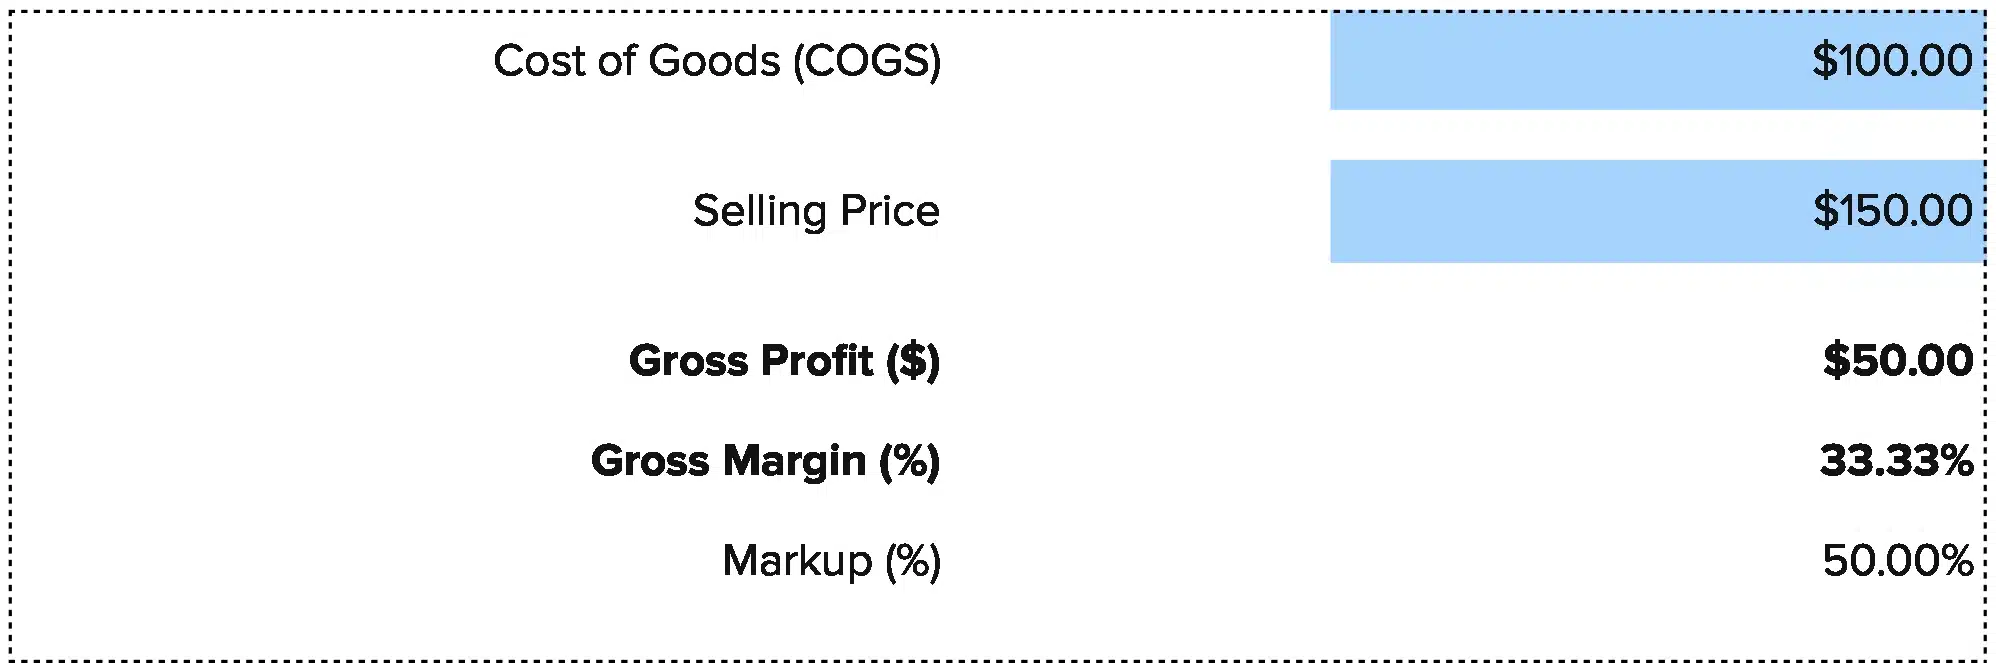
Gross Margin: The percentage of each dollar you keep after paying COGS. A 40% gross margin means you keep $0.40 of every dollar you earn.
The formula subtracts COGS from revenue to get your gross profit. Then it divides that by revenue and multiplies by 100 to give you a percentage.
Why exclude other costs? Because gross margin focuses on your core business. It shows if your product or service can make money before you pay for offices, marketing, or admin staff. Operating expenses matter, but they come later in the analysis.
What Is Gross Margin?
Gross margin measures how much profit you make from your core business operations. It strips away everything except the money you earn and the money you spend making your product or serving your customers.
Think of it as your first line of defense against losses. If your gross margin is negative, you lose money on every sale. If it’s positive but thin, you barely break even after covering direct costs. A healthy gross margin gives you room to pay salaries, invest in growth, and build cash reserves.
Who uses this metric?
CFOs and Controllers track gross margin monthly to spot cost creep and set pricing targets. They use it to decide which products to push and which to phase out.
Fractional CFOs monitor gross margin across multiple clients. They compare margins between companies to find which ones need the most help with cost control or pricing strategy.
Financial Analysts build models around gross margin. They forecast future profitability and identify which business lines drive the most value.
Business Owners use gross margin to check if their prices cover their costs. They track it over time to see if their business is getting more or less efficient.
Investors look at gross margin before writing checks. A company with strong margins can weather rough patches and scale without burning cash.
How to Calculate Gross Margin: Step-by-Step
Let’s walk through a real example. Say you run a mid-market manufacturing company that makes custom furniture.
- Pull your revenue number
Check your income statement for total revenue in the period you want to analyze. Our furniture company brought in $500,000 in Q1.
- Find your cost of goods sold
Look at your COGS line on the income statement. This includes wood, hardware, factory wages, and shipping. Our company spent $325,000 on COGS in Q1.
- Calculate gross profit
Subtract COGS from revenue:
$500,000 – $325,000 = $175,000 gross profit
- Divide gross profit by revenue
$175,000 ÷ $500,000 = 0.35
- Multiply by 100 to get your percentage
0.35 × 100 = 35% gross margin
- Interpret the result
A 35% gross margin means the company keeps $0.35 of every dollar after covering direct costs. That $175,000 gross profit now needs to cover rent, salaries, marketing, and other operating expenses. If those costs run $150,000 per quarter, the company nets $25,000 in operating profit.
How to Interpret Your Gross Margin Number
Your gross margin tells you if your business model works. Here’s what different ranges signal and what to do about them.
| Margin Range | What It Means | What To Do |
| Below 20% | Critical – You’re barely covering direct costs. Small changes in pricing or supplier costs could push you into losses. | • Review supplier contracts<br>• Raise prices where possible<br>• Cut low-margin products |
| 20% – 40% | Tight – You have some cushion but not much room for error. Cost spikes or pricing pressure will hurt. | • Track COGS monthly<br>• Negotiate better rates<br>• Look for process improvements |
| 40% – 60% | Healthy – You have decent margins to cover operating costs and invest in growth. Most mid-market businesses live here. | • Monitor trends quarterly<br>• Protect pricing power<br>• Test premium offerings |
| 60% – 80% | Strong – You’re highly efficient. Service businesses and software companies often hit this range. | • Maintain quality standards<br>• Watch for competitors<br>• Consider strategic investments |
| Above 80% | Exceptional – You operate a high-value or low-cost model. Tech and financial services companies reach these levels. | • Protect your market position<br>• Plan for competition<br>• Scale carefully |
Gross Margin Benchmarks by Industry
Gross margins vary widely by industry. A 20% margin crushes it in grocery retail but signals trouble for a software company. Here’s what to expect in your sector.
| Industry | Typical Range | Why It Varies |
| Software / SaaS | 75% – 90% | Low delivery costs, high scalability, minimal COGS |
| Financial Services | 80% – 100% | Service-based model with minimal direct costs |
| Professional Services | 50% – 70% | Labor-intensive but no physical goods to produce |
| Retail (General) | 30% – 55% | Inventory costs, competitive pricing, thin margins |
| Manufacturing | 25% – 40% | Raw materials, labor, and production overhead |
| Healthcare Services | 30% – 50% | Labor costs and medical supplies eat into margins |
| Construction | 15% – 30% | Materials, subcontractors, and project-based costs |
| Food & Grocery | 20% – 35% | Perishable inventory, high competition, low pricing power |
Source data shows banks (money center) hit near-100% gross margins because they leverage deposits with minimal direct costs. At the other end, auto manufacturers struggle to reach 15% due to steel, parts, and assembly line expenses.
Service businesses like consulting or software enjoy higher margins because they don’t buy raw materials. They sell knowledge and access, which costs little to replicate. Manufacturing and retail businesses buy physical goods, which directly cuts into their margins.
Your company’s size also matters. Larger firms negotiate better supplier rates and spread fixed costs over more units. Smaller companies often pay more for materials and labor, which squeezes margins.
Benchmark Citations
NYU Stern: Industry Margins by Sector
Vena Solutions: Average Profit Margins by Industry 2025
FullRatio: Profit Margin Benchmarks Across Industries
Automating Gross Margin Tracking with Coefficient
Stop copying data from NetSuite or QuickBooks into spreadsheets every month.
Coefficient connects your accounting system straight to Excel or Google Sheets. Your revenue and COGS update automatically. Your gross margin calculates itself.
Set it up once and your numbers refresh on your schedule. Daily, weekly, monthly—you choose. Finance teams save 2-3 hours per reporting cycle. Fractional CFOs track multiple clients without switching between systems.
Real-time data means you catch margin drops before they become problems.
Get started with Coefficient and download your free template.
How to Improve Your Gross Margin
Thin margins squeeze your cash flow and limit your growth options. Here are five ways to boost your numbers.
Raise your prices strategically
Most companies undercharge. Test a 5-10% price increase on your best customers or highest-value products. Track what happens to volume. Often, you’ll lose few customers but gain significant margin.
Run the math: A 5% price increase with no volume drop flows straight to gross profit. A company with $1M revenue and 40% gross margin goes from $400K to $450K gross profit—a 12.5% improvement.
Cut your direct costs
Negotiate with suppliers annually. Ask for volume discounts or longer payment terms. Switch to cheaper materials that don’t hurt quality. Automate production steps that currently need manual labor.
A 10% reduction in COGS delivers immediate margin gains. For our furniture company spending $325K on COGS, a 10% cut saves $32,500 and pushes gross margin from 35% to 41.5%.
Drop low-margin products
Not every product deserves shelf space. Calculate gross margin by product line. Kill anything below your target margin unless it drives strategic value. Focus your team on what makes money.
Improve your product mix
Push customers toward higher-margin items. Train sales teams to upsell premium versions. Adjust your website to highlight profitable products. Small shifts in mix create big margin gains.
Track margin by customer
Large customers often demand discounts that destroy your margins. Calculate profitability by account. Renegotiate contracts with low-margin clients or let them walk. Replace them with better customers.
Gross Margin vs. Contribution Margin vs. Operating Margin
These three margins measure different things. Knowing which to use helps you make better decisions.
Gross Margin
Formula: (Revenue – COGS) / Revenue
This shows profit after direct production costs. Use it to judge your core business efficiency and compare yourself to competitors.
Contribution Margin
Formula: (Revenue – Variable Costs) / Revenue
This includes all variable costs, not just COGS. It helps you see which products or customers contribute most to covering fixed costs. Use it for pricing decisions and product mix planning.
Operating Margin
Formula: (Revenue – COGS – Operating Expenses) / Revenue
This adds in salaries, rent, marketing, and admin costs. It shows your overall profitability before interest and taxes. Use it to measure total business performance.
When to use each
Each margin answers a different question. Gross margin asks: Can we make money selling this? Contribution margin asks: Which products pay for fixed costs? Operating margin asks: Is the whole business profitable?
Pro tip for fractional CFOs: Present all three margins to clients with context. Say something like: “Your gross margin of 45% looks healthy, but your operating margin of 8% shows operating expenses are too high relative to revenue. We need to tackle overhead costs while protecting gross profit.”
Make better decisions
Your gross margin tells the story of your core business. Track it monthly. Compare it to industry benchmarks. Use it to guide pricing and cost decisions.
Get started with Coefficient and automate your margin tracking today.
 Sync Live Finance Data into Your Spreadsheet


