


Cost of Capital Formula Explained
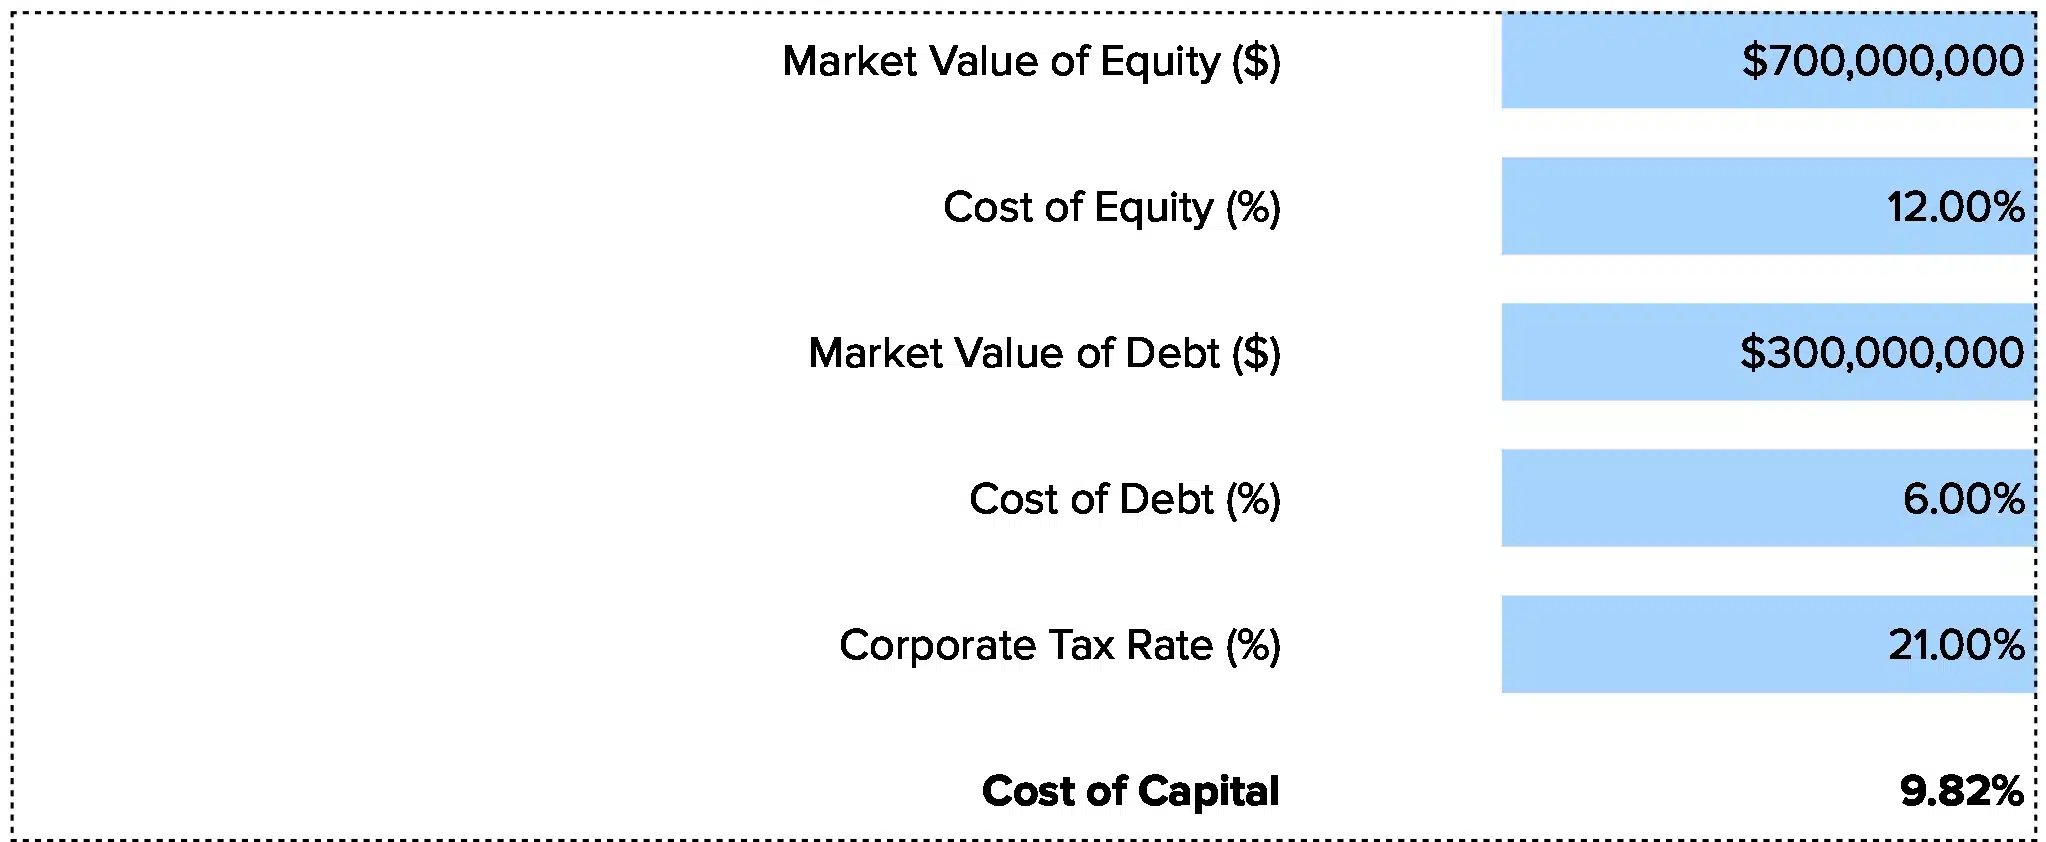
Cost of Capital (WACC) = (E/V × Re) + (D/V × Rd × (1-T))
Let’s break down each part:
E/V: This is your equity weight. E stands for the market value of your equity. V is total firm value (equity plus debt). If equity makes up 60% of your funding, this number is 0.60.
Re: Cost of equity. This is what your owners expect to earn. Most firms use CAPM to find this rate, which looks at risk-free rates plus a risk premium tied to your stock’s beta.
D/V: Your debt weight. D is the market value of your debt. V is still total value. If debt is 40% of your capital mix, this is 0.40.
Rd: Cost of debt. This is the rate you pay on loans and bonds. Look at your current loan rates or bond yields.
T: Your tax rate. Debt has a tax shield since you deduct interest. If you pay 25% in taxes, T = 0.25. The (1-T) part means you only pay the net cost after the tax break.
The formula weighs your equity cost and your after-tax debt cost based on how much of each you use.
What Is Cost of Capital?
Cost of capital is the rate of return your firm must earn on projects to keep your investors happy. It’s the hurdle rate for all your funding. If a project returns less than this rate, it kills value.
Think of it as the price tag on your money. You pay equity holders through growth and dividends. You pay lenders through interest. The weighted average of these costs is your cost of capital. It tells you the minimum return you need to break even on investor expectations.
Who uses this metric?
CFOs who set hurdle rates for capital allocation and decide which projects to fund.
Fractional CFOs who advise multiple clients on investment decisions and capital structure.
Finance teams building valuation models and DCF analyses to value the business.
FP&A analysts who forecast returns and compare projects against the cost of funding.
Investment bankers pricing deals and building financial models for M&A deals.
How to Calculate Cost of Capital: Step-by-Step
Let’s walk through a real example using a mid-sized software firm.
- Find your market value of equity
Look up your stock price and multiply by shares out. For private firms, use your most recent valuation. Our example: $10 million in equity value.
- Find your market value of debt
Add up all loans, bonds, and credit lines at current market rates. Book value works if rates haven’t moved much. Our example: $4 million in debt.
- Calculate total firm value
Add equity and debt together.
$10 million + $4 million = $14 million total value (V)
- Figure out your weights
Equity weight: $10M ÷ $14M = 0.714 or 71.4%
Debt weight: $4M ÷ $14M = 0.286 or 28.6%
- Determine cost of equity
Use CAPM: Re = Risk-free rate + Beta × Market risk premium
With a 4% risk-free rate, beta of 1.2, and 6% market premium:
Re = 4% + (1.2 × 6%) = 11.2%
- Get your cost of debt and tax rate
Your loan rate is 6%. Your tax rate is 25%.
After-tax cost: 6% × (1 – 0.25) = 4.5%
- Apply the formula and interpret
WACC = (0.714 × 11.2%) + (0.286 × 4.5%)
WACC = 8.0% + 1.3% = 9.3%
This 9.3% means any project must return at least 9.3% to create value. Projects with lower returns destroy value. Projects above this rate add value for your investors.
How to Interpret Your Cost of Capital Number
Your WACC reveals funding efficiency and sets investment hurdles.
| Range | Interpretation | Recommended Actions |
| Below 6% | Very low cost – Strong balance sheet and low risk. You likely have stable cash flow and strong credit. | • Consider growth investments<br>• May have room for more debt<br>• Watch for unused capital<br>• Review if equity is too cheap |
| 6% – 9% | Moderate cost – Healthy range for most stable firms. Mix of debt and equity at normal rates. | • Good position for steady growth<br>• Keep capital structure balanced<br>• Review projects against this hurdle<br>• Monitor for rate changes |
| 9% – 12% | Elevated cost – Higher risk or growth stage firm. Equity investors expect strong returns. | • Focus on high-return projects only<br>• Review debt levels and rates<br>• Consider refinancing expensive debt<br>• Track beta and market risk |
| 12% – 15% | High cost – Big risk factors. Growth stage or distressed. Limited low-cost capital access. | • Prioritize cash-positive projects<br>• Reduce expensive debt first<br>• Improve credit profile<br>• May need capital restructuring |
| Above 15% | Very high cost – Crisis mode or extreme growth risk. Early stage startup or financial distress. | • Immediate action required<br>• Focus on survival and cash flow<br>• Seek strategic investors<br>• Consider asset sales or restructuring |
Cost of Capital Benchmarks by Industry
Your cost of capital makes more sense when you compare it to peers. Here’s what firms pay across sectors based on January 2025 data.
| Industry | Typical Range | Notes |
| Software (SaaS/Applications) | 9.5% – 11.0% | High equity cost due to growth expectations and volatility, minimal debt |
| Retail (General) | 8.5% – 11.0% | Varies widely; grocery (6%) much lower than building supply (11%) |
| Healthcare Services | 7.5% – 9.5% | Pharma and biotech at higher end due to R&D risk, support services lower |
| Manufacturing | 8.0% – 9.5% | Capital-intensive with moderate debt, varies by specialty vs commodity |
| Financial Services | 5.5% – 6.5% | Lowest cost due to business model built on debt, highly regulated |
| Construction | 8.0% – 10.0% | Project risk and cycles drive higher equity costs, varies by type |
| Professional Services | 8.5% – 10.0% | Low asset base but human capital risk, limited debt capacity |
These ranges come from analyzing thousands of public firms. Your cost depends on size, debt mix, and risk within your sector.
Why do these vary? Software firms rely more on equity and face high growth risk. Banks use lots of cheap debt and have stable cash flows. Retail sits in the middle with moderate debt and steady but tough markets.
Benchmark Citations
NYU Stern Cost of Capital by Sector (Damodaran)
KPMG Cost of Capital Study 2024
Phoenix Strategy Group Industry Benchmarks 2025
Automating Cost of Capital Tracking with Coefficient
Stop pulling data from NetSuite, your bank, and cap table into Excel every quarter. Coefficient links your finance systems straight to your spreadsheet. Your cost of capital model updates itself with live debt balances, cash positions, and market data.
Set it once and let the data flow. Your team saves hours each quarter and cuts out copy-paste errors. Perfect for finance teams tracking multiple entities or fractional CFOs managing several client portfolios.
Get started with Coefficient to automate your WACC tracking.
How to Improve Your Cost of Capital
A high cost of capital limits growth. Here are five ways to bring it down.
Optimize your debt-to-equity mix
Too much debt raises default risk and credit costs. Too much equity dilutes and raises the blended cost. Model different capital structures to find the sweet spot. Most firms do best at 30-50% debt.
Refinance expensive debt
If you’re paying 8% on old loans and rates are now 6%, refinance. Even a 1% drop on $5 million in debt saves $50K per year and cuts your WACC by 0.1-0.2 points.
Improve your credit profile
Better credit scores and ratios get you lower rates. Pay down high-rate debt first, keep strong cash reserves, and maintain good ratios. This directly cuts your cost of debt.
Reduce business risk to lower equity cost
Equity investors charge more for volatility. Diversify revenue streams, lock in long-term contracts, and improve margins. Lower beta means lower equity cost in CAPM.
Communicate value to reduce risk perception
Market your story to investors and lenders. Show stable cash flow, growth plans, and risk controls. Better information reduces perceived risk and lowers the rates you pay.
Cost of Capital vs. Cost of Equity vs. Cost of Debt vs. Required Return
These terms get mixed up all the time. Here’s what each one means and when to use it.
Cost of Capital (WACC)
Blended rate you pay for all funding combined. It weights your equity cost and your after-tax debt cost by their shares in your capital structure. Use this as the discount rate in DCF models and the hurdle rate for project decisions. Typical range: 6% – 12%.
Cost of Equity
What shareholders expect to earn. It reflects risk-free rates plus the risk premium for owning your stock. Calculate it with CAPM using your beta. This is always higher than debt cost because equity holders take more risk. Typical range: 8% – 15%.
Cost of Debt
Interest rate on your borrowings before and after tax. The after-tax version matters most because you deduct interest. This is typically your lowest cost of capital since debt is less risky and you get a tax shield. Typical range: 3% – 8%.
Required Return
Can mean different things. Sometimes it refers to the minimum return a specific investor demands. Other times it’s the same as cost of capital. Always clarify which rate you’re discussing.
When to use each
Use cost of capital for firm-wide decisions. Use cost of equity for equity valuation. Use cost of debt for debt decisions and tax benefits.
Pro tip for fractional CFOs: Present all three metrics to clients with context. For example: “Your cost of equity is 12%, but your cost of debt is only 5% after tax. Your blended WACC of 9.2% reflects your 60/40 equity-to-debt mix. Adding more debt could lower your WACC to 8.5%, but watch your debt ratios.”
Know your hurdle rate
Track your cost of capital quarterly. Use it to evaluate every investment decision. Projects that beat your WACC create value. Projects below it destroy it.
Get started with Coefficient to automate your cost of capital tracking and make better capital allocation decisions.
 Sync Live Finance Data into Your Spreadsheet


