


Bookings vs Billings Ratio Formula Explained
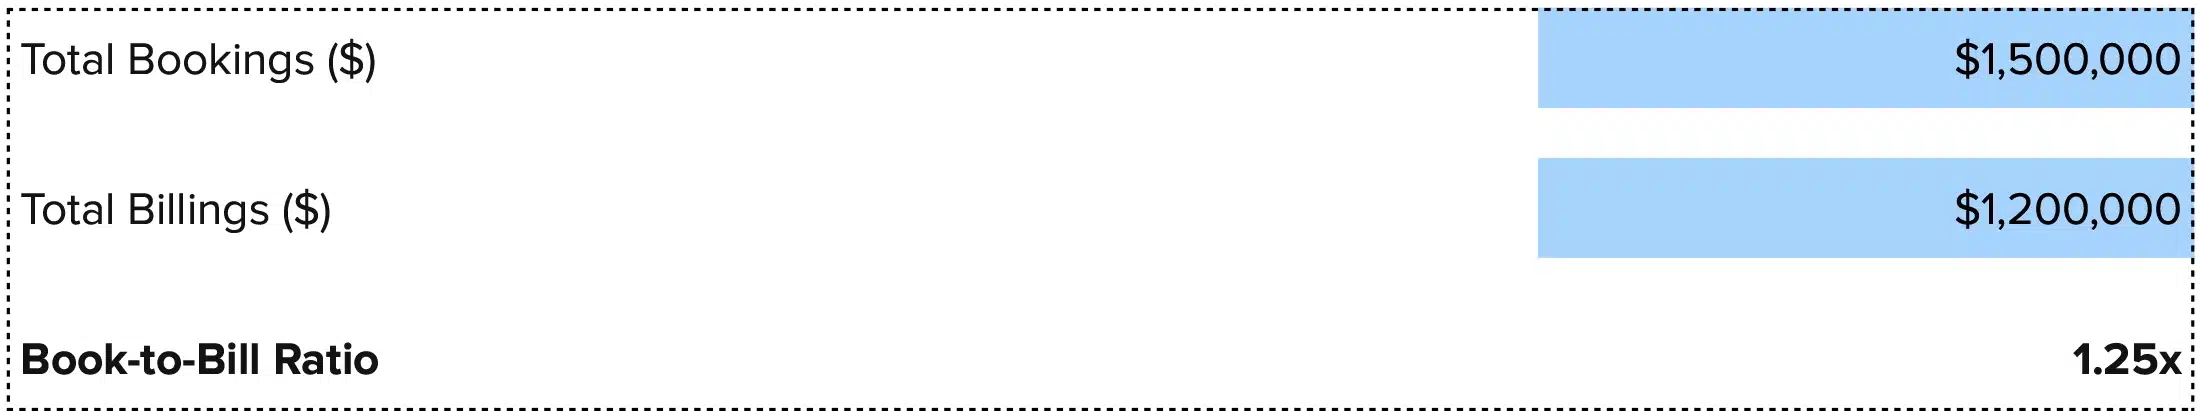
Bookings vs Billings Ratio = Total Bookings ÷ Total Billings
Bookings show the total value of all new contracts signed in a period. You record the full contract value when it’s signed, not when you get paid. A customer signs a 3-year deal worth $120,000. You record $120,000 in bookings right away, even though you won’t collect the cash for three years.
Billings are the actual invoices sent to customers in the same period. This is what you’re asking customers to pay now, based on contract terms. With that same $120,000 deal, if you bill each quarter, your first bill is $10,000 ($120,000 ÷ 12 quarters).
The ratio tells you if you’re signing new work faster than you’re billing current work. Above 1.0 means bookings beat billings—you’re growing. Below 1.0 means billings beat bookings—your pipeline needs help.
What Is Bookings vs Billings?
The bookings vs billings ratio measures sales momentum against current revenue flow. Think of bookings as future revenue and billings as near-term cash.
This metric matters most for firms with multi-month or multi-year contracts. SaaS companies, consulting firms, and subscription businesses use it to predict revenue 3-12 months out.
Who uses this metric?
CFOs and Controllers track it each month to forecast revenue and plan spending based on pipeline strength.
Fractional CFOs watch it across client portfolios to spot which firms need sales help versus which ones need to scale operations.
Sales Leaders use it to prove their team’s impact on future revenue, not just this quarter’s numbers.
Finance Analysts build models with it to project cash needs and growth rates for board meetings.
Revenue Operations Teams pair it with churn and expansion data to predict net new ARR.
How to Calculate Bookings vs Billings: Step-by-Step
Let’s work through a real example.
- Pick your time period
Use one month or one quarter. We’ll use March 2025.
- Add up all new contracts signed
Your sales team closed these deals in March:
- Client A: $36,000 annual contract
- Client B: $24,000 annual contract
- Client C: $60,000 two-year contract
Total bookings = $120,000
- Calculate total invoices sent
In March, you billed existing customers:
- Monthly subscriptions: $45,000
- Quarterly invoices: $25,000
- Setup fees: $8,000
Total billings = $78,000
- Divide bookings by billings
$120,000 ÷ $78,000 = 1.54
- Read your result
A ratio of 1.54 signals strong growth. You’re signing new work 54% faster than you’re billing current customers. Your revenue should grow a lot over the next 6-12 months, if you keep existing customers and deliver on new contracts.
How to Interpret Your Bookings vs Billings Number
| Ratio Range | Interpretation | Recommended Actions |
| Below 0.9 | Declining demand – Sales aren’t replacing current revenue. Big problems ahead. | • Launch targeted sales campaigns now<br>• Review pricing and market position<br>• Audit lost deals to find patterns<br>• Look at new markets or customer types |
| 0.9 – 1.0 | Flat growth – Treading water. New bookings barely match billings. No growth. | • Boost marketing spend on proven channels<br>• Review sales team capacity and skills<br>• Test new pricing or bundles<br>• Focus on upselling current customers |
| 1.0 – 1.2 | Healthy baseline – Modest growth ahead. Replacing revenue plus adding some new business. | • Keep current sales and marketing efforts<br>• Document what works for future scaling<br>• Watch customer retention closely<br>• Model scenarios for 2x growth |
| 1.2 – 1.5 | Strong momentum – Big growth coming. Sales engine running well. | • Plan for scaling operations<br>• Hire ahead of demand in key roles<br>• Lock in payment terms that help cash flow<br>• Build systems for 50% larger scale |
| Above 1.5 | Rapid expansion – Great signal, but make sure you can deliver on these contracts. | • Check delivery capacity right away<br>• Get working capital for scaling<br>• Hire fast in bottleneck areas<br>• Watch for quality drops from fast growth |
Context matters. A SaaS firm closing annual deals in Q4 might hit 2.0+ ratios, then drop to 0.8 in Q1. Track trends over 3-6 months, not single months.
Bookings vs Billings Benchmarks by Industry
Your target ratio depends on your business model.
| Industry | Typical Range | Notes |
| SaaS / Cloud Software | 1.2 – 2.0 | Annual contracts with monthly billing create high ratios naturally |
| Professional Services | 1.1 – 1.3 | Project work with retainers, steady ratio means healthy pipeline |
| IT Services / MSPs | 1.0 – 1.3 | Mix of recurring and project revenue, monthly billing lowers ratios |
| Manufacturing (custom) | 0.9 – 1.2 | Long production times, deposits affect timing, seasonal orders |
| Consulting Firms | 1.1 – 1.4 | Retainer model smooths ratios, high end shows account expansion |
| Technology Hardware | 0.95 – 1.15 | Shorter sales cycles, closer to 1:1 from faster fulfillment |
SaaS companies often see the highest ratios. They sign annual or multi-year deals but bill monthly or quarterly. A $120,000 annual contract creates $120,000 in bookings now but only $10,000 in first-month billings—a 12:1 spike for that deal.
Professional services firms target 1.1-1.3 ratios. Ruddr’s 2024 benchmark report notes that growth-focused firms should stay between 1.15-1.25. Below 1.0 means they’ll run out of work in 2-3 months.
Manufacturing firms with made-to-order products see lower ratios. They often take deposits upfront (raising billings right away) and have long production times. Seasonal ordering can swing ratios from 1.5 in peak months to 0.7 in slow ones.
Benchmark Citations
Wall Street Prep – Bookings vs Billings SaaS Guide
Investopedia – Book-to-Bill Ratio Definition
Ruddr – Professional Services Benchmarks
Automating Bookings vs Billings Tracking with Coefficient
Stop pulling CSVs from your CRM and accounting system each month. Coefficient connects Salesforce, HubSpot, NetSuite, or QuickBooks straight to your Excel or Google Sheets. Your bookings and billings data flows on its own.
Build one live dashboard that updates itself. Track new contract values from your CRM next to invoice data from your accounting system, all in one spreadsheet. Set up monthly refreshes and get alerts when your ratio drops below target.
Get started with Coefficient and automate your bookings vs billings tracking.
How to Improve Your Bookings vs Billings Ratio
Shorten your sales cycle
Close deals faster and you generate more bookings per period. Map your current sales process. Find the longest steps. If deals stall at legal review, create pre-approved contract templates. If prospects go dark after demos, send proposals same-day. Cut 15 days from a 60-day cycle and you boost bookings capacity by 25%.
Shift to annual billing
Monthly contracts create lower bookings numbers. A customer paying $1,000/month for a year might renew or might not—so you can only count a few months. Annual prepay locks in $12,000 right away. Offer 10-15% off for annual payment. Customers save money and your bookings jump.
Raise average contract value
Target larger customers or add premium tiers. Moving your average deal from $24,000 to $36,000 means hitting the same bookings with 33% fewer deals. Less sales work, same bookings growth. Bundle multiple products. Add services. Raise prices on high-value features.
Expand into existing accounts
Current customers buy 60-70% faster than new prospects. Build expansion playbooks. If a customer uses Product A well, pitch Product B. Track usage data to find expansion triggers. Land-and-expand can double bookings without adding sales staff.
Build a multi-quarter pipeline
Don’t just track this month’s deals. Keep tabs on the next 90-180 days. When your ratio dips below 1.0, you’ll see it coming and have time to fix it. Weekly pipeline reviews catch early signs before they become revenue problems.
Bookings vs Billings vs Revenue vs ARR
These four metrics track different stages of your financial journey.
| Metric | What It Measures | Best Used For | Key Difference |
| Bookings | Total contract value signed | Sales performance, future revenue | Counts full contract value right away |
| Billings | Invoices sent to customers | Cash flow forecasting, near-term revenue | What you’re asking customers to pay this period |
| Revenue | Earned income per GAAP | Financial statements, tax reporting | Only counts delivered services, recognized over time |
| ARR | Annualized recurring revenue | SaaS growth tracking, valuation | Normalized annual run rate, excludes one-time fees |
Bookings happen first—when a contract is signed. A 2-year $200,000 deal creates $200,000 in bookings on day one.
Billings follow your payment terms. That $200,000 deal might bill $25,000 per quarter, creating $50,000 in billings during the first six months.
Revenue recognizes as you deliver. Under GAAP, you can’t claim revenue until you provide the service. So you’d recognize about $8,333/month ($100,000/year ÷ 12) as revenue.
ARR shows your run rate. If you have $2 million in annual contracts active today, your ARR is $2 million—no matter what bookings, billings, or GAAP revenue say.
Pro tip for fractional CFOs: Show clients all four metrics at once. When bookings spike but revenue stays flat, explain the timing lag. When billings beat bookings for three months straight, flag the pipeline problem early. This stops the “we had a great sales quarter, why is revenue flat?” confusion.
Track your sales momentum
Bookings vs billings shows if your pipeline is growing or shrinking. Above 1.0 means growth ahead. Below 1.0 means trouble coming. Track it monthly. Watch for trends over quarters.
When the ratio drops, fix your sales process before revenue drops six months later.
Get started with Coefficient and build dashboards that show bookings, billings, and revenue all in one place.
 Sync Live Finance Data into Your Spreadsheet


