


Accumulated Depreciation Ratio = Total Accumulated Depreciation / Total Fixed Assets (Excluding Land)
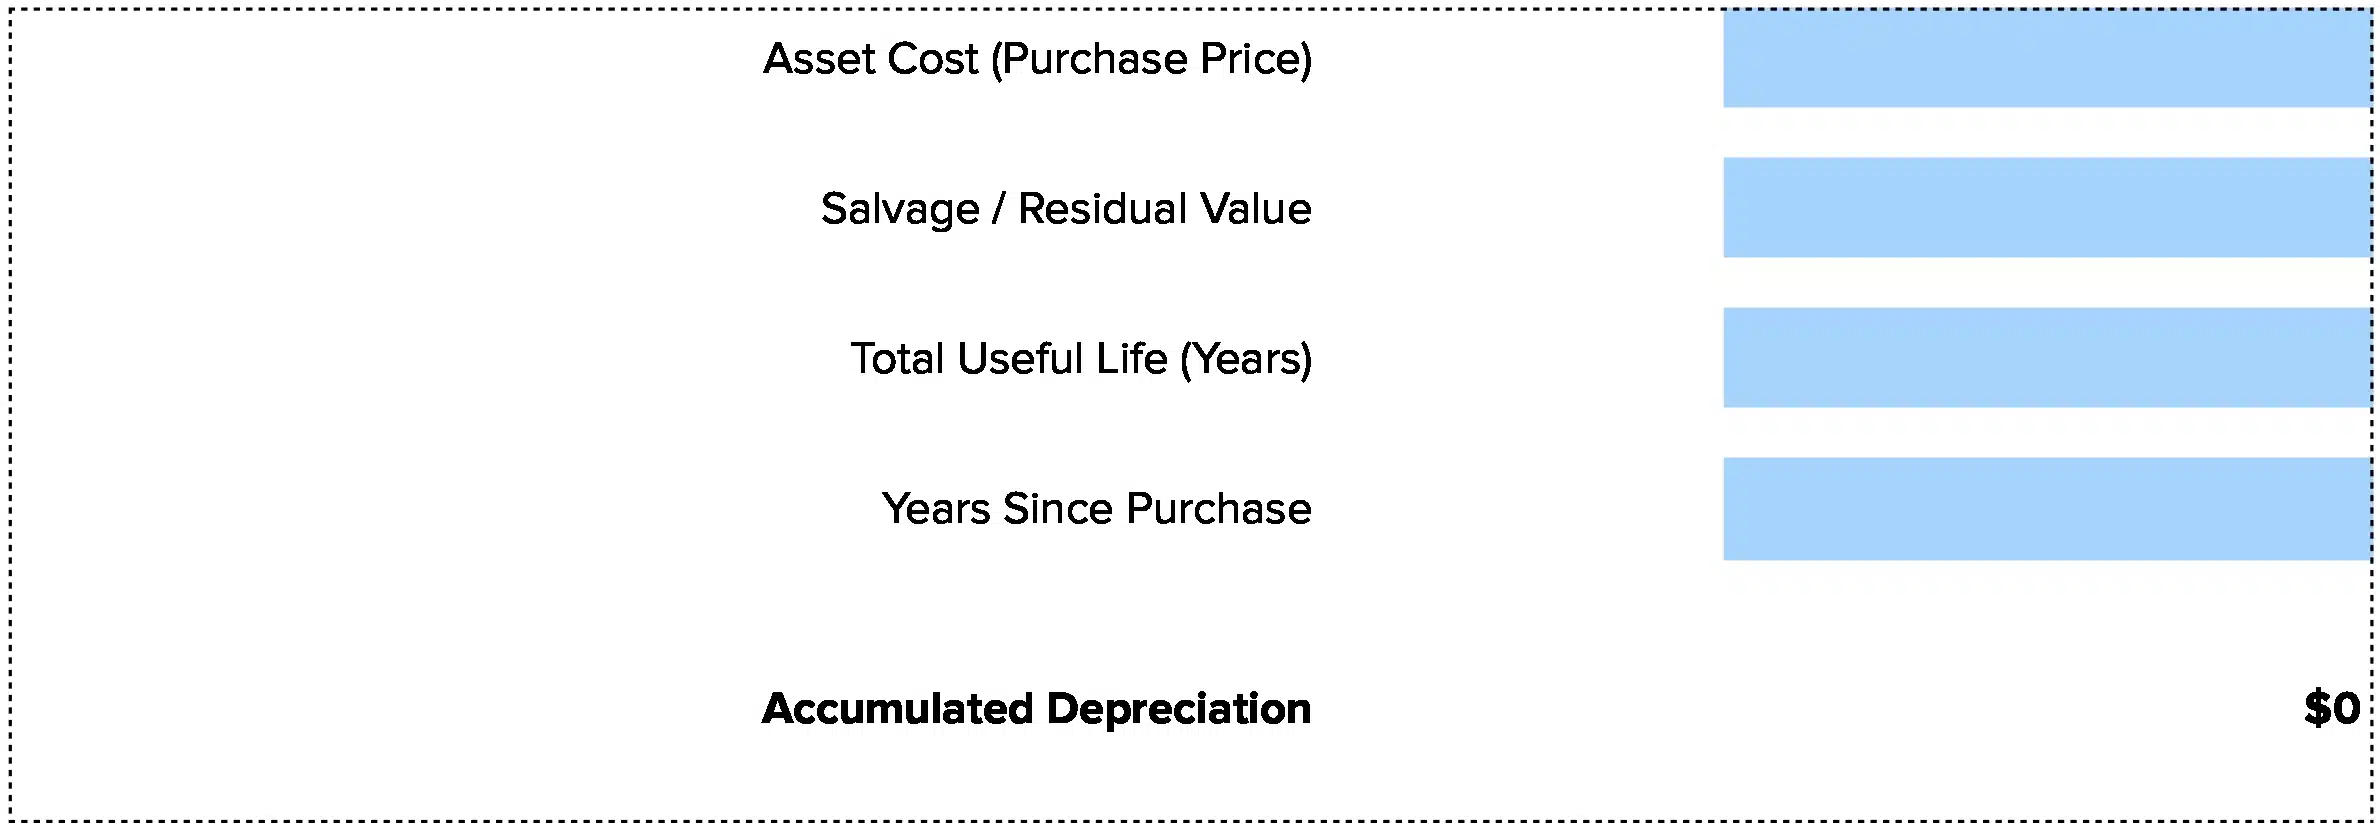
This free accumulated depreciation calculator shows you how worn your assets are. Track fixed asset age, plan for replacements, and report asset values with confidence. We’ve also included a free Excel and Google Sheets template you can download and use right away.
Stop guessing when to replace equipment.
Accumulated Depreciation Formula Explained
Accumulated Depreciation Ratio = Total Accumulated Depreciation / Total Fixed Assets (Excluding Land)
Let’s break down each part:
Total Accumulated Depreciation: The sum of all depreciation expenses recorded since you bought each asset. This includes every year of wear and tear you’ve booked on your income statement. Over time, this number grows as assets age and lose value.
Total Fixed Assets: The original purchase price of all physical assets on your books. This includes equipment, vehicles, buildings, and furniture. We exclude land because it doesn’t wear out or lose value over time.
The ratio shows what percent of your assets’ original cost has been used up. A 40% ratio means your assets are 40% through their useful life. This helps you plan when to buy new equipment and shows lenders how fresh or worn your asset base is.
What Is Accumulated Depreciation?
Accumulated depreciation measures how much of your fixed assets’ value has been used up over time. It’s a contra asset account that reduces the carrying value of equipment, vehicles, and buildings on your balance sheet.
Think of it as a running total. Each year, you record depreciation expense for wear and tear. Accumulated depreciation adds up all those yearly charges from the day you bought each asset until now. The result tells you how “old” your assets are and how much useful life remains.
Who uses this metric?
CFOs and Controllers track asset age to plan capital expenditures and replacement cycles.
Fractional CFOs monitor accumulated depreciation ratios across multiple client portfolios to spot aging equipment.
Lenders and Credit Analysts review this ratio to assess whether a company needs major capital investments soon.
Asset Managers use it to forecast when facilities and equipment will need replacement.
Tax Accountants calculate it to ensure depreciation schedules match IRS guidelines.
How to Calculate Accumulated Depreciation: Step-by-Step
Let’s walk through calculating your accumulated depreciation ratio with a real example:
- Pull your fixed asset list
Get your most recent balance sheet or fixed asset register. You need the original cost of all fixed assets and the total accumulated depreciation.
- Identify total accumulated depreciation
From your balance sheet, find “Accumulated Depreciation.” This is usually shown as a contra asset directly under Property, Plant & Equipment. For our example: $320,000
- Find gross fixed assets
Look for “Property, Plant & Equipment” or “Fixed Assets at Cost.” This shows original purchase prices before any depreciation. In our example: $800,000
- Exclude land from fixed assets
Land doesn’t depreciate. If your fixed assets include land worth $50,000, subtract it: $800,000 – $50,000 = $750,000 in depreciable assets
- Calculate the ratio
Divide accumulated depreciation by depreciable fixed assets:
$320,000 ÷ $750,000 = 0.427 or 42.7%
- Interpret your result
A ratio of 42.7% means your assets are roughly 43% through their useful life. If most assets have 10-year lives, they’re about 4-5 years old on average. You’re past midpoint but not yet at critical replacement age.
How to Interpret Your Accumulated Depreciation Ratio
Your ratio reveals asset age and replacement urgency.
| Ratio Range | Interpretation | Recommended Actions |
| Below 20% | New asset base – Assets purchased recently with most useful life ahead | • Monitor depreciation methods for accuracy<br>• Plan long-term capital budgets<br>• Document asset purchase dates and costs |
| 20% – 40% | Young to mid-life assets – Assets have significant useful life remaining | • Begin forecasting replacement timelines<br>• Track asset performance and maintenance costs<br>• Update capital expenditure plans |
| 40% – 60% | Mid-life assets – Assets approaching second half of useful life | • Evaluate repair vs. replace decisions<br>• Budget for replacements in 2-3 years<br>• Consider trade-in values for equipment |
| 60% – 75% | Aging asset base – Assets nearing end of useful life, replacement needed soon | • Accelerate replacement planning<br>• Secure financing for capital investments<br>• Assess impact on productivity and safety |
| Above 75% | Elderly assets – Critical need for investment, high maintenance likely | • Prioritize immediate replacement<br>• Investigate maintenance cost spikes<br>• Consider leasing vs. buying decisions |
Accumulated Depreciation Benchmarks by Industry
Asset intensity and replacement cycles vary widely by industry. Capital-heavy sectors like manufacturing show higher ratios, while service businesses with fewer fixed assets trend lower.
| Industry | Typical Range | Notes |
| Software / SaaS | 15% – 35% | Minimal fixed assets, mostly computers and office equipment with 3-5 year lives |
| Professional Services | 20% – 40% | Low asset base, primarily office furniture and technology |
| Retail | 30% – 50% | Store fixtures, POS systems, and leasehold improvements depreciate over 5-10 years |
| Manufacturing | 40% – 65% | Heavy machinery and equipment with 10-20 year lives, higher ratios indicate aging plants |
| Transportation / Logistics | 45% – 70% | Vehicle fleets depreciate over 5-12 years, ratio shows fleet age |
| Hospitality | 35% – 55% | Buildings, furniture, and kitchen equipment with varied useful lives |
| Healthcare | 40% – 60% | Medical equipment and facilities, technology refreshes every 5-7 years |
| Construction | 50% – 75% | Heavy equipment experiences wear, high ratios common due to hard use |
Industries with higher ratios aren’t necessarily in trouble. Construction equipment takes a beating, so 60% ratios are normal. Software companies with 25% ratios might simply lease most assets. Context matters.
Capital-intensive industries like manufacturing and transportation naturally show higher ratios because they own expensive, long-lived assets. Service industries with fewer physical assets typically have lower ratios. Compare your ratio to companies in your exact industry and of similar size.
Benchmark Citations
U.S. Bureau of Economic Analysis – Fixed Assets
Profit.co – Accumulated Depreciation Ratio Explained
Study Finance – Accumulated Depreciation to Fixed Assets Ratio
Automating Accumulated Depreciation Tracking with Coefficient
Stop exporting fixed asset reports from NetSuite or Sage Intacct every month. Coefficient connects your accounting system directly to Excel or Google Sheets, pulling accumulated depreciation and fixed asset balances automatically.
Your ratio updates itself from live data. Set up once, and Coefficient refreshes your depreciation dashboard daily or weekly. Perfect for fractional CFOs tracking multiple clients or controllers preparing board reports. Save 20-30 minutes per entity, every month.
Get started with Coefficient to automate your depreciation tracking.
How to Improve Your Accumulated Depreciation Ratio
A high ratio signals opportunity. Here are five proven ways to lower your ratio and modernize your asset base:
Accelerate capital expenditures
Purchase new equipment to replace fully depreciated assets. New assets boost your gross fixed asset base while accumulated depreciation stays flat initially. This immediately lowers your ratio by 10-20 percentage points for significant purchases.
Dispose of fully depreciated assets
Write off old equipment that’s 100% depreciated but still on your books. This reduces both accumulated depreciation and gross assets proportionally, but often improves your ratio if you’re holding onto too many obsolete items.
Perform physical asset audits
Verify that your fixed asset register matches what’s actually in use. Remove assets that were scrapped, sold, or stolen but never written off. This cleanup can lower your ratio by 5-15 points in companies with poor asset tracking.
Review depreciation methods and useful lives
If you’re using overly aggressive depreciation (like double-declining balance when straight-line fits better), you’re booking too much depreciation too fast. Consult your CPA about whether useful lives and methods still match actual asset use. Adjustments require careful documentation and may need audit approval.
Lease instead of buy
For assets you replace frequently, consider operating leases. Leased assets don’t appear on your balance sheet under many arrangements, so they don’t affect your accumulated depreciation ratio. This works well for vehicle fleets and technology that refreshes every 3-5 years.
Accumulated Depreciation vs. Depreciation Expense vs. Net Book Value
These three terms all relate to fixed assets, but they measure different things. Here’s how to tell them apart:
Accumulated Depreciation
Sum of all depreciation expense since purchase. Shows total wear and tear over entire ownership period. Best for assessing asset age, planning replacements, and calculating ratios.
Depreciation Expense
(Cost – Salvage Value) ÷ Useful Life. This year’s charge for asset wear. Best for income statement analysis and tax planning.
Net Book Value
Cost – Accumulated Depreciation. Current carrying value on balance sheet. Best for financial reporting and loan collateral valuations.
When to use each
Depreciation expense is an annual flow. You record it each year on your income statement. Accumulated depreciation is a cumulative stock. It grows larger every year as you add more expense.
Net book value tells you what an asset is worth on your books right now. It starts at purchase price and decreases as accumulated depreciation grows. When accumulated depreciation equals original cost, net book value hits zero.
Pro tip for fractional CFOs: When a client’s accumulated depreciation ratio exceeds 65%, run a detailed fixed asset report. Break it down by asset category. Often, one segment (like vehicles or machinery) is driving the high ratio while other assets remain fresh. This lets you target capital spending where it’s needed most and avoid blanket replacement recommendations.
Plan your replacements
Track your accumulated depreciation ratio quarterly. Use it to forecast capital needs and avoid surprise equipment failures.Get started with Coefficient to automate your asset tracking and stop manual exports.
 Sync Live Finance Data into Your Spreadsheet


