


Table of Contents
![]()
- 1. How to Build a Sales Pipeline with Advanced Workflows – Tips for RevOps Teams
- 2. Best Practices for Sales Pipeline Management – Tips from RevOps Leaders
- 3. How to Increase Sales Velocity with Automations & AI
- 4. Top 10 Tips to Grow your Sales Pipeline in the AI Era from Sales Leaders
-
5. How to Build and Manage a SaaS Sales Pipeline
- How to Build a SaaS Sales Pipeline from Scratch
- Tips to Manage and Maintain a Healthy SaaS Pipeline
- How AI Can Support SaaS Pipeline Management
- Limitations of Traditional CRM-Based Pipeline Management
- Pipeline Metrics to Monitor
- Collaboration and Monitoring Made Easy with Coefficient
- Conclusion
- FAQs
- 6. Sales Pipeline Stages in Salesforce: Guide for RevOps Teams
- 7. Sales Pipeline Stages in HubSpot: Setup, Best Practices & Templates
- 8. Sales Pipeline vs Sales Funnel: What’s the Difference?


A SaaS sales pipeline can boost your company’s growth rate by 15%. Harvard Business Review reports an 18% difference in revenue growth between companies that have a well-laid-out process and those that don’t.
Companies that used structured sales pipeline management grew 28% more than others. A proper sales pipeline will give each lead the attention it needs. Your sales teams can close deals faster and optimize their operations. You might wonder what a pipeline in sales really is. Picture it as a visual map of your sales process that tracks prospects from your first contact until you close the deal.
Building and managing an effective pipeline can be tough. Sales representatives get caught up in daily tasks and often overlook leads in later pipeline stages. The right approach to building a sales pipeline can reshape your revenue generation process.
This piece walks you through practical steps to create and maintain saas sales pipeline stages that deliver results. Tools like Coefficient for CRM integration and spreadsheet automation help you build a flexible system. Your team stays organized, and deals keep moving forward.
How to Build a SaaS Sales Pipeline from Scratch
A solid saas sales pipeline needs good planning and a clear structure. Companies with a well-laid-out sales process see 18% more revenue growth than others.
The sales pipeline shows how potential customers move from first contact to final purchase. In SaaS, the pipeline isn’t just about closing a deal. It’s about tracking long-term revenue potential, like subscriptions, renewals, and upgrades.
A sales pipeline shows the steps a potential customer takes from first contact to closing. But in SaaS, those steps often don’t follow an obvious pattern. Conversations can stretch for months, go quiet, then restart. Buyers can ask for trials, bring in more stakeholders, or opt out unexpectedly.
In B2B SaaS, the sales pipeline isn’t just about closing a deal. It’s about tracking long-term revenue potential, like subscriptions, renewals, and upgrades. It involves multiple stakeholders, long sales cycles, and a focus on relationships over transactions. In short: you’re not just closing a deal, you’re starting a long-term account. That means knowing exactly where every opportunity stands and what kind of follow-up each one needs. Let’s build your revenue-generating machine from scratch.
Key Pipeline Stages: From Prospecting to Closed
Most SaaS companies shape their sales pipeline stages around these core steps:
- Prospecting/Lead Generation – You spot potential new customers through marketing campaigns, outbound efforts, or referrals
- Qualification – You check if prospects match your ideal customer profile (budget, authority, needs, timeline)
- Discovery/Demo – You learn customer needs and show your solution
- Proposal/Quote – You present pricing and terms to qualified leads
- Negotiation – You nail down details and handle objections
- Closing – You get the signed agreement
- Implementation/Onboarding – You set up the customer to succeed, and foster retention
These stages form the foundation, but the specifics (what each stage looks like, how long it lasts, and what criteria are required) should reflect your team’s actual workflow and GTM motion.
Supporting materials play a crucial role throughout these stages. Your prospects need something to hold onto between conversations. That can be a brochure or an engaging presentation, which can be a game-changer.
Entry and Exit Criteria for Each Stage
One of the biggest problems of sales pipelines? Vague progression rules. When deals move from one stage to the next without clear reasoning, forecasting becomes fantasy.
Below is a straightforward (but strict) lens to apply at each stage:
1. Prospecting
- Entry: You’ve identified a contact or company that vaguely fits your ICP. Maybe they downloaded an eBook. Maybe someone mentioned them in a Slack thread. Either way, they’ve entered your radar.
- Exit: You’ve confirmed a basic interest, got a working email address, and logged at least one personalized outreach attempt. No generic blasts.
Prospecting requires data, and not just any data. I’ve found the email finder by Skrapp.io to be the most reliable tool for building a prospect list. It’s not magic, but it gives you the verified emails needed to create traction and get the rest of your pipeline moving in the right direction.
2. Qualification
- Entry: The prospect engaged. A reply, a booked call, or even a form fill. There’s a pulse.
- Exit: You’ve checked all four: Budget? Authority? Need? Timeline?
(Even a “not now” can exit here, but mark it cold, not hot.)
The numbers show that 67% of sales reps don’t deal very well with picking which deals need attention first. Deals should move to the Proposal stage only after prospects ask for pricing or show real interest.
3. Discovery / Demo
- Entry: You’re in conversation. You’re booked to talk or already have.
- Exit: You’ve uncovered 2–3 key pain points, positioned your solution clearly, and confirmed interest in learning more. Bonus points if they say, “This is what we’ve been looking for.”
4. Proposal / Quote
- Entry: They asked for pricing or next steps. Not you pitching it prematurely.
- Exit: A formal proposal or quote has been sent, and there’s some signal they’re chewing on it.
5. Negotiation
- Entry: They’re asking questions. Pushing back. Requesting edits. This is real friction—don’t confuse it with silence.
- Exit: Final terms are on the table, and they’re evaluating internally. You’ve countered. They haven’t walked.
6. Closing
- Entry: You’ve got verbal buy-in or a soft yes. Legal or procurement might be the last gate.
- Exit: Signature in hand. Deal marked as Closed-Won or Closed-Lost, with reason captured.
7. Implementation / Onboarding
- Entry: Contract signed, kickoff scheduled.
- Exit: Solution is live, team trained, customer success loop engaged.
Every transition should feel earned. A healthy sales funnel isn’t about volume. It’s about speed and truthful forecasting. The tighter the criteria, the cleaner your data—and the easier your job gets next quarter.
“A well-structured sales pipeline isn’t just about tracking leads—it’s about understanding intent and timing,” Ante Mazalin, SEO Manager at SuperMoney.com.”
Adapting Pipeline for PLG, SLG, and Hybrid GTM Models
Your saas sales pipeline stages must match your go-to-market strategy. Whether you follow a PLG (product-led growth), SLG (sales-led growth), or hybrid model, the structure of your pipeline adapts to how leads are generated and moved through different stages.
PLG (Product-Led Growth) pipelines often start further down the funnel. Instead of top-of-funnel prospecting, reps jump in when usage signals suggest buyer intent, like when a user activates a key feature, hits a usage milestone, or adds teammates. These usage cues act as natural pipeline triggers, often replacing traditional qualification calls.
SLG (Sales-Led Growth) pipelines follow the more familiar structure: outbound prospecting, lead qualification, demo, proposal, and close. Reps take charge earlier and rely heavily on cold outreach, discovery, and nurturing. Here, early-stage pipeline activity focuses more on identifying pain points, booking meetings, and confirming fit before product access ever comes into play.
Hybrid models combine both. You may have two concurrent pipelines: one driven by product usage, the other led by reps. A self-serve user might convert through the product and expand later via a sales touchpoint. Or, a rep might engage an inbound lead who’s already explored the product. Hybrid models need separate pipelines for each approach.
The model you follow dictates not just the structure of your pipeline, but how quickly deals move, which metrics matter most, and how marketing teams and sales collaborate to hit revenue goals.
Using Coefficient to Audit Pipeline Hygiene
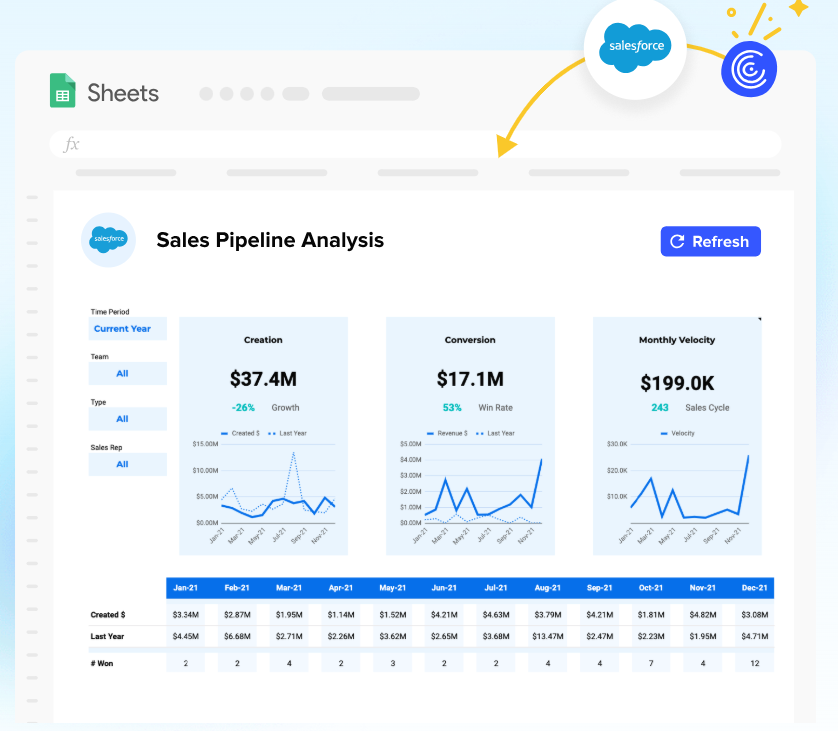
Bad pipeline habits lead to wrong forecasts and lost deals. Coefficient’s Pipeline Analysis Dashboard gives you tools to:
- Track deals that aren’t moving
- Spot drops in conversion rates at specific stages
- Watch pipeline coverage ratios (aim for 3- 4x quota)
- Set up automatic alerts for aging deals
- Sales velocity tracking using the formula: (Number of Opportunities × Win Rate × Average Deal Size) / Length of Sales Cycle
- Conversion rates by pipeline stage
- Deal age and progression tracking
- Revenue forecasting accuracy
The Coefficient platform essentially transforms static Salesforce data into dynamic and actionable insights, making it particularly valuable for ongoing pipeline hygiene audits and sales performance optimization.
Tips to Manage and Maintain a Healthy SaaS Pipeline
Maintaining a healthy saas sales pipeline is just as crucial as building one from scratch. Only 30% of organizations say they have the right tools to make use of information that improves their strategies. Here are practical ways to keep your pipeline flowing smoothly:
Conducting Weekly Pipeline Reviews
One-on-one pipeline reviews between managers and sales reps each week are the foundations of pipeline health. Group reviews waste time. Individual meetings between reps and managers give focused attention to specific deals. A well-laid-out format looks like this:
- 4 minutes for overview
- 7 minutes for problem lead #1 review
- 7 minutes for problem lead #2 review
- 7 minutes for problem lead #3 review
- 5 minutes for wrap-up and action items
The discussion should focus on what blocks deals from closing and specific steps to remove these blocks from the pipeline. These meetings should stay under 30 minutes and stick to the agenda.
Filtering for Stagnant or Outdated Deals
Deals don’t get better with age like fine wine does! You can spot stagnant deals by setting clear criteria. Look for deals without scheduled next steps, or deals stuck in the same stage longer than your average sales cycle. Coefficient flags these deals through conditional highlighting that spots opportunities with expired close dates or those stuck too long in advanced stages.
Monthly Cleanup and Archiving of Stale Deals
Each salesperson should review their current opportunities in a monthly “pipeline cleanup” session. This process includes:
- Remove leads that have gone cold
- Update the status of current leads
- Archive opportunities with no movement
- Tag deals to follow up later if needed
This approach keeps your pipeline focused on viable prospects and makes sales forecasts more accurate.
Tracking Pipeline Changes with Snapshots
Pipeline snapshots give you a vital historical point of view of your pipeline’s evolution. These daily captures show how opportunities and revenue change over time. Snapshots help you:
- Monitor pipeline growth trends
- Compare current pipeline health to previous periods
- Track new reps’ progress in building a full pipeline
Using Coefficient’s Auto-Refresh and Writeback Features
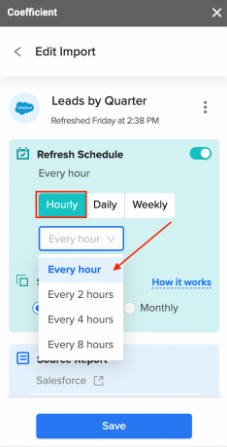
Coefficient makes pipeline management easier with smart automation and its Import Refreshes feature. You can set hourly, daily, or weekly auto-refresh schedules to keep data fresh. Changes made in spreadsheets update your CRM automatically with the bi-directional writeback feature. This removes the manual data entry that often stops sales reps from updating their CRM software.
How AI Can Support SaaS Pipeline Management
AI is reshaping saas sales pipeline management. It eliminates guesswork and speeds up revenue growth. Companies that use AI in sales show 83% higher revenue growth compared to those that don’t.
AI-Based Deal Risk Detection
AI systems now analyze customer conversations to track pain points and genuine buying signals instead of just relying on data that reps enter. These tools spot hesitation, competitor mentions, and pricing concerns before they can derail your pipeline. The system watches engagement patterns and flags deals when interactions decrease or response times slow down, signs that point to potential churn risk.
For companies using conversational commerce, conversational AI platforms can automatically sync prospect interactions from messaging channels directly into CRM pipelines, ensuring no potential deals fall through communication gaps.
Smart Scoring with Usage and Behavioral Data
AI examines lead data immediately to give useful customer insights and rank leads more accurately. Your team can focus on promising prospects while tracking product usage metrics that show when customers are ready to buy or expand.
AI-Generated Deal Summaries
AI creates complete deal summaries automatically instead of making reps document conversations by hand. These summaries pull out specific, useful data like next steps, deal risks, or gaps in methodology. Sales reps save 15-20 minutes on each follow-up, turning it into a quick editing task.
Forecasting with GPT/ML
AI-powered forecasting looks at multiple factors to give accurate projections. It analyzes historical sales data, engagement trends, and pipeline stages. These systems can predict which deals will close with up to 81% accuracy and suggest ways to keep risky deals on track.
Weekly Pipeline Summaries and Follow-Up Plans
AI puts together performance summaries from immediate data and points out trends, risks, and opportunities. Sales managers can act on current insights without waiting for delayed reports.
Highlighting Risky Deals
Advanced AI spots risky opportunities by tracking mentions of competitors, pushback on pricing, and patterns in objections straight from customer conversations.
Using Coefficient’s AI Assistant in Google Sheets
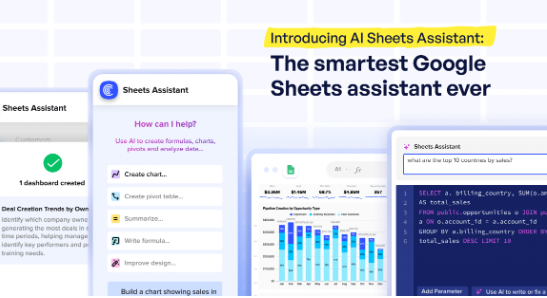
Coefficient’s AI Sheets Assistant turns raw data into useful insights right in Google Sheets. It creates fully editable charts and tables, converts unstructured data into structured insights, and helps write SQL queries without needing engineering support.
Unlike standard AI assistants that provide vague summaries, static charts, and a lot of guesswork, Coefficient’s AI Sheets Assistant delivers:
- Everything it creates is editable, live, and built to work
- Understands SaaS metrics like CAC, LTV, churn rates, and expansion revenue
- Maintains live connections to your CRM and other systems
- Builds shareable, updateable dashboards for cross-functional visibility
This makes Coefficient’s AI Sheets Assistant particularly valuable for SaaS companies that need sophisticated pipeline analysis but want the flexibility and familiarity of spreadsheet-based tools, while maintaining real-time data accuracy and advanced AI-powered insights.
Limitations of Traditional CRM-Based Pipeline Management
Modern saas sales pipeline management faces the most important challenges with traditional CRM systems. These platforms don’t provide the dynamic, integrated insights teams need to make effective decisions, despite their widespread use.
Static, Siloed CRM Reporting
CRM reports show only static snapshots of data over defined time periods. They lack historical context about reaching the current state or potential future trends. Your team’s ability to make informed decisions about your sales pipeline becomes limited by this one-dimensional view. These reports quickly become outdated, and teams constantly struggle to maintain accurate information.
Teams often forget valuable custom reports weeks after creation, which results in scattered, inconsistent analysis. Data quality problems make these issues worse:
- Bad data entry creates misleading reports
- Customer record duplicates skew analysis results
- Missing information affects downstream work heavily
- Old information doesn’t match current business realities
- Limited mobile CRM functionality leads to delayed data updates and missed opportunities during field interactions
Difficulty Integrating Product and CS Data
Data silos create one of the most important barriers to effective sales process saas management. Teams can’t collaborate effectively when information stays locked in isolated systems or databases that don’t connect with other similar systems.
Technical complexity adds these integration hurdles:
- Tools use incompatible formats (XML, JSON, proprietary structures)
- Legacy systems operate on completely different schemas
- Accurate field mapping between platforms remains challenging
- Different measurement standards (imperial vs. metric) create confusion
Large volumes of integrated data don’t automatically improve decision-making. Teams often face analysis paralysis when data sources multiply, which ends up creating confusion around the entire sales strategy.
Enabling Blended Views with Coefficient
Coefficient creates unified views that combine CRM data with product usage metrics and customer success information to solve these limitations. Revenue teams can now:
- Create a single source of truth that all departments can use
- Keep historical context while checking the current pipeline status
- Combine different data formats naturally without technical complexity
- Focus on streamlining processes instead of managing data volume
This combined approach helps teams analyze pipeline sources better and predict sales performance metrics more accurately than traditional, separated reporting.
Pipeline Metrics to Monitor
Your saas sales pipeline needs specific metrics to show how well your revenue machine is running. These key indicators help you spot bottlenecks and ways to make things better.
Stage Conversion Rates
Stage Conversion Rate shows what percentage of deals move forward between pipeline stages. This number tells you where prospects stop engaging in your sales process saas. SaaS companies of all sizes typically see these conversion rates: lead to MQL (41%), MQL to SQL (39%), and SQL to chance (42%).
You can find the Stage Conversion Rate by dividing deals that moved past a stage by total deals reaching that stage. Coefficient lets you watch these rates change over time and spot stages where deals often get stuck.
Pipeline Coverage and Deal Aging
Pipeline Coverage Ratio shows how your pipeline value stacks up against revenue targets; you should aim for 3 – 4x coverage. This tells you if you have enough chances to hit your goals. A 4:1 ratio means you need to close all but one of these deals to reach your targets.
Keep an eye on deal aging to find stuck opportunities. A healthy pipeline should have no more than 10-15% of deals sitting idle for over 30 days. Coefficient’s tools automatically flag these aging deals quickly.
Win Rate and Sales Velocity
Win Rate tells you what percentage of opportunities turn into closed deals. You should want 20-30% or better than your industry’s average.
Sales Velocity shows how fast deals move through your sales pipeline stages. Here’s the formula: (Number of Opportunities × Average Deal Value × Win Rate) ÷ Sales Cycle Length
This number shows daily revenue and helps predict future results while finding process bottlenecks.
Forecast vs Actuals by Segment
Comparing expected revenue with actual results by segment shows how accurate your predictions are. This becomes crucial for companies using usage-based models where customer consumption changes.
Coefficient’s live dashboards track these differences across customer segments. You see forecast accuracy right away without complex data work.
Collaboration and Monitoring Made Easy with Coefficient
Successful saas sales pipeline management depends on teamwork. Teams can create a complete picture of their sales process when they have the right tools to combine their data.
Real-Time CRM Dashboards in Sheets
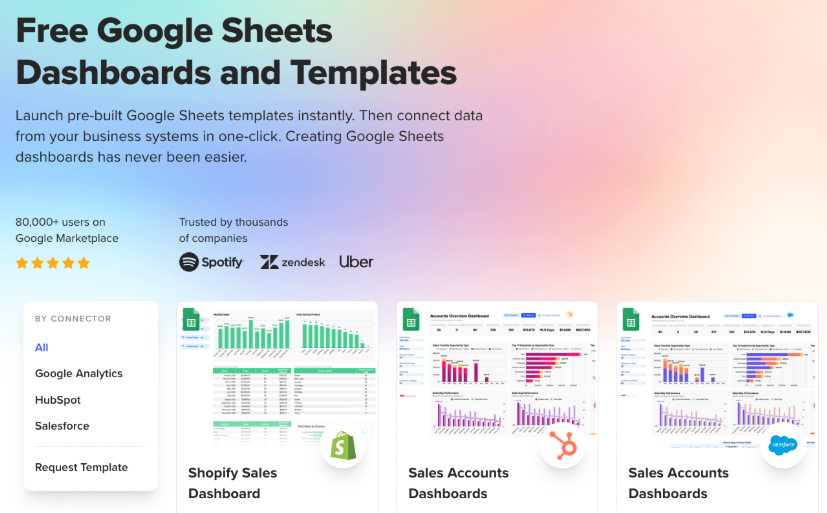
Coefficient connects your spreadsheets to business systems and makes them dynamic dashboards. You can keep using spreadsheets while getting live data from your systems. Your sales pipeline dashboards stay current without manual work through live connections to more than 70 systems like Salesforce and HubSpot.
For additional flexibility, you can automate Google Sheets with webhooks to trigger updates or workflows the moment new data is available.
You can set up live dashboards quickly:
- Install the Coefficient add-on in Google Sheets
- Select your data source through the dedicated dialog box
- Configure refresh schedules (hourly, daily, or weekly)
Marketing, sales, and customer success teams can work from the same trusted data source. Each team gets customized views that line up with their needs.
Creating Shared Pipeline Views
A centralized platform combines data from all customer touchpoints through shared pipeline views. Team members can see the complete sales process saas trip from start to finish.
Coefficient exports include unique identifiers (box keys) that make data tables easy to combine. Teams can create better reports without spending time on manual data processing. This feature is valuable.
Teams can spot patterns in deals, check sales rep activity, and find problems in their sales pipeline stages using these shared views.
Automating Alerts for Pipeline Issues

Teams can catch pipeline problems early before they hurt revenue. Coefficient gives you three types of alerts:
- Scheduled Alerts: Send screenshots of pipeline data daily, weekly, or monthly
- New Row Alerts: Notify when new records (like closed opportunities) appear
- Value Change Alerts: Alert when specific fields change (like stage advances)
Teams get alerts through email or Slack channels. They don’t need to check dashboards all the time. Quick alerts help catch delays in the sales cycle that could turn good leads into missed chances.
Teams can look at communication logs, engagement metrics, and feedback right away. These insights help create better responses to pipeline issues.
Conclusion
A properly executed SaaS sales pipeline makes revenue operations more efficient and successful. Companies without well-laid-out pipeline management fall behind, missing additional growth compared to those with defined systems.
A SaaS sales pipeline is a system of actions. It moves deals forward or leaves them behind. Clear criteria at every stage keep the momentum. Without that, most deals disappear.
Pipeline reviews must be regular. Each rep should know what counts as progress. Entry and exit rules reduce noise. Weekly check-ins identify slow movement and missed follow-ups.
AI supports this. It flags delays, ranks prospects, and cuts wasted time. It reduces errors in forecasts and highlights what needs attention. But it’s not the system. Your process is.
Use Coefficient to make information reliable. It syncs updates, tracks stage movement, and gives one source of truth. Sales teams should not guess where deals are. They should see it.
A working pipeline is not a list. It’s a process you follow every day. Set rules. Clean it often. Watch the numbers. Push what matters. Drop what doesn’t!
That’s how you build something that works.
FAQs
Q1. What are the key stages in a SaaS sales pipeline?
A typical SaaS sales pipeline consists of five main stages: prospecting, lead qualification, proposal/quotation, negotiation, and closing. Each stage represents a crucial step in moving potential customers towards a purchase decision.
Q2. How can AI enhance SaaS pipeline management?
AI can significantly improve SaaS pipeline management through deal risk detection, smart lead scoring, automated conversation summaries, and accurate sales forecasting. These AI-powered tools can save time, provide valuable insights, and help sales teams focus on high-potential opportunities.
Q3. What metrics should be monitored for a healthy sales pipeline?
Key metrics to monitor include stage conversion rates, pipeline coverage ratio, win rate, and sales velocity. These indicators help identify bottlenecks, forecast performance, and ensure sufficient opportunities to meet revenue targets.
Q4. How often should sales pipeline reviews be conducted?
Weekly one-on-one pipeline reviews between managers and individual sales reps are recommended. These focused 30-minute sessions should address specific deals, obstacles to closing, and action items to move opportunities forward.
Q5. What role does collaboration play in effective pipeline management?
Collaboration is crucial for successful pipeline management. Shared pipeline views and real-time dashboards ensure all team members work from the same data source. Automated alerts for pipeline issues keep teams informed and able to address problems proactively, ultimately driving better sales outcomes.