Table of Contents
![]()
- 1. How to Build a Sales Pipeline with Advanced Workflows – Tips for RevOps Teams
- 2. Best Practices for Sales Pipeline Management – Tips from RevOps Leaders
- 3. How to Increase Sales Velocity with Automations & AI
- 4. Top 10 Tips to Grow your Sales Pipeline in the AI Era from Sales Leaders
- 5. How to Build and Manage a SaaS Sales Pipeline
-
6. Sales Pipeline Stages in Salesforce: Guide for RevOps Teams
- Pipeline stages in Salesforce
- How to set up pipeline stages in Salesforce
- Limitations of pipeline management in Salesforce
- How 5,000+ RevOps practitioners automate pipeline tracking in spreadsheets
- How to set up a pipeline dashboard in spreadsheets
- Key metrics for sales managers to track in Salesforce
- Take control of your pipeline
- FAQs
- 7. Sales Pipeline Stages in HubSpot: Setup, Best Practices & Templates
- 8. Sales Pipeline vs Sales Funnel: What’s the Difference?


Sales pipelines drive revenue growth. They provide structure to your sales process and help forecast future performance.
Salesforce offers robust pipeline management capabilities, but many RevOps professionals find themselves needing more flexibility and analytical power. Let’s breakdown Salesforce Sales Pipeline by stages, metrics, limitations and reports.
Pipeline stages in Salesforce
Salesforce comes with default pipeline stages that track opportunities from initial contact to closed deal.
These standard stages typically include:
- Prospecting/Qualification
- Needs Analysis
- Value Proposition
- Identify Decision Makers
- Proposal/Price Quote
- Negotiation/Review
- Closed Won or Closed Lost
Each stage represents a milestone in your sales process. The beauty of Salesforce? You can customize these stages to match your unique business needs.
Warning: Creating custom fields in Salesforce often requires admin privileges and technical know-how. This process gets complicated fast. Spreadsheets offer a simpler alternative for custom fields and analysis—something we’ll explore shortly.
How to set up pipeline stages in Salesforce
Setting up or customizing your pipeline stages in Salesforce requires admin access. Here’s how to do it:
- Navigate to Setup
- In the Quick Find box, type “Sales Process”
- Select “Sales Processes” under “Build > Customize > Opportunities”
- Click “New” to create a new sales process or edit an existing one
- Add, remove, or reorder stages as needed
- Save your changes
Once configured, these stages will appear in your opportunity records and reports.
Limitations of pipeline management in Salesforce
Salesforce provides powerful pipeline tracking, but RevOps professionals often encounter frustrating limitations:
- Limited stage aging insights. Salesforce struggles to show how long deals stay in each stage without custom development.
- Rigid dashboards and reports. Creating custom views requires technical knowledge and often admin privileges.
- Confusing forecast categories. Without proper context, these can mislead your sales predictions.
- Lack of real-time collaboration. Multiple team members can’t easily work together on pipeline analysis.
- Difficult quick analysis. Ad-hoc investigation requires creating new reports or exports.
These limitations push many RevOps professionals to seek more flexible solutions.
How 5,000+ RevOps practitioners automate pipeline tracking in spreadsheets
Spreadsheets remain the go-to tool for flexible data analysis. With Coefficient, you get the best of both worlds: Salesforce’s robust data architecture with the flexibility of spreadsheets.
Here’s why RevOps pros choose this approach:
- Real-time data without manual exports. Coefficient automatically pulls your Salesforce pipeline data into spreadsheets. No more CSV exports or copy-pasting. Your data stays fresh with scheduled refreshes.
- Unlimited customization. Create any view, calculation, or visualization you need. Want to see stage conversion rates by product line? Need to track average days in each stage by rep? Build it in minutes, not days.
- Enhanced collaboration. Share your pipeline analysis with anyone—even those without Salesforce licenses. Everyone works from the same version of truth, with commenting and editing capabilities built right in.
- Powerful automation. Set up alerts when deals stall, when pipeline coverage drops below targets, or when win rates change significantly. Get notifications in Slack or email exactly when you need them.
How to set up a pipeline dashboard in spreadsheets
Start by exploring our Pipeline dashboard that automatically populates with live Salesforce data.
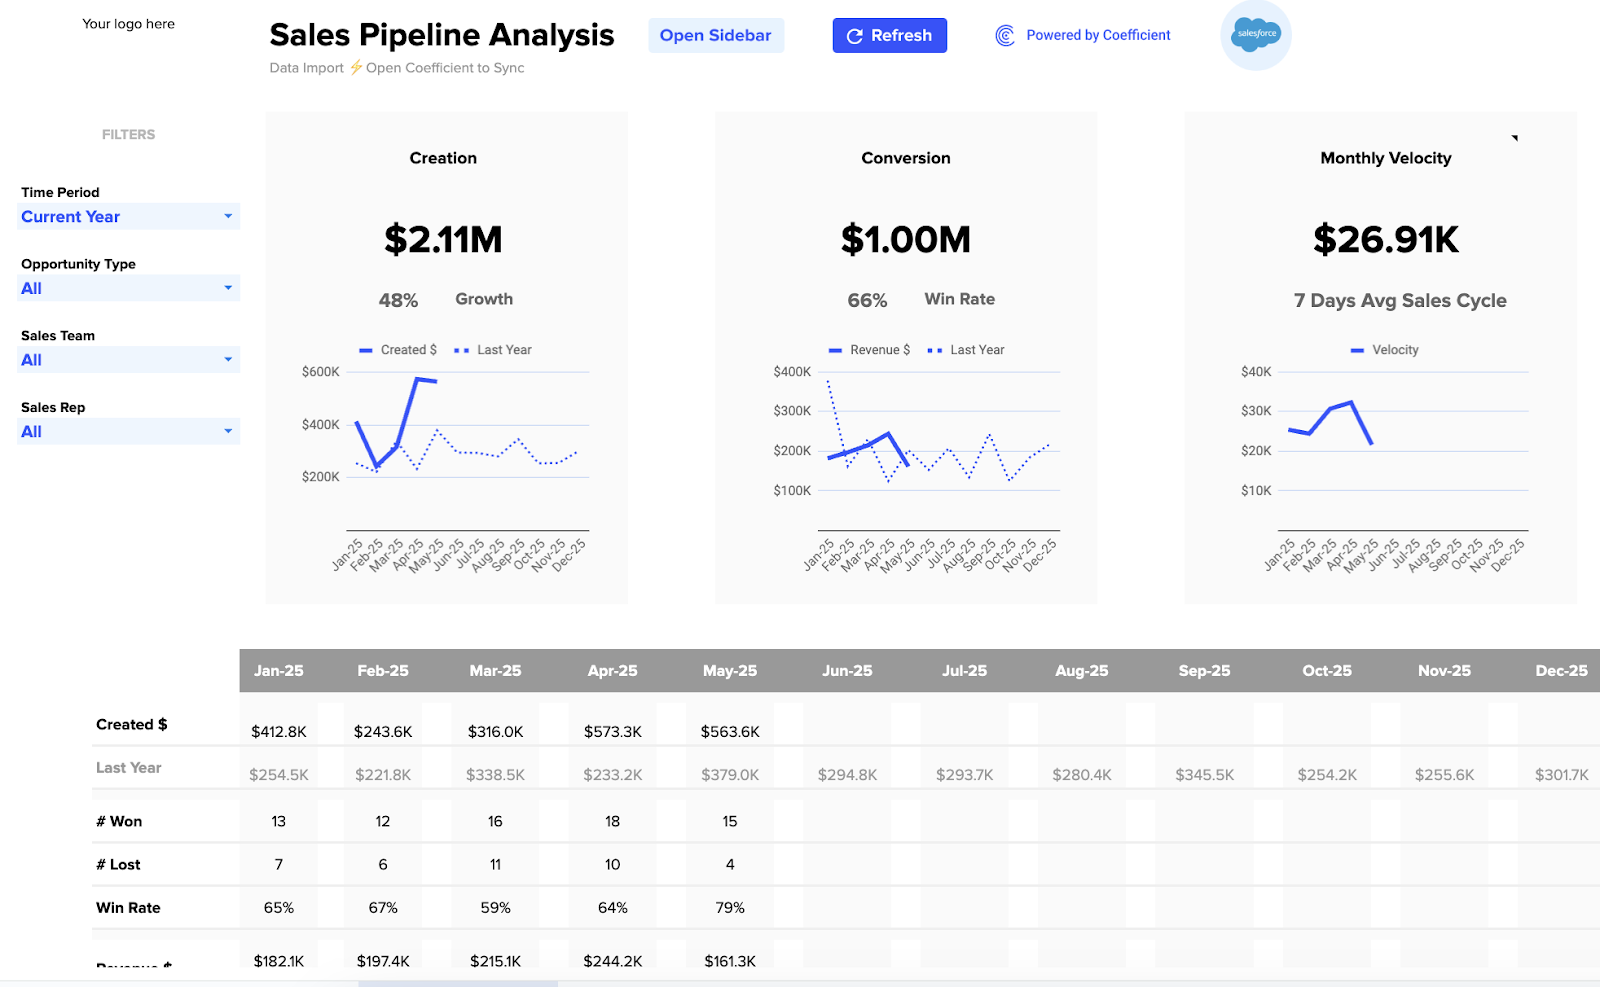
This dashboard helps you measure key indicators like Pipeline Creation, Sales Conversions, and Sales Velocity while enabling you to slice data by team, opportunity type, and other dimensions.
Here’s how to build your own pipeline tracker:
- Install the Coefficient add-on for Google Sheets from the Extensions menu
- Launch Coefficient and select “Import from…” then choose Salesforce
- Import Opportunity data with relevant fields (Amount, Close Date, Stage, etc.)
- Toggle Pivot Mode to organize your data by forecast category and date
- Create charts and visualizations using your live Salesforce data
- Set up automatic refresh schedules to keep data current
For a more detailed walkthrough, check out our comprehensive guide on building a sales pipeline tracker in Google Sheets.
Video tutorial: Create a sales pipeline tracker in Google Sheets
This step-by-step video shows you how to build a professional sales pipeline visualization that updates automatically with your Salesforce data. Learn how to track pipeline evolution throughout the year and create powerful visualizations in just minutes.
Key metrics for sales managers to track in Salesforce
Effective pipeline management requires monitoring these critical metrics:
- Pipeline coverage ratio Track the ratio of pipeline value to quota. Most sales leaders aim for 3-5x coverage to ensure quota attainment.
- Win rate by stage Measure conversion percentages at each pipeline stage to identify where deals stall.
- Deal velocity Calculate the average time opportunities spend in each stage to identify bottlenecks.
- Forecast accuracy Compare predictions to actual results to improve future forecasting.
- Pipeline by segment Analyze pipeline distribution across reps, territories, and customer segments to ensure balanced focus.
- Deal push rate Monitor how often close dates move to identify coaching opportunities.
- Aging deals Flag opportunities that have been inactive or stuck in one stage too long.
Want to track all these metrics in one place?
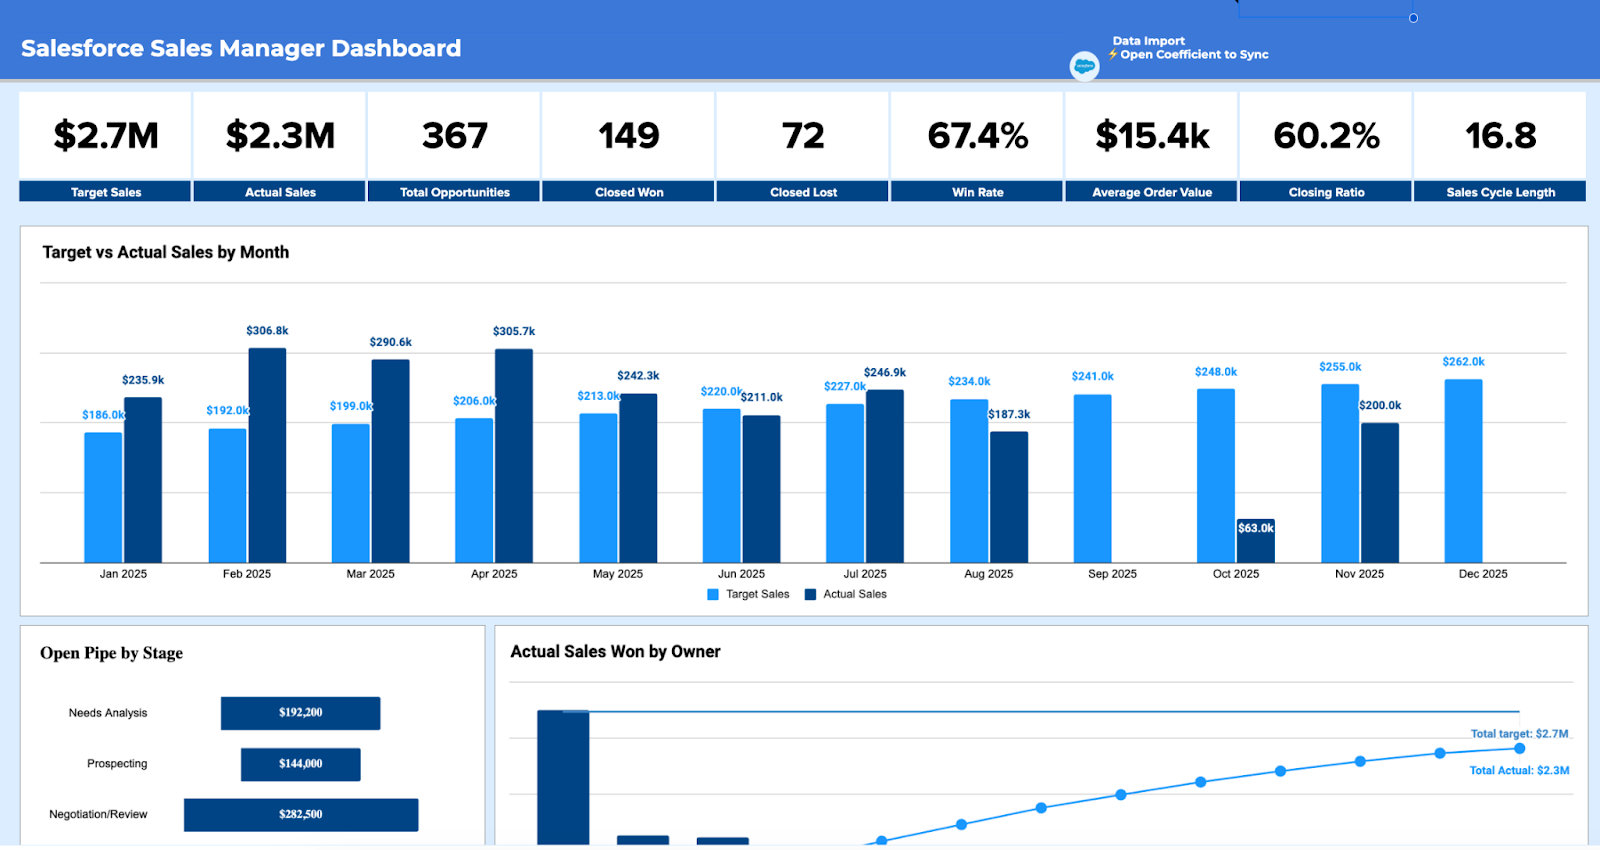
Check out our Sales Manager Dashboard for a comprehensive view of your sales performance.
Take control of your pipeline
Salesforce pipeline stages provide structure for your sales process. But the real power comes when you connect that data to flexible analytics tools.
With Coefficient, you maintain the reliability of Salesforce while gaining the analytical freedom of spreadsheets. Your pipeline data updates automatically, your team collaborates effortlessly, and your insights drive better decisions.
Stop struggling with rigid Salesforce reports. Start making your pipeline data work for you. Get started with Coefficient today and transform how you manage your sales pipeline.
FAQs
What are the 5 stages of a sales pipeline?
The five essential stages of a sales pipeline are:
- Lead generation/prospecting
- Qualification/discovery
- Solution presentation/demo
- Proposal/negotiation
- Closing/won or lost
Many companies add additional stages to provide more granular tracking and forecasting.
What are the 7 stages of the sales cycle?
The seven stages of a comprehensive sales cycle typically include:
- Prospecting
- Initial contact/qualification
- Needs assessment
- Solution presentation
- Handling objections
- Closing
- Follow-up/nurturing
Each stage represents a distinct activity and milestone in the customer acquisition process.
What is a sales pipeline in Salesforce?
A sales pipeline in Salesforce is a visual representation of your sales process using the Opportunity object. It shows all potential deals organized by stage, allowing sales teams to track progress, forecast revenue, and prioritize activities. Salesforce pipelines can be customized with unique stages that match your specific sales methodology and business requirements.