


Table of Contents
![]()
- 1. How to Build a Sales Pipeline with Advanced Workflows – Tips for RevOps Teams
- 2. Best Practices for Sales Pipeline Management – Tips from RevOps Leaders
- 3. How to Increase Sales Velocity with Automations & AI
- 4. Top 10 Tips to Grow your Sales Pipeline in the AI Era from Sales Leaders
- 5. How to Build and Manage a SaaS Sales Pipeline
- 6. Sales Pipeline Stages in Salesforce: Guide for RevOps Teams
- 7. Sales Pipeline Stages in HubSpot: Setup, Best Practices & Templates
- 8. Sales Pipeline vs Sales Funnel: What’s the Difference?


A sales pipeline is your revenue lifeline. For RevOps teams, building and maintaining this critical system often means juggling multiple tools and manual processes. Today’s high-performing teams are streamlining pipeline management with automated workflows and real-time data connections.
Key pillars of a sales pipeline
Every effective sales pipeline rests on a foundation of well-defined stages and metrics. These elements provide the structure needed for visibility, accountability, and predictable revenue growth.
Pipeline stages
- Prospecting The hunt begins here. Your team identifies potential customers who match your ideal profile through research, referrals, or inbound marketing. Success depends on volume and targeting accuracy.
- Qualification Not all prospects deserve your time. During qualification, sales reps determine if prospects have the budget, authority, need, and timing (BANT) to become customers. This prevents wasted effort on poor-fit opportunities.
- Discovery Dig deeper into customer problems. Sales reps uncover specific pain points, goals, and requirements through detailed conversations. The insights gathered here shape your entire approach.
- Proposal Put your solution on paper. Based on discovery findings, your team presents a tailored solution with pricing, implementation details, and expected outcomes. Customization is key.
- Negotiation Find the win-win middle ground. Prospects may request adjustments to terms, pricing, or scope. This stage tests your value proposition and your sales team’s ability to articulate it.
- Closing Seal the deal. All paperwork is signed, payments are arranged, and the relationship officially begins. The handoff to customer success happens here.
Key pipeline metrics to monitor
Your pipeline is only as good as the metrics tracking it. These numbers tell the real story of sales performance:
- Conversion rates between stages Track the percentage of deals moving from one stage to the next. Low conversion at specific stages reveals process bottlenecks or training needs.
- Average deal size Know your typical deal value to forecast accurately. Track this by segment, product line, and sales rep to spot opportunities for growth.
- Sales velocity Measure how quickly deals move through your pipeline from first touch to closed won. Faster velocity means quicker revenue realization.
- Win rate per stage Calculate the percentage of opportunities that eventually close as won from each pipeline stage. This helps predict outcomes based on current pipeline position.
For deeper analysis of these metrics, check out our comprehensive guide to sales pipeline metrics.
Steps for building a sales pipeline
Create your pipeline with intention. These steps ensure your pipeline matches your business reality and sales process.
#1 Define your ideal customer profile (ICP)
Start with who you’re selling to. Your ICP describes the organizations that gain the most value from your solution and provide the most value to your business. Include firmographic details like:
- Industry, company size, and location
- Annual revenue or budget range
- Technology stack and infrastructure
- Common pain points and business objectives
A well-defined ICP focuses your prospecting efforts and improves conversion rates throughout the pipeline.
#2 Map the buyer’s journey
Understand how customers buy before designing how you sell. Interview recent customers about their purchase experience. Note their information sources, decision criteria, and common objections. This research reveals the true path prospects take—not the one you assume they take.
#3 Align pipeline stages with buyer intent
Make your pipeline match reality. Each stage should reflect a meaningful milestone in the buyer’s decision process, not just your sales activities. For example, “Discovery Call Completed” is seller-centric, while “Customer Problem Validated” is buyer-centric and more meaningful.
#4 Establish clear stage entry/exit criteria
Remove ambiguity from your process. Define specific conditions for moving deals between stages. These criteria ensure consistent pipeline management across your team and improve forecast accuracy. For example, a deal enters “Proposal” only after the prospect confirms budget and decision timeline.
#5 Assign responsibilities and KPIs to each stage
Clarify who does what and when. Specify the team member responsible for each stage and the activities they must complete. Then set performance targets that measure their effectiveness. This accountability structure prevents deals from stalling due to confusion or neglect.
How RevOps leaders leverage spreadsheets for advanced pipeline workflows
Spreadsheets remain the universal language of business analysis. With the right tools, RevOps teams can transform basic spreadsheets into powerful pipeline management systems.
Live CRM data sync into spreadsheets
Stop manual exports that expire the moment they’re created. Coefficient connects your spreadsheets directly to your CRM, pulling real-time opportunity data into familiar Google Sheets.
With Coefficient, you can:
- Import Salesforce or HubSpot opportunity data with a few clicks
- Set up automatic refresh schedules (hourly, daily, weekly)
- Filter and segment data on import for focused analysis
- Maintain data accuracy without constant manual updates
This live connection ensures your pipeline analysis always reflects current reality, not last week’s snapshot.
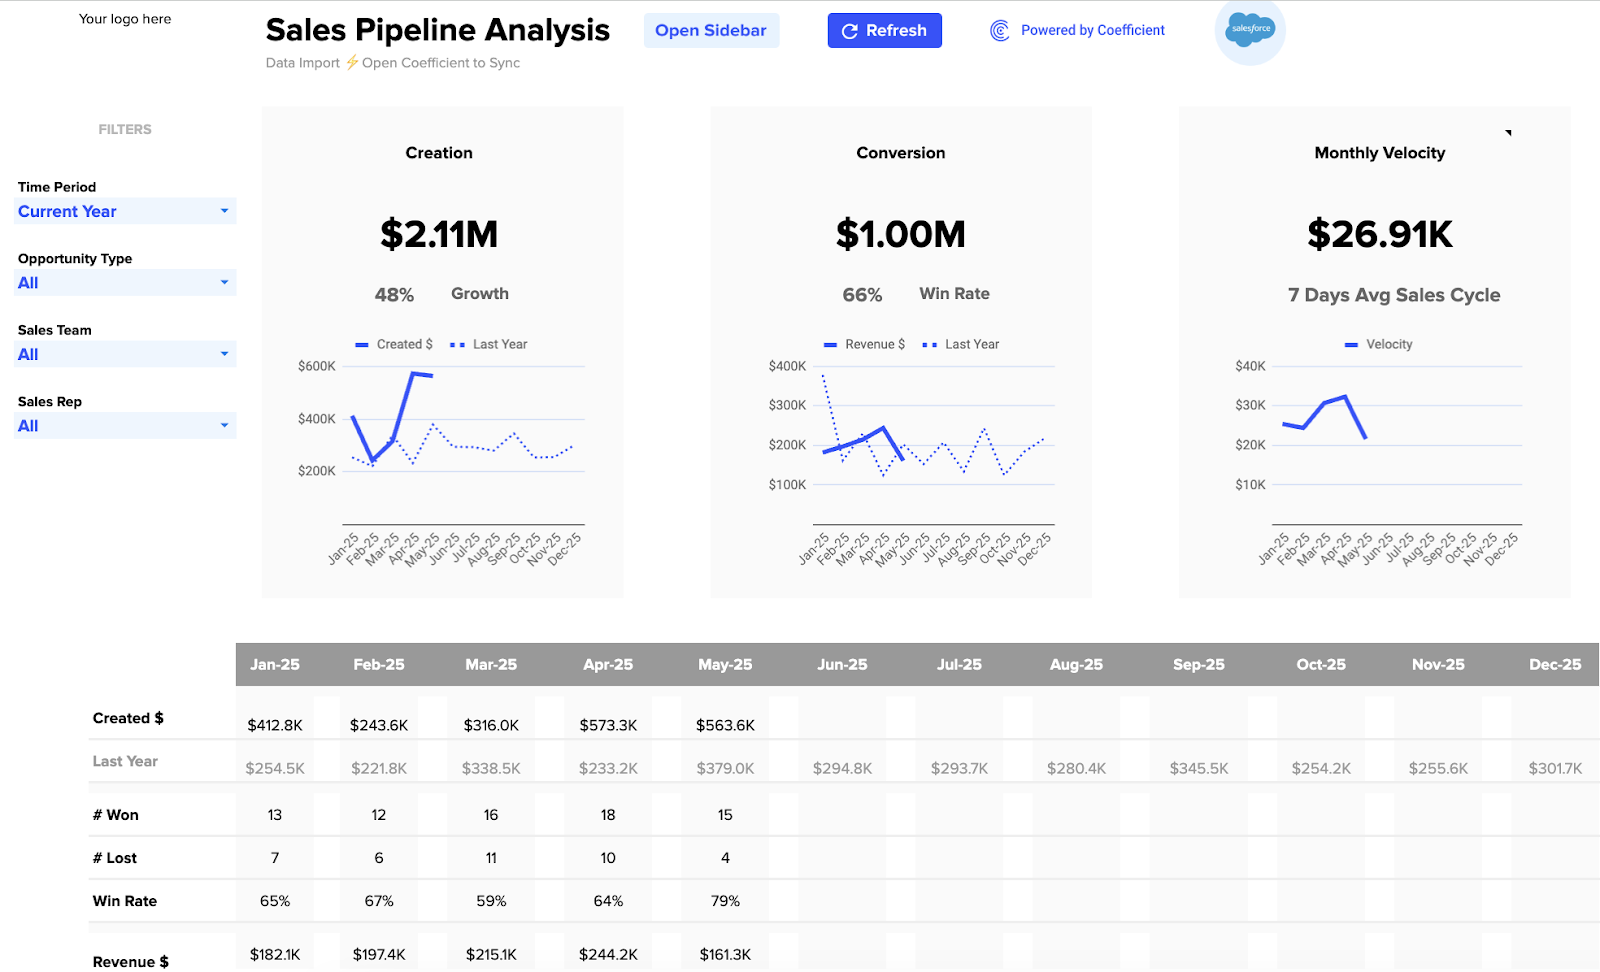
Dynamic pipeline dashboards and forecasts
See the full picture instantly. Build visual representations of your pipeline that update automatically as deals progress. Coefficient’s direct data connection powers dashboards that segment by:
- Pipeline stage distribution
- Deal owner performance comparison
- Regional pipeline health
- Time-based forecasts by month or quarter
These dynamic views help you spot trends, identify outliers, and make data-driven decisions faster than static reports allow.
Pro tip: Use clear, simple stage names aligned with buyer behavior in your dashboards. Technical or internal terminology can confuse stakeholders during reviews.
Deal aging and stage velocity analysis
Find the slow spots in your pipeline. Calculate exactly how long deals spend in each stage to identify bottlenecks and stalled opportunities. With spreadsheet formulas and real-time data:
- Compare actual stage duration against targets
- Flag deals that exceed standard time-in-stage
- Track velocity trends by rep, product, or segment
- Identify which stages most often become sticking points
Pro tip: Set up automated alerts for deals that exceed standard aging thresholds. Early intervention on stalled deals dramatically improves pipeline health.
Pipeline coverage report (quota vs. pipeline)
Know if you have enough pipeline to hit targets. Create models that compare current pipeline volume against quota requirements at various conversion rates. This helps sales leaders:
- Identify reps who need more prospecting support
- Adjust forecasts based on realistic pipeline coverage
- Make informed decisions about resource allocation
- Set appropriate activity targets for early-stage efforts
Pro tip: Standardize data input from reps to ensure your coverage calculations use reliable information. Garbage in means garbage out, especially with pipeline coverage models.
Automated pipeline snapshots for leadership reviews
Track changes over time without manual work. Coefficient can automatically generate point-in-time snapshots of your pipeline status and distribute them via email or Slack. These regular snapshots allow you to:
- Compare this week’s pipeline to last week’s
- Identify new deals, closed deals, and slipped deals
- Track pipeline growth or shrinkage trends
- Provide consistent updates to leadership without manual prep
Pro tip: Hold regular pipeline reviews using these snapshots. The discipline of consistent reviews improves forecast accuracy and sales team accountability.
Common mistakes in building a sales pipeline
Even experienced RevOps teams make these common pipeline mistakes:
- Overcomplicating with too many stages. More isn’t better. Five to seven stages is typically ideal—enough detail for visibility without creating confusion.
- Missing shared definitions. When “Qualified” means different things to different reps, your pipeline data becomes meaningless. Document clear criteria.
- Relying on static reports. Yesterday’s pipeline export is already outdated. Real-time data connections prevent decisions based on old information.
- Neglecting follow-up SLAs. Without clear expectations for follow-up timing, deals stagnate. Define and enforce response time standards.
- Wasting time on manual exports. RevOps professionals often spend hours weekly on data exports and formatting. Automation reclaims this time for strategic work.
Taking your pipeline to the next level
Building an effective sales pipeline requires ongoing refinement, data-driven insights, and the right tools to make management efficient. With properly structured pipeline stages, clear metrics, and automated workflows, RevOps teams can transform pipeline management from a burdensome task to a strategic advantage.
Ready to elevate your pipeline management? Get started with Coefficient today and see how spreadsheet automation can transform your RevOps workflow.
FAQ
How to build a sales pipeline step by step?
- Define your ideal customer profile and buyer personas
- Map your sales process to match the buyer’s journey
- Create 5-7 pipeline stages with clear entry/exit criteria
- Set up tracking systems for key metrics and conversion rates
- Implement regular pipeline review cadences
- Automate data collection and reporting
Coefficient streamlines this process by connecting your CRM data directly to spreadsheets, enabling automated reporting and real-time pipeline visibility without manual data exports.
What is the formula for sales pipeline?
The basic sales pipeline formula is: Number of Qualified Leads × Average Deal Size × Win Rate = Expected Revenue. For more accuracy, calculate this by stage: Sum of (Deals in Each Stage × Stage Conversion Rate × Average Deal Size).
With Coefficient, you can build dynamic pipeline formulas in spreadsheets that automatically update as your CRM data changes, ensuring your calculations always use the latest numbers.
