Table of Contents
![]()
- 1. How to Build a Sales Pipeline with Advanced Workflows – Tips for RevOps Teams
- 2. Best Practices for Sales Pipeline Management – Tips from RevOps Leaders
- 3. How to Increase Sales Velocity with Automations & AI
- 4. Top 10 Tips to Grow your Sales Pipeline in the AI Era from Sales Leaders
- 5. How to Build and Manage a SaaS Sales Pipeline
- 6. Sales Pipeline Stages in Salesforce: Guide for RevOps Teams
- 7. Sales Pipeline Stages in HubSpot: Setup, Best Practices & Templates
- 8. Sales Pipeline vs Sales Funnel: What’s the Difference?


Pipelines track deals. Funnels track buyers. Both drive revenue, but they work differently. Let’s clear up the confusion.
TLDR – Sales Pipeline vs Sales Funnel
Key differences between sales pipelines and funnels:
- Purpose: Pipelines track deal progression; funnels track buyer journey
- Direction: Pipelines flow horizontally; funnels narrow vertically
- Focus: Pipelines emphasize sales activities; funnels highlight conversion rates
- Measurement: Pipelines measure deal value; funnels measure prospect volume
- Ownership: Pipelines belong to sales teams; funnels span marketing and sales
What is a Sales Pipeline?
A sales pipeline visualizes your deals as they move through your sales process. It shows exactly where money lives at each stage, helping forecast revenue and manage resources effectively.
Sales Pipeline Stages
Most sales pipelines include these key stages:
- Lead Generation – Identifying potential buyers through marketing efforts, referrals, or outreach activities. This stage focuses on creating initial interest.
- Lead Qualification – Evaluating prospects against your ideal customer profile to determine if they’re worth pursuing. Good qualification saves time and resources.
- Discovery – Investigating prospect needs through meaningful conversations. Sales reps dig into pain points, goals, and buying timelines.
- Proposal/Quote – Presenting a formal offer tailored to the prospect’s specific needs. This stage often includes pricing details and implementation plans.
- Negotiation – Working through objections, pricing concerns, and contract terms. This critical stage requires balancing value delivery with profit margins.
- Closed Won/Lost – The final decision point where deals either convert to customers or exit the pipeline. Won deals transition to onboarding while lost deals may re-enter the pipeline later.
- Post-Sale – Customer onboarding, relationship management, and expansion opportunities. This stage sets the foundation for retention and growth.
Different Ways to track Sales Pipeline – RevOps Expert Insights
Tracking Sales Activities
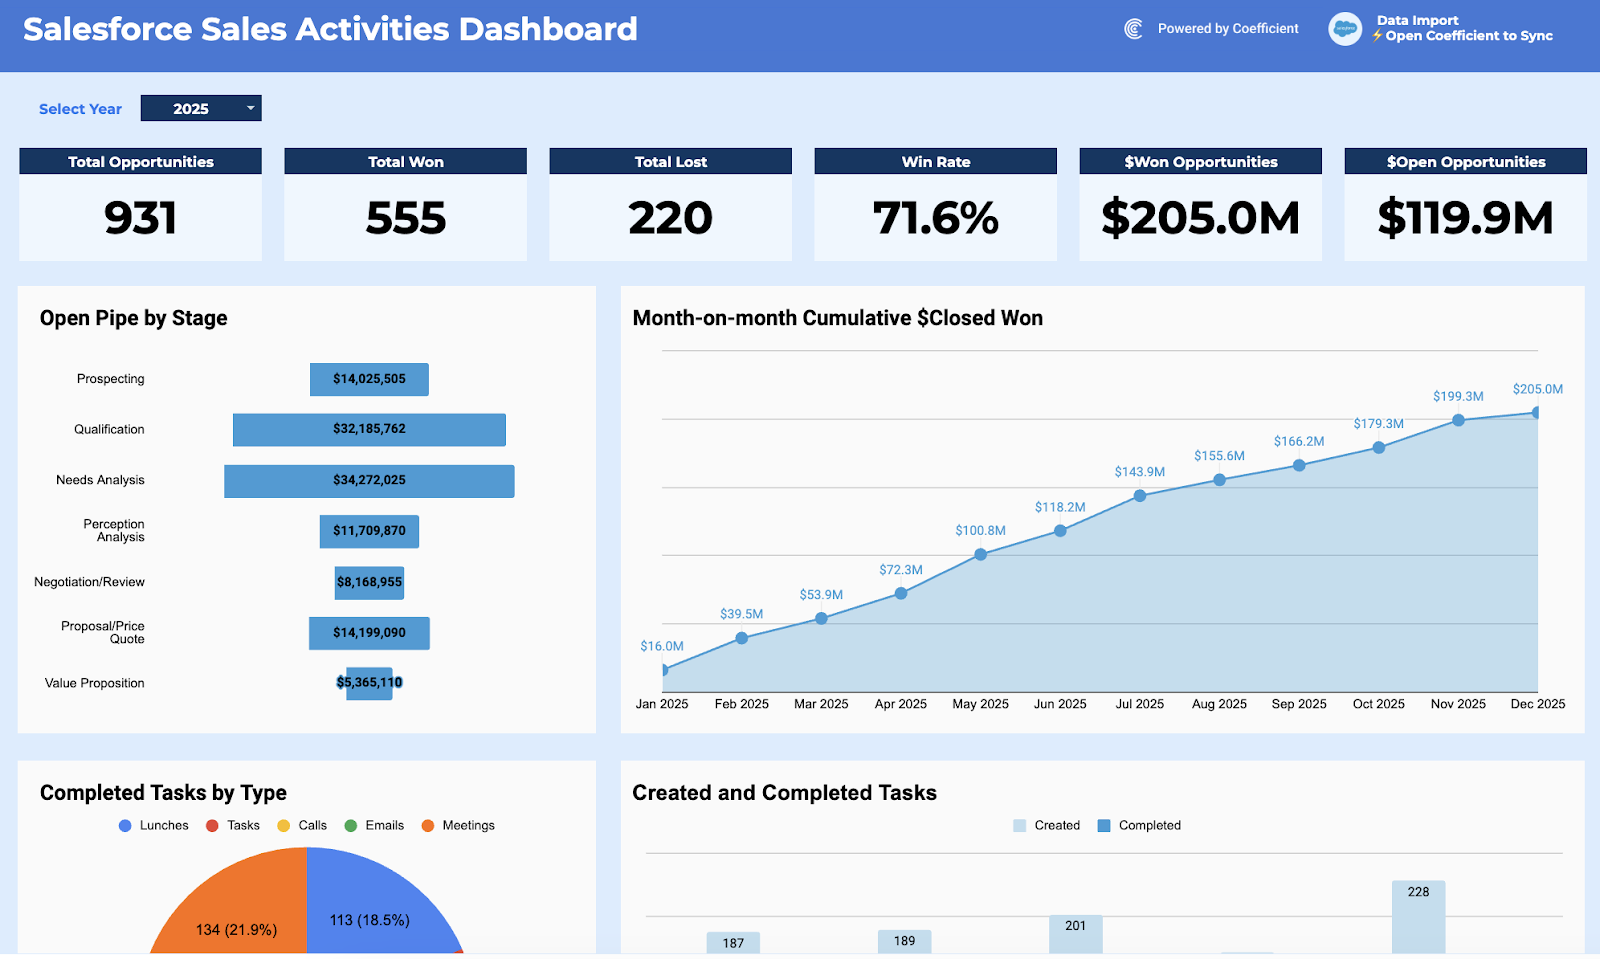
Activity tracking shines a spotlight on your team’s daily efforts. It connects calls, emails, and meetings to pipeline health, revealing which actions drive results.
Ready to supercharge your activity tracking?
Download the free Sales Activities Dashboard template and start measuring what matters.
Sales Manager or Sales Leadership Dashboard
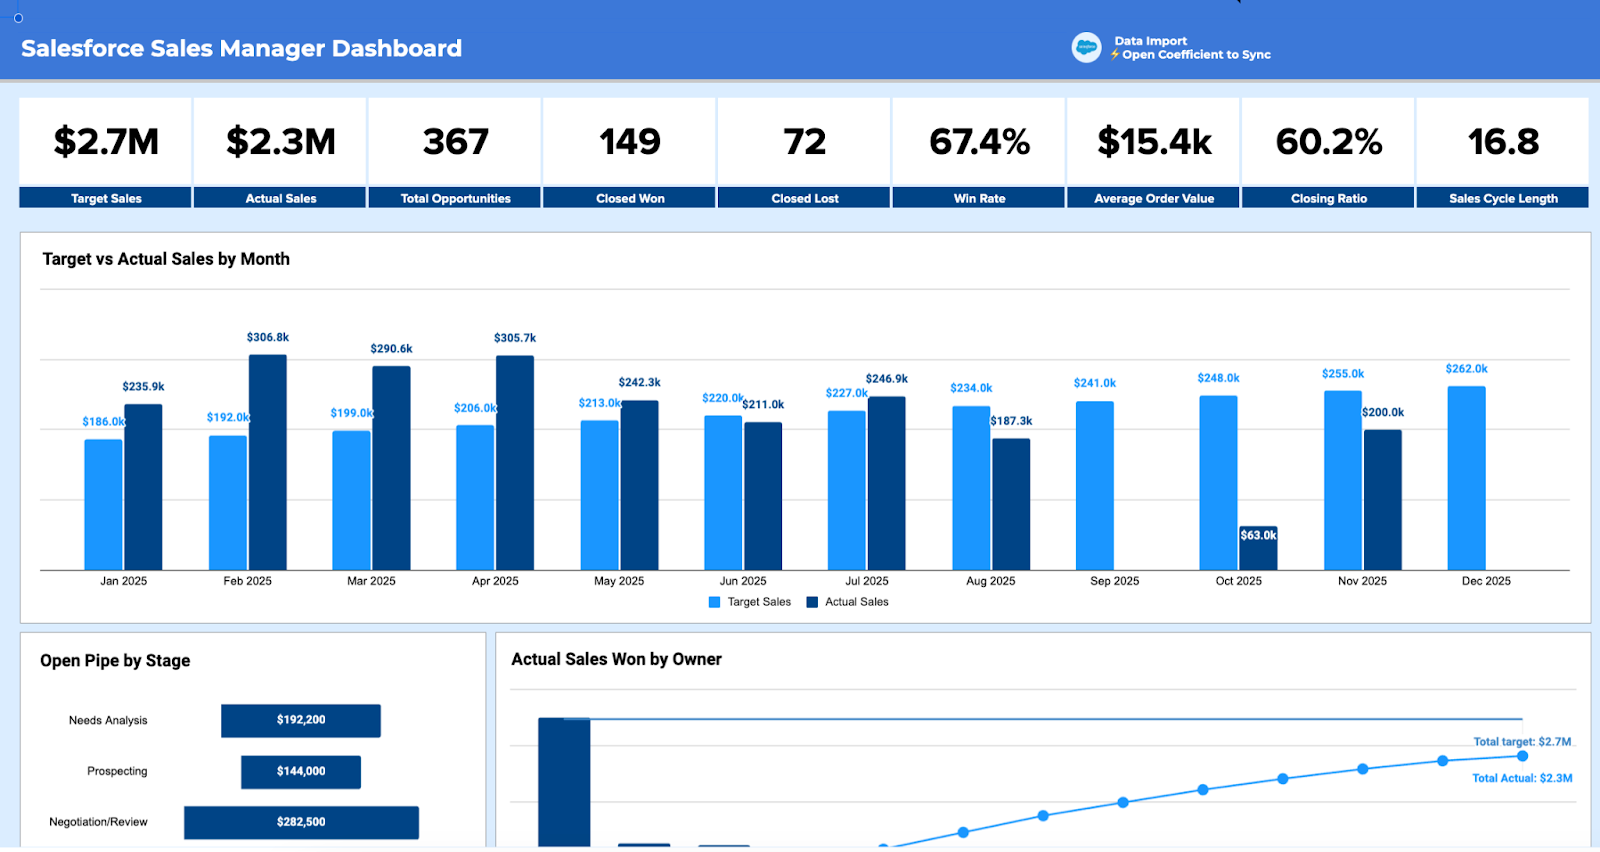
Leadership dashboards deliver the big picture view executives need. They combine performance metrics, team comparisons, and forecasting in one visual command center.
Take control of your sales leadership today. Grab the Sales Manager Dashboard template and transform how you lead.
In-Depth Pipeline Analysis Dashboard

Deep pipeline analysis uncovers hidden patterns in your sales data. Compare monthly results, spot bottlenecks, and understand what’s really driving your win rates.
Start making smarter pipeline decisions. Access your free Pipeline Analysis Dashboard and unlock insights that drive growth.
Weighted Sales Pipeline
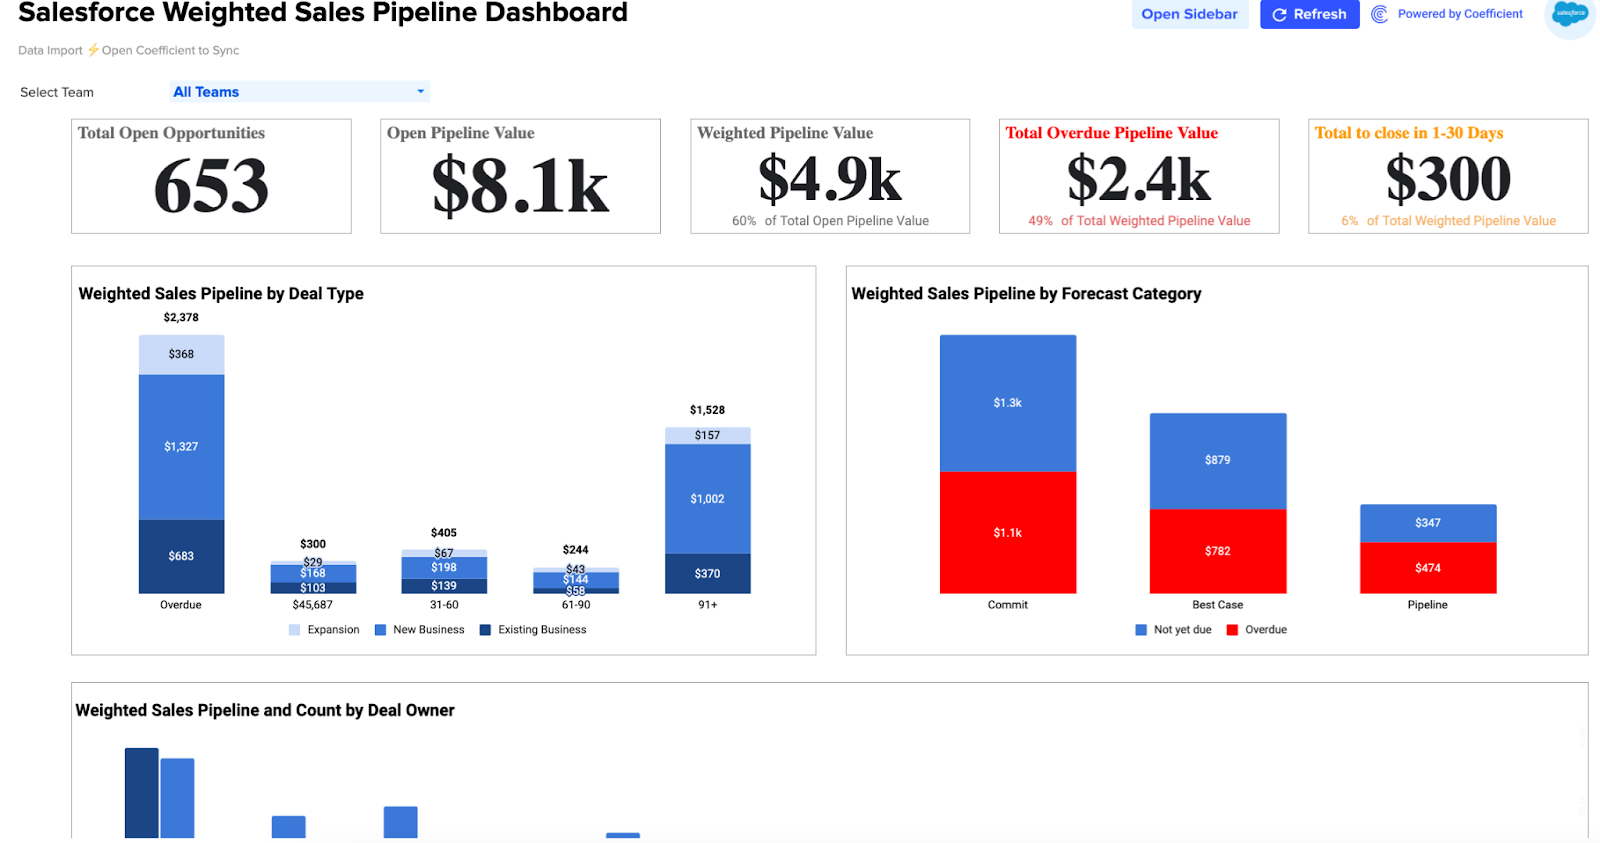
Weighted pipelines bring reality to forecasting. They adjust opportunity values based on stage probability, giving you more accurate revenue predictions without the guesswork.
Make your forecasts more reliable. Build your own Weighted Pipeline Dashboard with our ready-to-use template.
Win Loss Analysis Dashboard
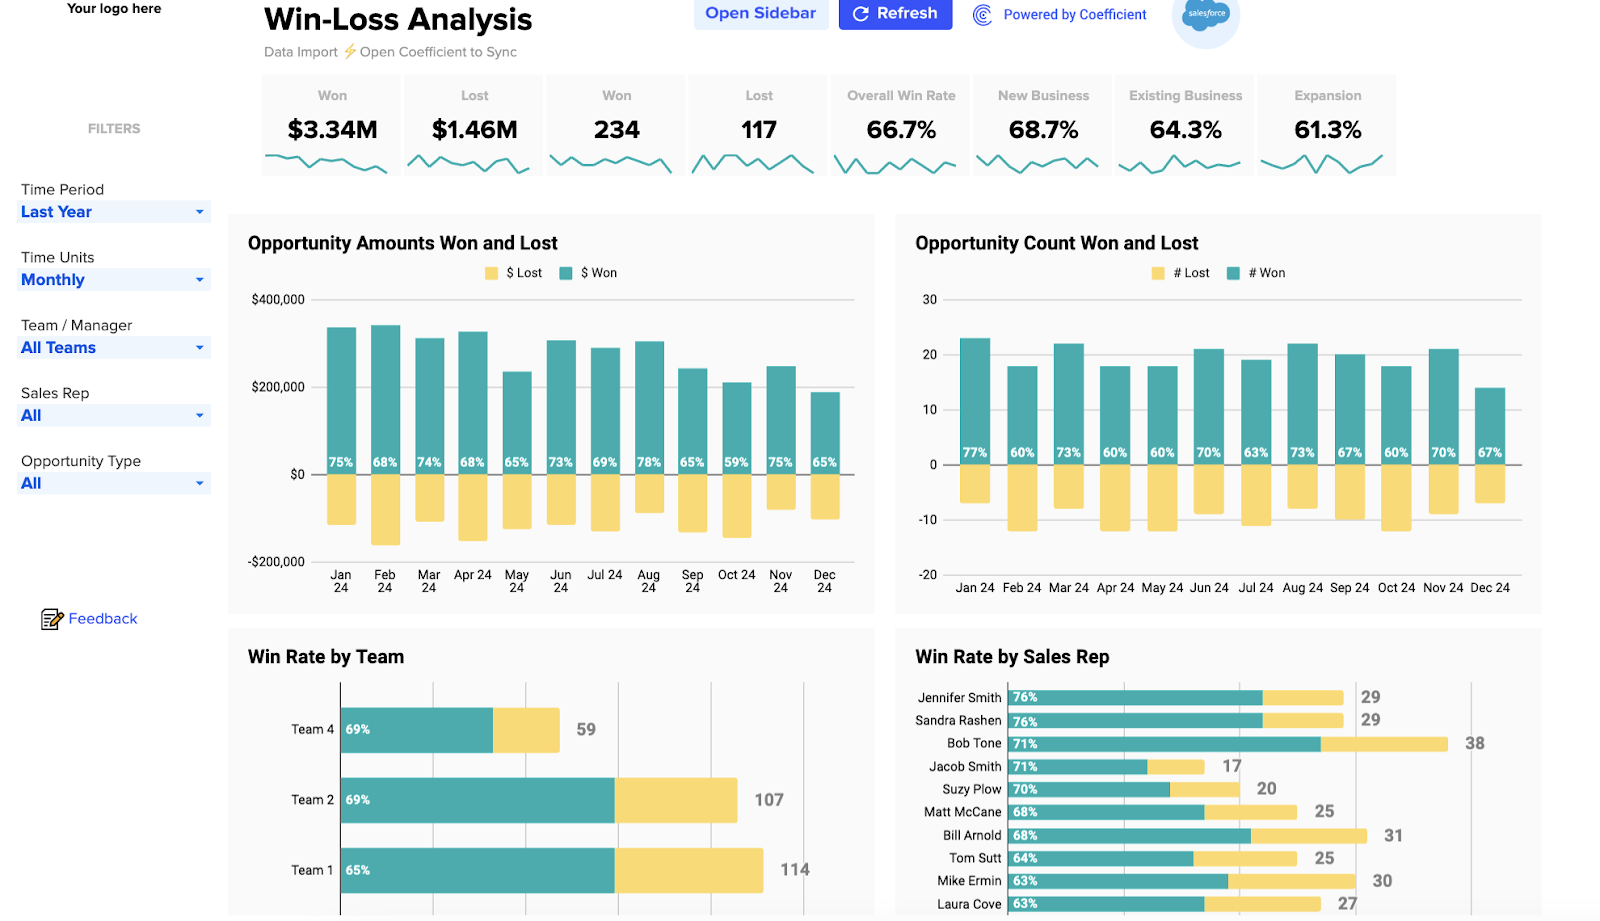
Win-loss analysis reveals why you win—and why you don’t. It helps you double down on winning strategies and quickly abandon approaches that waste resources.
Learn from every deal outcome. Create your Win-Loss Analysis Dashboard and turn insights into action.
Sales Opportunity Overview Dashboard
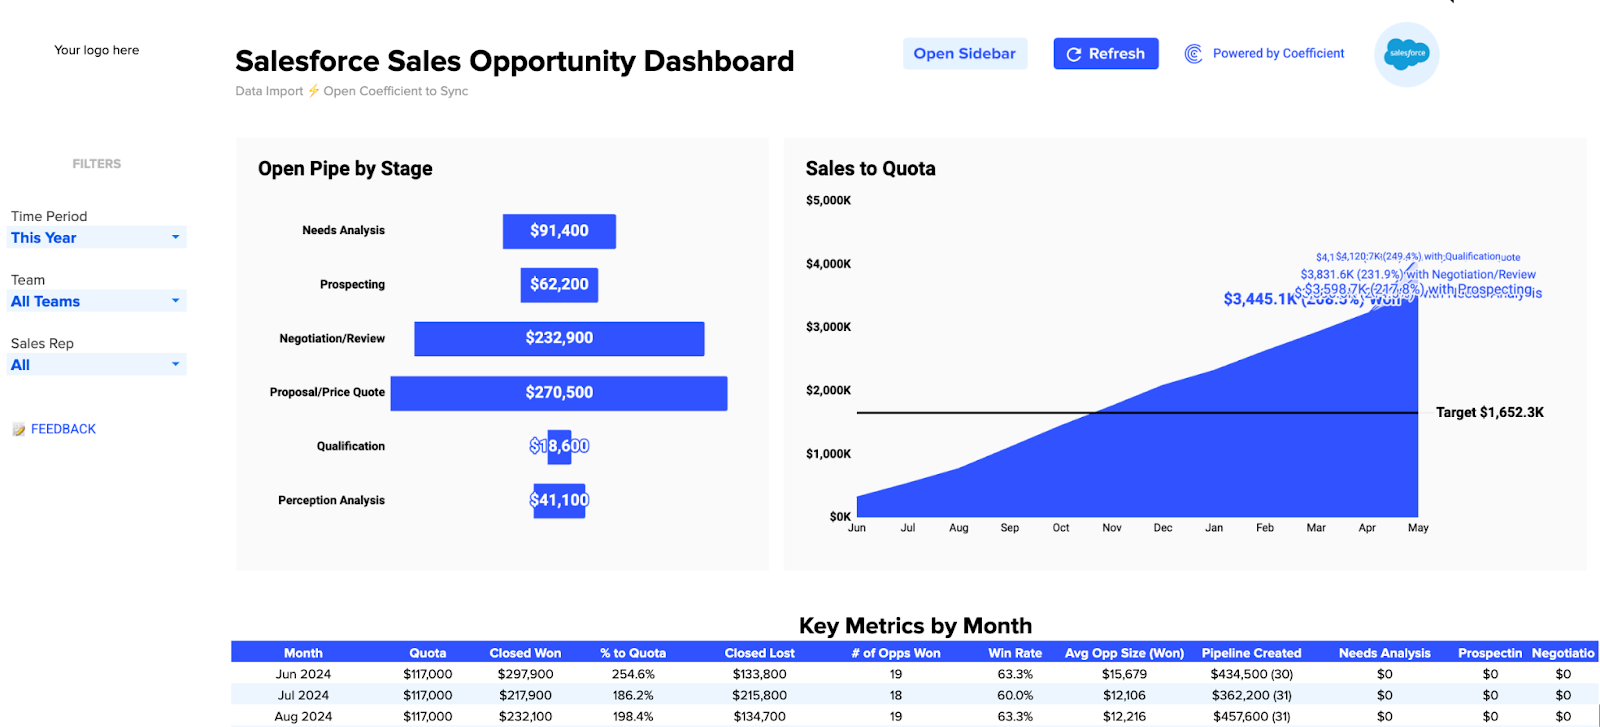
Opportunity dashboards put your entire pipeline at your fingertips. They track deal progression, show upcoming closes, and alert you to stalled opportunities before they die.
Get complete visibility into your sales pipeline. Install the Sales Opportunity Dashboard template and never miss a deal signal again.
Key Metrics to Track in a Sales Pipeline
Focus on these critical pipeline metrics to maintain sales health:
- Pipeline Value – The total potential revenue in your pipeline. Track this by stage to identify where deals cluster or stall.
- Win Rate – The percentage of opportunities that close as won deals. Calculate this overall and by stage to spot conversion problems.
- Average Deal Size – The typical revenue value of your closed deals. Monitor this to detect shifts in your market positioning.
- Sales Velocity – How quickly deals move through your pipeline. Faster velocity means more efficient selling and faster revenue recognition.
- Sales Cycle Length – The average time from opportunity creation to close. Shorter cycles generally indicate more efficient sales processes.
- Pipeline Coverage – The ratio of pipeline value to quota. Most teams aim for 3-4x coverage to ensure they hit targets despite normal deal attrition.
What is a Sales Funnel?
[Visualization: Inverted triangle/funnel with widest section at top (Awareness) narrowing down through stages to smallest section at bottom (Purchase), with icons representing decreasing number of prospects at each narrowing stage]
A sales funnel visualizes how prospects move from awareness to purchase. It narrows as people drop off at each stage, helping you identify and fix conversion problems.
Sales Funnel Stages
The classic sales funnel includes these key stages:
- Awareness – Prospects discover your brand through marketing, social media, or word-of-mouth. This widest part of the funnel captures attention but has minimal qualification.
- Interest – Curious prospects engage with your content, sign up for newsletters, or download resources. They’re evaluating whether your solution addresses their needs.
- Consideration – Engaged prospects actively compare your offering against alternatives. They attend demos, request pricing, and evaluate features more critically.
- Intent – Serious buyers show strong purchase signals through actions like starting free trials, requesting proposals, or initiating buying conversations.
- Evaluation – Decision-makers conduct final assessments, including technical reviews, stakeholder buy-in, and contract negotiations.
- Purchase – The prospect becomes a customer by signing agreements and making payment. This narrowest part of the funnel represents successful conversions.
- Loyalty/Advocacy – Post-purchase engagement that drives retention and referrals. Some modern funnels include this stage to emphasize customer lifetime value.
Key Metrics to Track in a Sales Funnel
Monitor these critical funnel metrics to optimize your conversion journey:
- Conversion Rate – The percentage of prospects who move from one funnel stage to the next. Track this between all adjacent stages to find where prospects get stuck.
- Cost Per Acquisition (CPA) – The total marketing and sales cost divided by the number of new customers. Lower CPAs indicate more efficient funnels.
- Time in Stage – How long prospects typically spend at each funnel stage. Extended dwell times may signal friction points needing attention.
- Drop-off Rate – The percentage of prospects who exit the funnel at each stage. High drop-offs indicate potential problems with messaging or experience.
- Lead Value – The projected revenue from leads at each funnel stage. This helps prioritize which prospects deserve more attention.
- Return on Ad Spend (ROAS) – The revenue generated divided by advertising costs. This measures the effectiveness of your top-of-funnel investments.
Take your sales operations to the next level
The difference is clear: pipelines track your sales process while funnels track your buyer’s journey. Both provide critical visibility, but they answer different questions. Pipelines tell you where deals stand and what revenue to expect. Funnels reveal how effectively you convert prospects into customers.
Most successful sales organizations use both frameworks. They build pipelines to manage day-to-day sales activities and forecast accurately. They analyze funnels to optimize conversion rates and improve the buyer experience.
The real challenge? Keeping this data accurate, accessible, and actionable. That’s where Coefficient shines. By connecting your CRM directly to spreadsheets, you can build live dashboards that update automatically. No more manual exports or stale data.
Ready to transform how you track pipelines and funnels? Get started with Coefficient today and put real-time sales data at your fingertips.
FAQs
What is a sales pipeline and funnel?
A sales pipeline tracks individual deals moving through your sales process stages. It focuses on sales activities and forecasting. A sales funnel tracks how many prospects move through each stage of the buyer journey. It focuses on conversion rates and customer acquisition efficiency.
What are the 5 stages of the sales funnel?
The five core stages of a sales funnel are: 1) Awareness – prospects discover your brand, 2) Interest – prospects engage with your content, 3) Consideration – prospects evaluate your solution, 4) Intent – prospects show buying signals, and 5) Purchase – prospects become customers by making a purchase.
What is a sales funnel?
A sales funnel is a visual representation of the customer journey from initial awareness to purchase. It’s called a “funnel” because it naturally narrows as prospects drop out at each stage. Marketing and sales teams use funnels to identify conversion bottlenecks, optimize messaging, and improve the overall buying experience.