


Table of Contents
![]()
- 1. How to Build a Sales Pipeline with Advanced Workflows – Tips for RevOps Teams
- 2. Best Practices for Sales Pipeline Management – Tips from RevOps Leaders
- 3. How to Increase Sales Velocity with Automations & AI
- 4. Top 10 Tips to Grow your Sales Pipeline in the AI Era from Sales Leaders
- 5. How to Build and Manage a SaaS Sales Pipeline
- 6. Sales Pipeline Stages in Salesforce: Guide for RevOps Teams
-
7. Sales Pipeline Stages in HubSpot: Setup, Best Practices & Templates
- How to set up pipeline stages in HubSpot
- 7 Best practices to follow in using HubSpot pipeline stages
- Limitations of pipeline management in HubSpot
- How 5,000+ RevOps practitioners automate pipeline tracking in spreadsheets
- How to set up a pipeline dashboard in spreadsheets
- Take your pipeline to the next level
- FAQs
- 8. Sales Pipeline vs Sales Funnel: What’s the Difference?


Your sales pipeline is the heartbeat of your revenue operation. It tells a story. The story of how your deals move from first contact to closed revenue. HubSpot’s pipeline stages help structure this journey, but many teams struggle to maximize their potential.
Let’s explore how to set up, optimize, and automate your HubSpot sales pipeline stages—and then take them to the next level.
How to set up pipeline stages in HubSpot
Creating effective pipeline stages in HubSpot takes just a few minutes. Here’s how to do it:
- Navigate to your HubSpot account and click the settings icon in the top-right corner
- Under “Objects,” select “Deals”
- Click “Pipelines” in the left sidebar
- Select “Create Pipeline” or edit an existing one
- Add your desired stages by clicking “Add Stage”
- Name each stage and set the win probability percentage
- Arrange the stages in the correct order using drag-and-drop
- Click “Save” when finished
Each stage represents a distinct step in your sales process. Think carefully about what truly constitutes movement in your sales cycle. Too many stages creates confusion; too few lacks visibility.
7 Best practices to follow in using HubSpot pipeline stages
#1 Define clear stage criteria (entry/exit conditions)
Ambiguity kills pipeline accuracy. Create specific, objective criteria for when deals enter and exit each stage. This prevents salespeople from interpreting stages differently, which leads to inconsistent reporting and forecasting.
#2 Set consistent naming conventions for ease of reporting
Names matter. Choose clear, sequential stage names that everyone understands. “Discovery,” “Proposal,” and “Negotiation” tell a more intuitive story than “Stage 1,” “Stage 2,” and “Stage 3.” Consistent naming makes reporting simpler and more insightful.
#3 Assign default deal owners by stage or pipeline
Accountability drives action. Setting default owners for each stage ensures nothing falls through the cracks. This is especially valuable when deals transition between teams, like from SDRs to AEs or from sales to implementation.
#4 Use automation to update stages based on activity
Manual updates waste time and create data gaps. Set up HubSpot workflows to automatically move deals between stages based on specific actions or properties. For example, when a proposal is sent, the deal can automatically advance to the “Proposal” stage.
This is where Coefficient adds tremendous value. Beyond HubSpot’s native features, you can create custom Slack alerts that notify team members when deals move between stages. These real-time notifications keep everyone aligned without constant CRM checking.
#5 Regularly audit stale or inactive deals
Zombie deals distort your pipeline. Establish a process to identify and address deals that haven’t progressed in a specified timeframe. This keeps your pipeline clean and your forecasts accurate.
Coefficient makes pipeline cleanup effortless by pulling HubSpot data directly into spreadsheets for bulk analysis and updates. See how easy it is:
#6 Customize pipeline views for different teams (SDR, AE, CS)
One view doesn’t fit all. Different teams need different perspectives on the pipeline. SDRs focus on early stages, AEs on middle and closing stages, and CS on onboarding and expansion opportunities.
With Coefficient, you can create custom pipeline reports for each team, automatically refresh them with live data, and share them via Slack or email on a schedule. This ensures everyone has the information they need without building separate reports manually.
#7 Integrate with reporting tools
Pipeline data in isolation limits its value. Connect your HubSpot pipeline to powerful analytics tools to gain deeper insights into stage movement, deal velocity, and forecast accuracy.
Tools like Coefficient let you track these metrics in real time using familiar spreadsheets. This combines the flexibility of Excel or Google Sheets with the power of live HubSpot data—no manual exports required.
Limitations of pipeline management in HubSpot
HubSpot offers solid pipeline features, but several limitations persist:
- Limited cross-object reporting – Connecting pipeline data with marketing activities or customer success metrics often requires workarounds
- Inflexible visualization options – The standard views work for basic needs but lack customization for complex sales processes
- Manual refresh requirements – Reports don’t automatically update in real-time without additional tools
- Cumbersome bulk editing – Making mass changes to deals across stages can be time-consuming
How 5,000+ RevOps practitioners automate pipeline tracking in spreadsheets
Spreadsheets remain the universal language of business. When enhanced with Coefficient, they become powerful pipeline management tools.
- Real-time data access transforms decision-making. Instead of exporting data that’s instantly outdated, Coefficient creates a live connection between HubSpot and your spreadsheets. Your pipeline data refreshes automatically—hourly, daily, or on demand.
- Formula flexibility enables deeper analysis. While HubSpot’s native reporting has limitations, spreadsheets let you calculate anything. Track conversion rates between specific stages, measure velocity by rep or territory, or create weighted forecasts using custom logic.
- Custom dashboards provide clearer visibility. Build exactly what your executives and teams need to see. Segment by product line, geography, or deal size with familiar spreadsheet tools rather than learning complex BI platforms.
- Two-way sync eliminates double work. Not only can you pull HubSpot data into spreadsheets, but you can also push updates back to HubSpot. Update multiple deals simultaneously without switching between systems.
The result? Pipeline management that’s both more powerful and more familiar. Your team works in tools they already know while eliminating the manual effort of traditional reporting.
How to set up a pipeline dashboard in spreadsheets
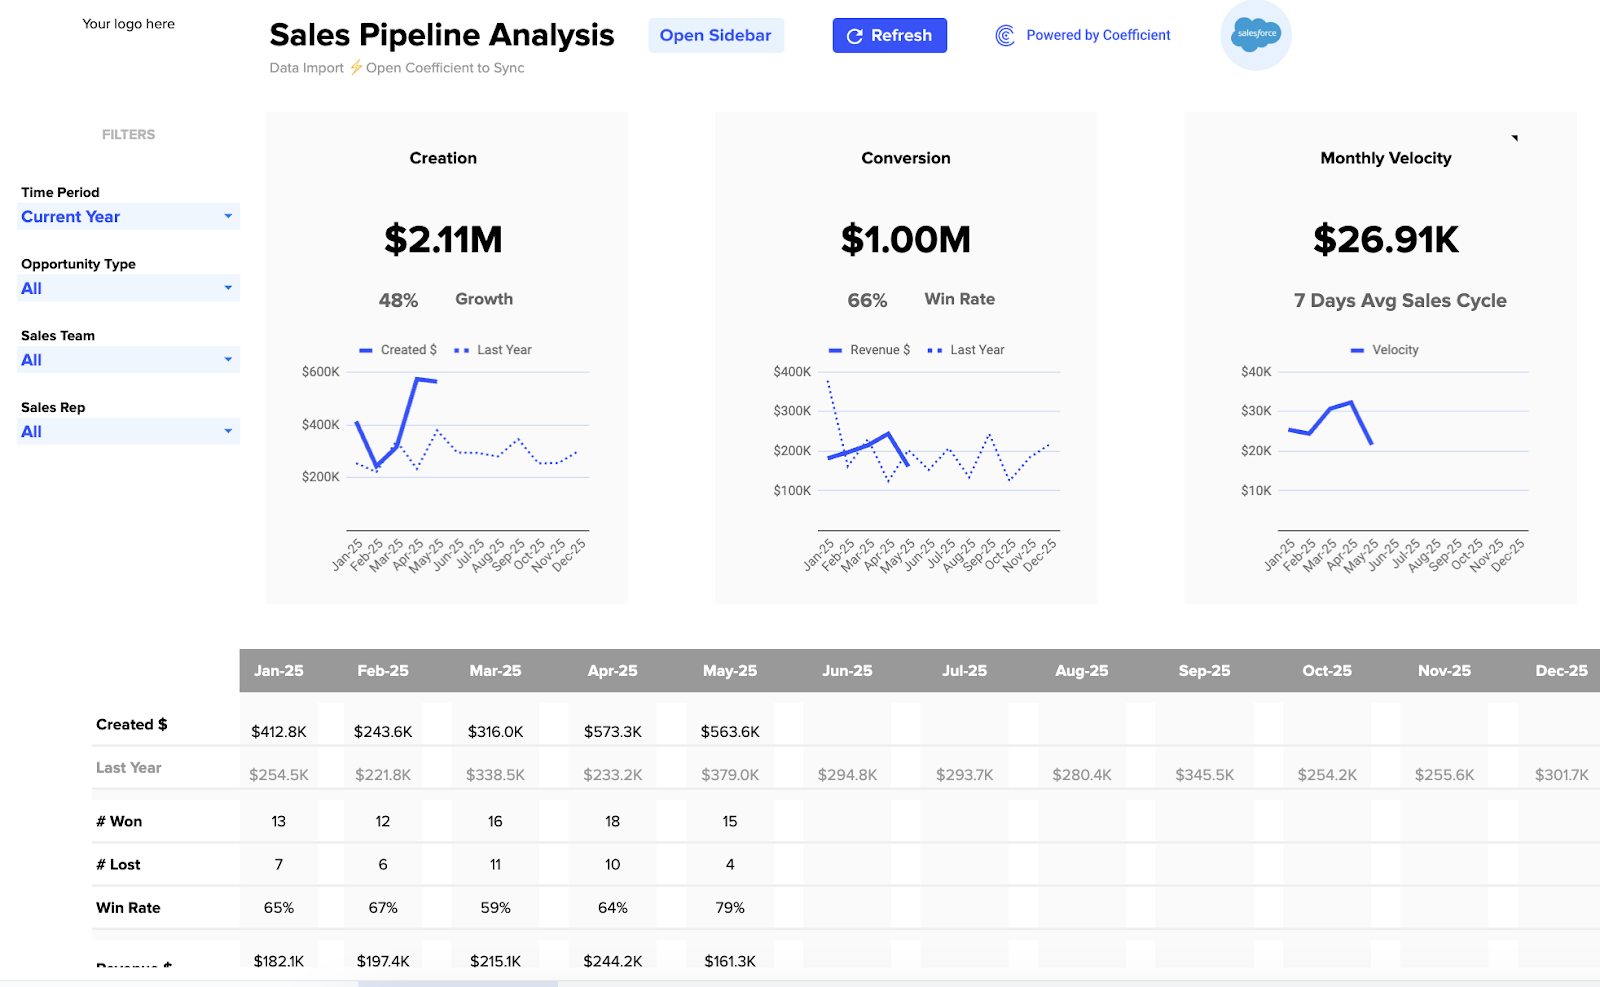
HubSpot Pipeline Report dashboards deliver instant insights into your pipeline health, conversion rates, and forecasted revenue. They automatically refresh with live data from HubSpot, saving hours of manual reporting.
Prefer to do things manually? Here’s how to build your own pipeline dashboard in just minutes:
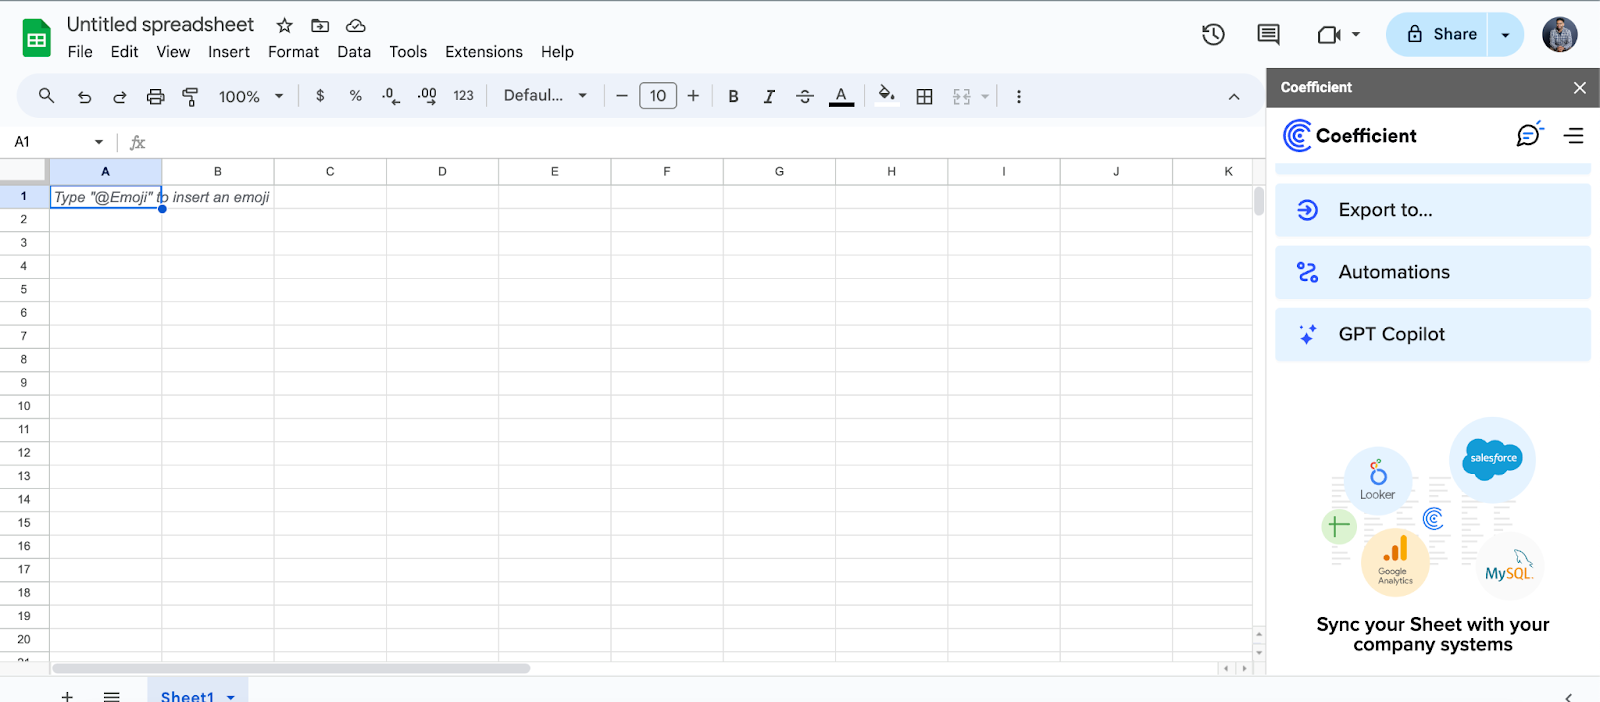
- Install Coefficient in Google Sheets
- Open Google Sheets and go to Extensions → Add-ons → Get add-ons
- Search for “Coefficient” and install the add-on
- Launch Coefficient from Extensions → Coefficient → Launch
- Import HubSpot pipeline data
- Click “Import from…” in the Coefficient sidebar
- Select HubSpot as your data source
- Choose “Deals” as your object
- Select relevant fields (Stage, Amount, Close Date, Owner, etc.)
- Set filters if needed (e.g., deals created in the last 90 days)
- Import the data to your sheet
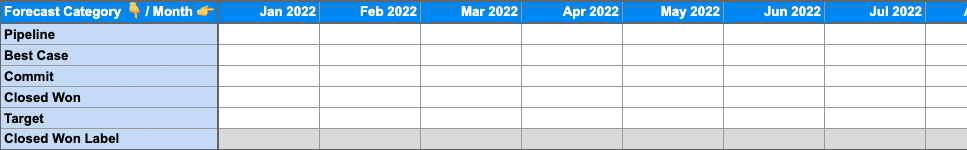
- Create your pipeline summary table
- Build a table with stages as rows and time periods as columns
- Use formulas to calculate totals for each stage and period
- Add conversion rates between stages
- Add visualizations
- Create a funnel chart showing deal count by stage
- Add a line chart tracking pipeline growth over time
- Build a bar chart comparing forecasted vs. actual closed revenue
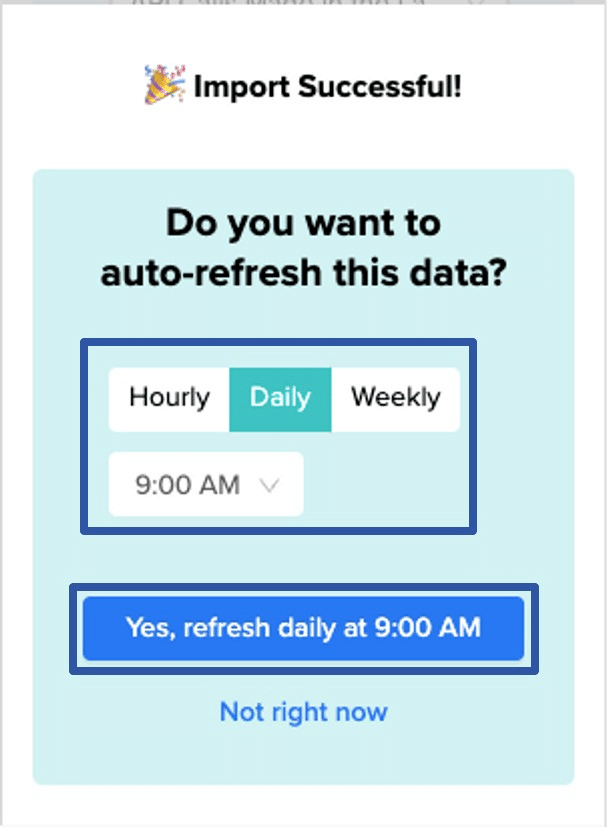
- Set up automatic refreshes
- Configure Coefficient to refresh your data hourly, daily, or weekly
- Schedule report delivery via email or Slack
Prefer a visual guide? Here’s a video guide to help you build your pipeline tracker:
This step-by-step video shows you how to create a visual representation of your HubSpot sales pipeline that updates automatically throughout the year. Follow along to build professional-grade pipeline tracking without complex tools.
Take your pipeline to the next level
HubSpot’s pipeline stages provide a solid foundation for sales tracking. But the real magic happens when you connect that data to flexible, familiar tools.
Effective pipeline management combines clear stage definitions, consistent processes, and the right technology. By following the best practices outlined here and leveraging Coefficient to connect HubSpot with your spreadsheets, you’ll gain unprecedented visibility into your sales motion.
Your pipeline isn’t just a reporting tool—it’s a strategic asset. Treat it that way by building systems that reveal insights, not just numbers.
Ready to transform how you manage your HubSpot pipeline? Get started with Coefficient today and build your first automated pipeline dashboard in minutes.
FAQs
What are the default pipeline stages in HubSpot?
HubSpot’s default sales pipeline includes seven stages: Appointment Scheduled, Qualified to Buy, Presentation Scheduled, Decision Maker Bought-In, Contract Sent, Closed Won, and Closed Lost. However, these can be customized completely to match your specific sales process.
What are the 4 stages of the sales cycle?
While sales cycles vary by industry and company, the four fundamental stages are: Prospecting (finding potential customers), Qualification (determining if prospects have need, budget, and authority), Proposal (presenting your solution), and Closing (finalizing the agreement). HubSpot pipeline stages should align with your specific sales cycle.
How to see deal stages in HubSpot?
To view deal stages in HubSpot, navigate to Sales → Deals in the main navigation. The default view shows your deals organized by stage in a board layout. You can also view deals in a table format by clicking the “Table” button. For customized views, use the “Board Actions” dropdown to filter by owner, date, or other properties.
