


Average Profit Margin = (Total Profit / Total Revenue) * 100
In the dynamic world of Software as a Service (SaaS), maintaining a healthy profit margin is essential for long-term success. One of the key metrics that can provide valuable insights into the financial health and efficiency of your SaaS business is the Average Profit Margin.
By understanding and optimizing this crucial metric, you can unlock new avenues for sustainable growth and profitability.
What is Average Profit Margin?
Average Profit Margin is a financial metric that measures the percentage of revenue that a SaaS company retains as profit after accounting for all the costs associated with delivering its products and services. It provides a clear indication of the overall profitability and efficiency of the business.
How to Calculate Average Profit Margin
To calculate Average Profit Margin, you’ll need to track the following metrics:
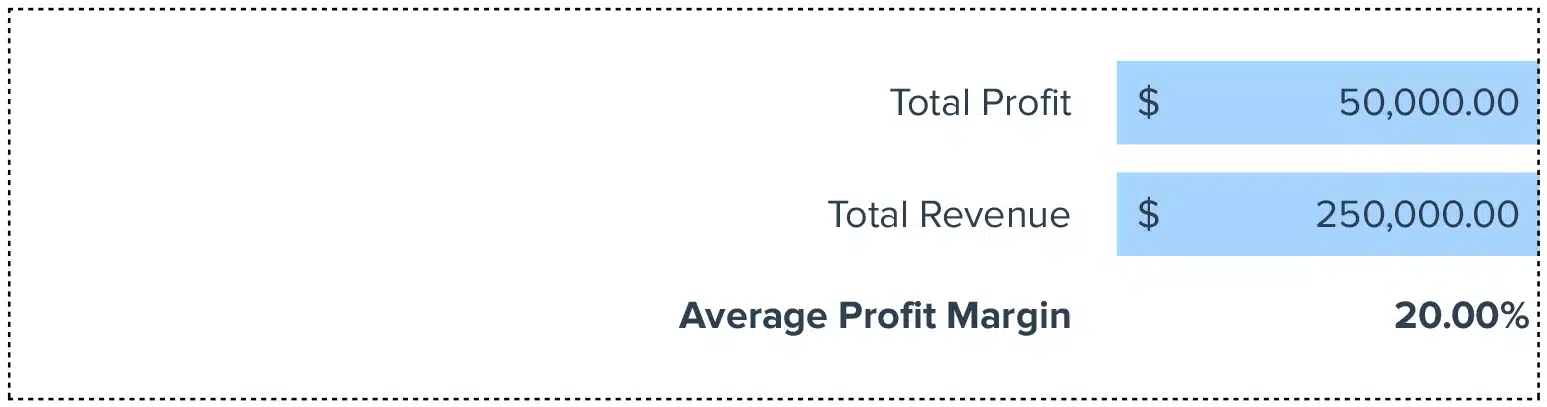
- Total Profit: The total amount of revenue remaining after deducting all the expenses (including cost of goods sold, operating expenses, and other costs) from the total revenue.
- Total Revenue: The overall revenue generated by your SaaS business.
These metrics are typically managed by the Finance team within a SaaS organization.
Example Calculation of Average Profit Margin
Let’s say your SaaS company’s total revenue for the month is $100,000, and the total profit after deducting all expenses is $40,000. To calculate the Average Profit Margin, you would use the following formula:
Average Profit Margin = ($40,000 / $100,000) * 100 = 40%
This means that your SaaS business is retaining 40% of its revenue as profit.
Importance of Average Profit Margin for SaaS Businesses
Average Profit Margin is a crucial metric for SaaS businesses for several reasons:
- Profitability and Sustainability: A healthy Average Profit Margin indicates that your SaaS business is generating sufficient profits to sustain and reinvest in its operations, driving long-term growth and success.
- Pricing and Competitiveness: Monitoring your Average Profit Margin can help you optimize your pricing strategy, ensuring that you’re striking the right balance between revenue and profitability.
- Investor Attractiveness: SaaS businesses with consistently high Average Profit Margins are often viewed more favorably by investors, as they demonstrate the financial stability and growth potential of the company.
- Operational Efficiency: A high Average Profit Margin can be a signifier of operational efficiency, as it indicates that you’re effectively managing your costs and delivering value to your customers.
Is a Profit Margin of 40% Good?
In the SaaS industry, a profit margin of 40% is generally considered a healthy and respectable level. This indicates that the business is generating significant profits and has a strong financial foundation to support its growth and reinvestment efforts.
Is a 60% Profit Margin Good?
A profit margin of 60% or higher is often seen as an excellent and highly profitable level for a SaaS business. This level of profitability suggests that the company has a robust business model, efficient operations, and the ability to command premium pricing for its products and services.
What is a Good Ratio for Profit Margin?
The ideal ratio for profit margin can vary depending on the specific industry and business model of a SaaS company. However, as a general rule of thumb, a profit margin between 30% to 50% is considered a good range for most successful SaaS businesses. This level of profitability allows for sustainable growth, reinvestment, and the ability to withstand market fluctuations.
Strategies to Improve Average Profit Margin
To improve your Average Profit Margin, consider the following strategies:
- Optimize Pricing: Regularly review and adjust your pricing structure to ensure that you’re maximizing the value you provide to your customers while maintaining a healthy profit margin.
- Streamline Operations: Identify and eliminate inefficiencies in your business processes, such as reducing overhead costs, automating tasks, and optimizing resource allocation.
- Leverage Technology: Invest in tools and technologies that can help you automate and optimize your business operations, reducing costs and improving overall efficiency.
- Enhance Product and Service Offerings: Continually evaluate and enhance your product and service offerings to provide more value to your customers, enabling you to command higher prices and maintain a stronger profit margin.
- Focus on High-Margin Customers: Identify and prioritize your most profitable customer segments, tailoring your sales and marketing efforts to acquire and retain these high-value accounts.
Calculating Average Profit Margin in Google Sheets
To make it easy for you to calculate and track your Average Profit Margin, we’ve created a Google Sheets template that you can use. Here’s a step-by-step guide on how to use it:
- Access the Template: Click above to access the Average Profit Margin Google Sheets template.
- Enter Your Data: In the “Data” sheet, input the following information:
- Total Profit
- Total Revenue
- Review the Calculations: The template will automatically calculate your Average Profit Margin based on the data you provided.
- Analyze and Interpret the Results: Use the insights gained from your Average Profit Margin to inform your pricing, operational, and product strategies, enabling you to drive sustainable profitability and growth for your SaaS business.
By leveraging this Google Sheets template, you can effortlessly track and optimize your Average Profit Margin, empowering you to maximize the financial health and long-term success of your SaaS venture.
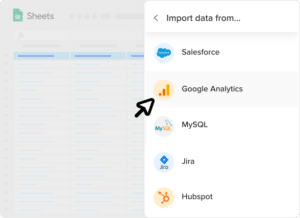 Sync Live Data into Your Spreadsheet


