Stripe has become a cornerstone in payment processing for businesses worldwide. As companies rely more on digital transactions, the need for accurate financial reporting has never been more critical. Proper reporting not only aids in financial reconciliation but also provides valuable business intelligence.
This guide will walk you through the essentials of Stripe reporting in 2025, helping you make the most of your financial data.
Essential Stripe Report Types
Balance Reports
Balance reports in Stripe offer a snapshot of your account’s financial health. These reports typically include:
- Available balance
- Pending balance
- Reserved funds
Balance reports help you track cash flow and plan for upcoming expenses or investments.
Payout Reports
Payout reports are crucial for reconciling your Stripe account with your bank statements. They provide:
- Detailed transaction listings
- Fee breakdowns
- Net payout amounts
These reports ensure you can account for every dollar moving through your Stripe account.
Transaction Reports
Transaction reports offer a comprehensive view of your payment history. They include:
- Individual payment details
- Refund information
- Associated fees
These reports are essential for tracking sales trends and resolving customer inquiries.
Tax Reports
For businesses dealing with complex tax situations, Stripe’s tax reports are invaluable. They feature:
- 1099-K reporting for marketplaces and platforms
- Sales tax collection data
- VAT and GST information for international sellers
Stripe Reporting Features by Pricing Tier
|
Feature |
Standard |
Premium |
Custom |
|---|---|---|---|
|
Basic Reports |
✓ |
✓ |
✓ |
|
Custom Reports |
– |
✓ |
✓ |
|
API Access |
Limited |
Full |
Full |
|
Data Retention |
2 years |
7 years |
Customizable |
|
Support |
Standard |
Priority |
Dedicated |
Exporting Reports From Stripe
Native Export Options
CSV Download Process
- Access your report:
- Open the Stripe Dashboard
- Click “Reports” in the left sidebar
- Select your saved report or create a new one
- Set export parameters:
- Choose your date range
- Apply any necessary filters
- Select all columns you want to include
- Export your data:
- Click the “Export” button in the top right
- Select CSV format
- Choose your row limit (up to 100,000 rows)
- Wait for the export to process
- Download when ready
Excel Compatibility Steps
- Open your CSV file in Excel:
- Launch Excel
- Select “File” > “Open”
- Choose “All Files” to see CSV
- Select your Stripe export
- Format your data:
- Use “Text to Columns” under the Data tab
- Select “Delimited”
- Check the “Comma” delimiter box
- Preview the results
- Click “Finish”
- Clean up your data:
- Format date columns appropriately
- Adjust currency columns to show proper symbols
- Set number formatting for amount columns
- Freeze the header row for easier viewing
PDF Export Process
- Generate PDF reports:
- Select your report
- Click “Export”
- Choose PDF format
- Select page orientation
- Pick your preferred paper size
- Customize PDF layout:
- Choose which columns to include
- Set page breaks
- Add headers and footers
- Include report metadata
API Export Capabilities
For more advanced users, Stripe’s API offers powerful export options:
Basic API Integration Setup
1. Get your API credentials:
- Go to Developers > API keys in Stripe Dashboard
- Copy your secret key
- Store it securely in your environment variables
2. Install Stripe’s library:
# Python example
pip install stripe
import stripe
stripe.api_key = ‘your_secret_key’
3. Make your first API call:
# Fetch all charges from the last 30 days
charges = stripe.Charge.list(
created={
‘gte’: int(time.time()) – 30*24*60*60
}
)
4. Handle pagination:
# Get all results
all_charges = []
for charge in charges.auto_paging_iter():
all_charges.append(charge)
Available Data Points Through API
- Transaction data:
- Payment amounts
- Fees
- Currency conversions
- Payment methods
- Success/failure status
- Customer information:
- Contact details
- Payment history
- Saved payment methods
- Subscription status
- Subscription details:
- Plan information
- Billing cycles
- Usage data
- Upcoming invoices
- Additional endpoints:
- Refunds
- Disputes
- Payouts
- Balance transactions
- Transfer records
- Metadata and custom fields:
- User-defined data
- Internal reference numbers
- Custom categorization
- Business-specific identifiers
Coefficient Integration
Coefficient takes your Stripe reporting to new heights with:
- Real-Time Data Syncing: Ensure your reports always reflect the most up-to-date information.
- Automated Refresh Schedules: Set up automatic data refreshes to save time and effort.
- Custom Dashboard Templates: Leverage pre-built templates to create stunning dashboards quickly.
Building a Custom Report in Stripe
Creating custom reports in Stripe requires attention to detail. Here’s a complete walkthrough:
- Sign in to your Stripe Dashboard
- Select “Reports” from the left sidebar
- Click “Create custom report” in the top right corner
- Choose your report type:
- Payments and refunds
- Payouts
- Balance
- Tax
- Revenue recognition
- Set your date parameters:
- Click the date field
- Select a preset range or specify custom dates
- Choose your timezone if needed
- Add your desired columns:
- Click “Add columns”
- Select from categories like Transaction Details, Customer Info, or Payment Method
- Arrange columns by dragging them into your preferred order
- Apply filters to focus your data:
- Click “Add filter”
- Select filter type (e.g., Payment Status, Currency, Amount)
- Set filter conditions (equals, contains, greater than, etc.)
- Add multiple filters using AND/OR logic
- Save your report:
- Click “Save report” in the top right
- Name your report
- Add a description (optional)
- Choose sharing settings if needed
Advanced Reports & Dashboards in Stripe
Let’s create a detailed monthly revenue analysis report as an example:
- Start a new custom report:
- Choose “Payments and refunds” as your base report
- Set date range to “Last 12 months”
- Add essential revenue columns:
- Payment amount
- Net amount (after fees)
- Currency
- Payment status
- Customer email
- Payment method types
- Set up revenue grouping:
- Click “Group by”
- Select “Month” as primary grouping
- Add “Payment method” as secondary grouping
- Create targeted filters:
- Filter 1: Status = “Succeeded”
- Filter 2: Currency = Your primary currency
- Filter 3: Amount > 0
- Add calculations:
- Sum of total revenue
- Average transaction value
- Transaction count
- Success rate percentage
- Customize visualization:
- Select “Chart view”
- Choose “Bar chart” for monthly trends
- Add a line overlay for cumulative revenue
- Color-code by payment method
- Set up regular updates:
- Enable auto-refresh (hourly or daily)
- Schedule email delivery to stakeholders
- Configure Slack notifications for significant changes
- Add comparison features:
- Enable month-over-month comparison
- Show percentage changes
- Highlight significant variations
This report will show your revenue trends, payment method distribution, and growth patterns in one view. You can modify these steps to create reports for other metrics like refunds, disputes, or customer acquisition.
Automating Stripe Reporting
Scheduled Exports
Streamline your reporting process through automation:
- Scheduled Exports: Set up automatic report exports at regular intervals.
- API Integration Options: Integrate Stripe with other tools using API connections.
To set up set up recurring reports:
- Choose your report type
- Set the frequency (daily, weekly, monthly)
- Select recipients for email distribution
- Pick your preferred format (CSV, PDF)
Coefficient Automation Features
Coefficient takes automation further:
- Slack notifications for report updates
- Email alerts for key metric changes
- Scheduled data refreshes in your spreadsheets
Overcoming Stripe Reporting Limitations
While Stripe’s native reporting features are valuable, they come with some limitations:
- Manual Export Requirements: Exporting reports manually can be time-consuming.
- Limited Customization Options: Customization options for reports may be restricted.
- Basic Visualization Tools: The built-in visualization tools may lack advanced features.
- Time-Consuming Data Refresh Process: Refreshing data manually can be a tedious task.
Coefficient addresses these limitations by providing real-time data syncing, advanced customization options, powerful visualization tools, and automated data refreshes.
Free Stripe Reporting Dashboards
To help you get started with advanced Stripe reporting, Coefficient offers several pre-built dashboard templates:
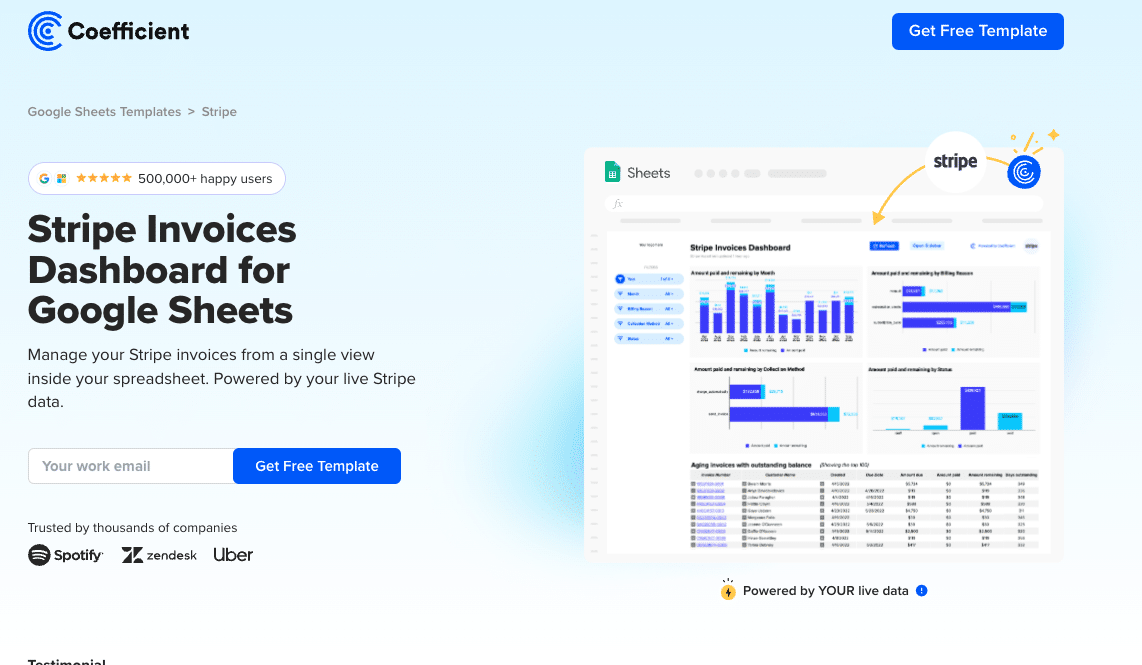
#1: Stripe Invoices Dashboard

Use Case
The Stripe Invoices Dashboard centralizes your payment monitoring in one location, helping finance teams track and manage accounts receivable. By connecting directly to Stripe, this dashboard provides a complete view of invoice status and payment trends, allowing you to maintain healthy cash flow and reduce collection delays.
Metrics Tracked
- Monthly invoice and payment history
- Total paid amounts
- Remaining payment totals
- Billing categories
- Collection methods
- Payment status tracking
Get the Stripe Invoices Dashboard Template
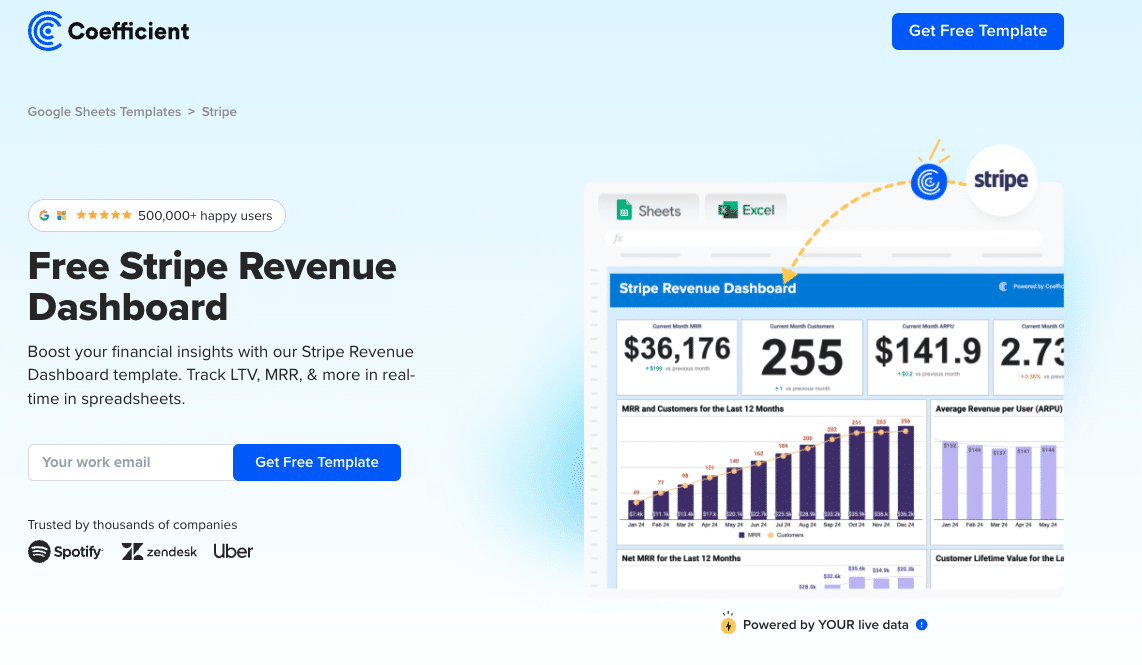
#2: Stripe Revenue Dashboard

Use Case
The Stripe Revenue Dashboard gives finance teams and business leaders immediate visibility into their company’s financial performance. This comprehensive view combines critical revenue metrics with detailed customer data, enabling quick identification of growth opportunities and potential challenges.
Metrics Tracked
- Lifetime Value (LTV)
- Net Monthly Recurring Revenue
- Average revenue per account
- Total customer count
- MRR trends
- MRR upgrades
Get the Stripe Revenue Dashboard Template
#3: Stripe MRR Dashboard

Use Case
The Stripe MRR Dashboard serves subscription-based businesses that need to monitor their recurring revenue patterns. Finance teams and SaaS companies use this dashboard to track subscription health, analyze customer behavior, and forecast future revenue with greater accuracy.
Metrics Tracked
- Monthly Recurring Revenue (MRR)
- Churn MRR
- Expansion MRR
- New MRR
- Active subscriptions
- Gross volume trends
- New customer acquisition
- Discount impact analysis
Get the Stripe MRR Dashboard Template
#4: eCommerce Dashboard

Use Case
The eCommerce Dashboard combines Stripe and QuickBooks data to provide online retailers with a complete financial overview. Store owners and eCommerce managers use this dashboard to monitor sales performance, track expenses, and maintain optimal inventory levels.
Metrics Tracked
- Total sales from Stripe
- Order volume
- Average order value
- Expenses by category
- Net profit calculations
- Customer retention rates
- Product performance metrics
Get the eCommerce Dashboard Template
#5: Cashflow Forecast Dashboard

Use Case
The Cashflow Forecast Dashboard helps businesses predict and prepare for future financial positions. Financial analysts and controllers use this tool to combine subscription revenue data, deal pipeline information, and accounting metrics for accurate cash flow projections.
Metrics Tracked
- Cash inflows by category
- Cash outflows by type
- Net cashflow trends
- Deal pipeline values
- Subscription revenue forecasts
- Accounts receivable aging
- Accounts payable schedule
Get the Cashflow Forecast Dashboard Template
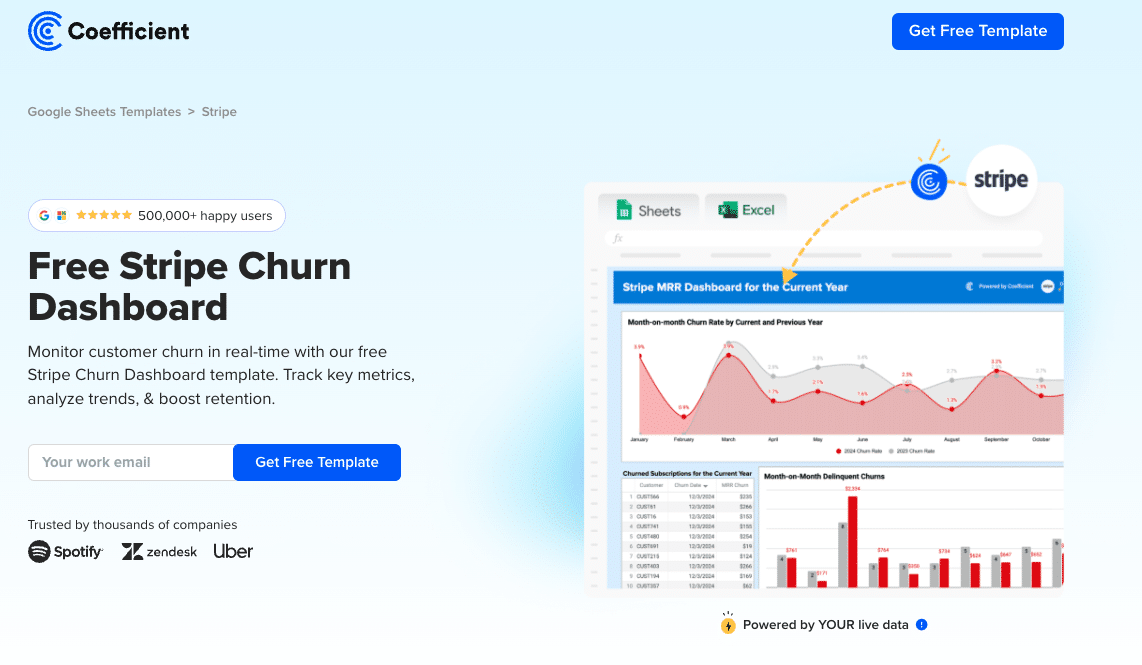
#6: Stripe Churn Dashboard

Use Case
The Stripe Churn Dashboard assists subscription businesses in monitoring and reducing customer attrition. Product teams and customer success managers use this dashboard to identify churn patterns, implement retention strategies, and measure their effectiveness.
Metrics Tracked
- Overall churn rate
- Churned customer count
- Churned MRR (delinquent)
- Plan-specific churn rates
- Customer lifecycle stages
- Retention by segment
Get the Stripe Churn Dashboard Template
#7: Invoice Tracker Dashboard

Use Case
The Invoice Tracker Dashboard helps finance teams maintain precise control over accounts receivable. Accounting professionals use this dashboard to monitor payment statuses, identify late payments quickly, and maintain healthy cash flow through proactive invoice management.
Metrics Tracked
- Payment aging analysis
- Outstanding invoice amounts
- Total paid invoices
- Age of receivables
- Payment status categories
- Customer payment histories
Get the Invoice Tracker Template
Live Stripe Reporting with Coefficient
Stripe’s reporting capabilities, combined with Coefficient’s powerful features, empower businesses to gain valuable insights, streamline their financial reporting processes, and make data-driven decisions. By leveraging the tools and best practices outlined in this guide, you can take control of your financial data and drive your business forward.
Ready to supercharge your Stripe reporting? Get started with Coefficient today!
Further Reading
- Stripe Integration for Google Sheets
- Stripe Integration for Microsoft Excel
- 5 Best Stripe Analytics Tools in 2024
- Top 15 Stripe Apps for Reporting and Analytics
- How to Export Data from Stripe
FAQs
Will Stripe report to IRS?
Yes, Stripe reports to the IRS and provides 1099-K forms for qualifying merchants. Coefficient can help automate tax data tracking and reporting processes.
What is Stripe reporting?
Stripe reporting helps businesses understand and reconcile account activity through summary reports and itemized transaction data. Coefficient enhances these capabilities with real-time syncing and advanced analytics.
How do I report a Stripe business?
You can report concerns about a Stripe business using their Complaint Submission Form or by emailing [email protected]. For secure business reporting and analytics, use Coefficient to monitor your own Stripe data.
Does Stripe report transactions?
Yes, Stripe provides detailed transaction reporting through their Dashboard. With Coefficient, you can automatically sync and analyze these transactions in Google Sheets or Excel.


