


Most finance teams waste hours each week manually pulling data from Stripe into spreadsheets. These seven dashboard templates automatically sync your payment data, giving you instant access to the metrics that matter – from cash flow to subscription analytics. Here’s how to put your financial reporting on autopilot.
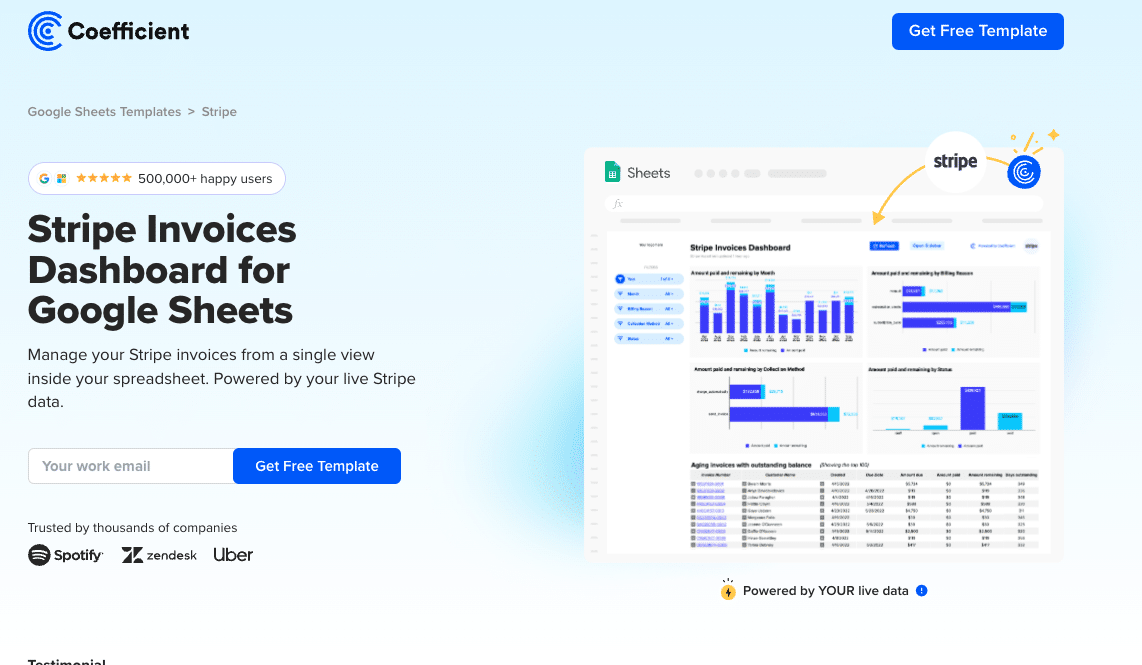
#1: Stripe Invoices Dashboard

Use Case
The Stripe Invoices Dashboard centralizes your payment monitoring in one location, helping finance teams track and manage accounts receivable. By connecting directly to Stripe, this dashboard provides a complete view of invoice status and payment trends, allowing you to maintain healthy cash flow and reduce collection delays.
Metrics Tracked
- Monthly invoice and payment history
- Total paid amounts
- Remaining payment totals
- Billing categories
- Collection methods
- Payment status tracking
Get the Stripe Invoices Dashboard Template
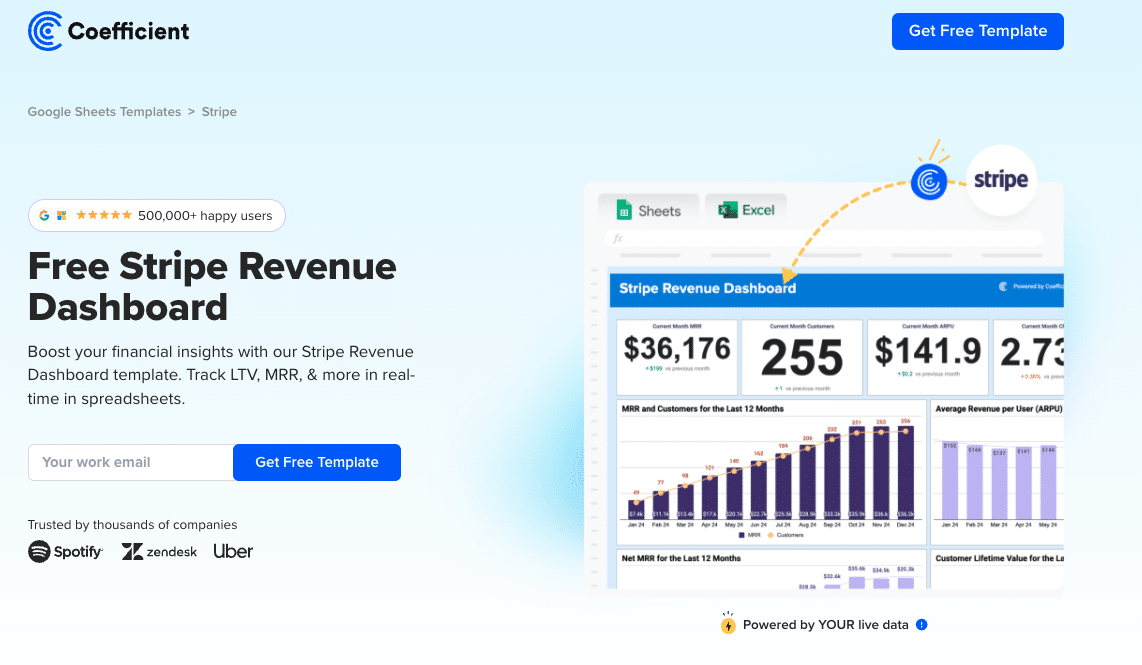
#2: Stripe Revenue Dashboard
Use Case
The Stripe Revenue Dashboard gives finance teams and business leaders immediate visibility into their company’s financial performance. This comprehensive view combines critical revenue metrics with detailed customer data, enabling quick identification of growth opportunities and potential challenges.
Metrics Tracked
- Lifetime Value (LTV)
- Net Monthly Recurring Revenue
- Average revenue per account
- Total customer count
- MRR trends
- MRR upgrades
Get the Stripe Revenue Dashboard Template
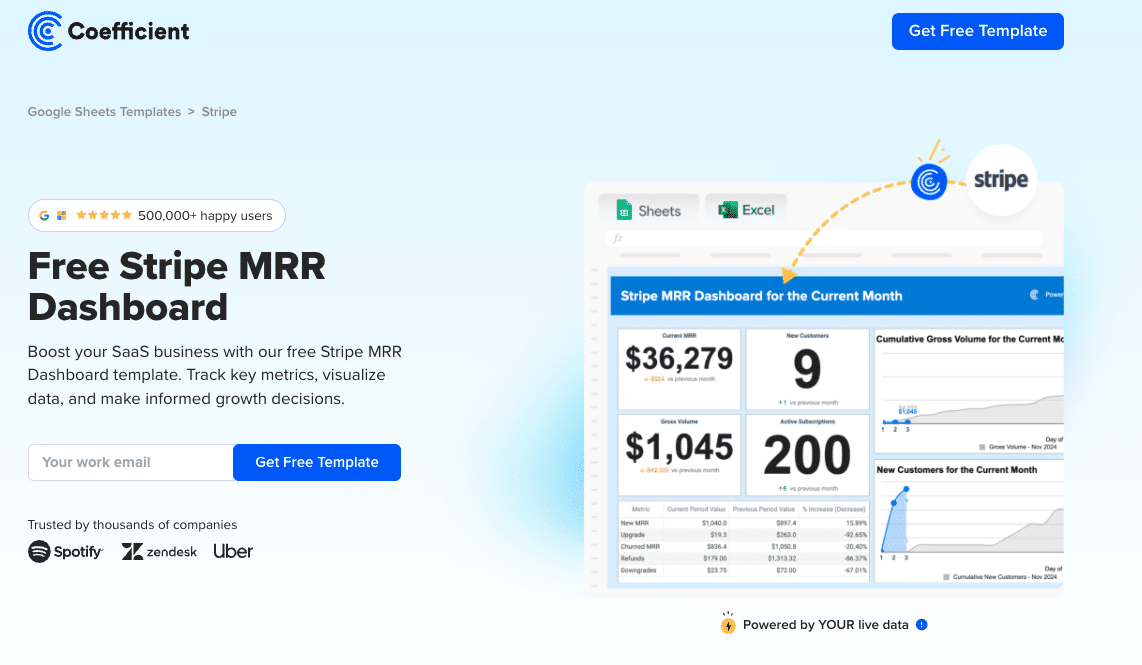
#3: Stripe MRR Dashboard
Use Case
The Stripe MRR Dashboard serves subscription-based businesses that need to monitor their recurring revenue patterns. Finance teams and SaaS companies use this dashboard to track subscription health, analyze customer behavior, and forecast future revenue with greater accuracy.
Metrics Tracked
- Monthly Recurring Revenue (MRR)
- Churn MRR
- Expansion MRR
- New MRR
- Active subscriptions
- Gross volume trends
- New customer acquisition
- Discount impact analysis
Get the Stripe MRR Dashboard Template
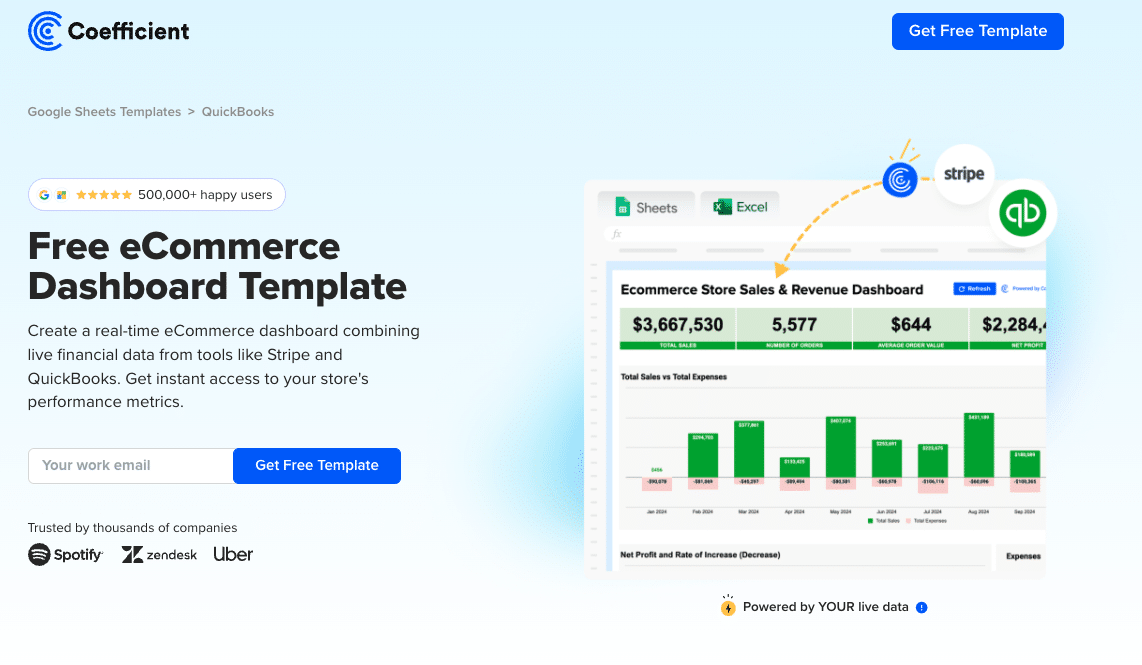
#4: eCommerce Dashboard
Use Case
The eCommerce Dashboard combines Stripe and QuickBooks data to provide online retailers with a complete financial overview. Store owners and eCommerce managers use this dashboard to monitor sales performance, track expenses, and maintain optimal inventory levels.
Metrics Tracked
- Total sales from Stripe
- Order volume
- Average order value
- Expenses by category
- Net profit calculations
- Customer retention rates
- Product performance metrics
Get the eCommerce Dashboard Template
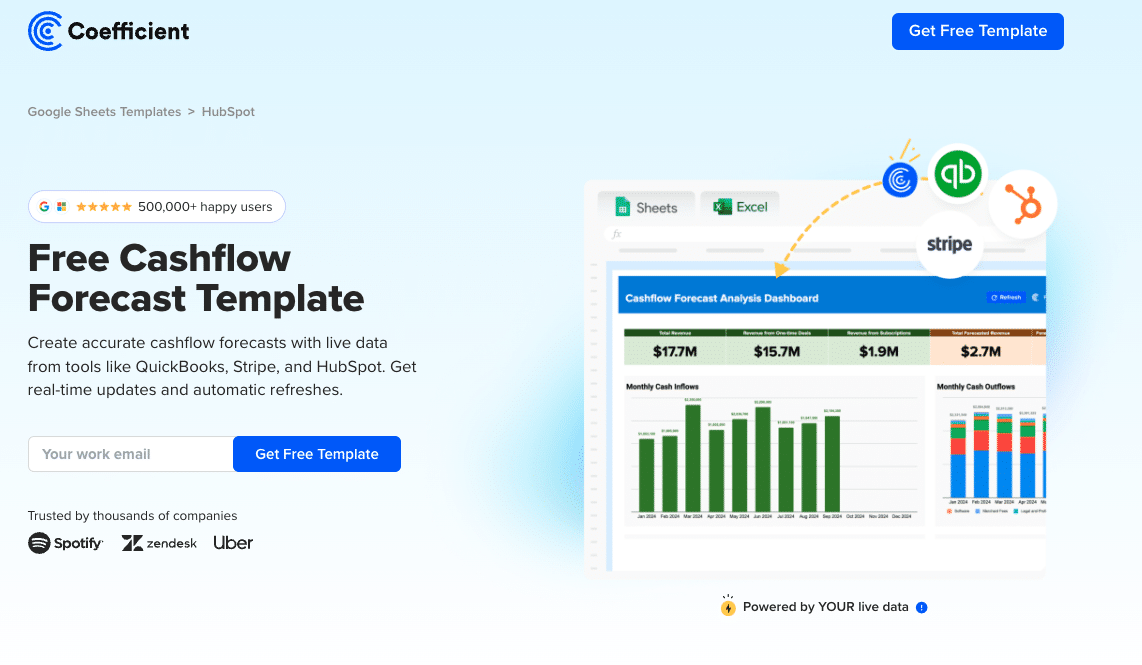
#5: Cashflow Forecast Dashboard
Use Case
The Cashflow Forecast Dashboard helps businesses predict and prepare for future financial positions. Financial analysts and controllers use this tool to combine subscription revenue data, deal pipeline information, and accounting metrics for accurate cash flow projections.
Metrics Tracked
- Cash inflows by category
- Cash outflows by type
- Net cashflow trends
- Deal pipeline values
- Subscription revenue forecasts
- Accounts receivable aging
- Accounts payable schedule
Get the Cashflow Forecast Dashboard Template
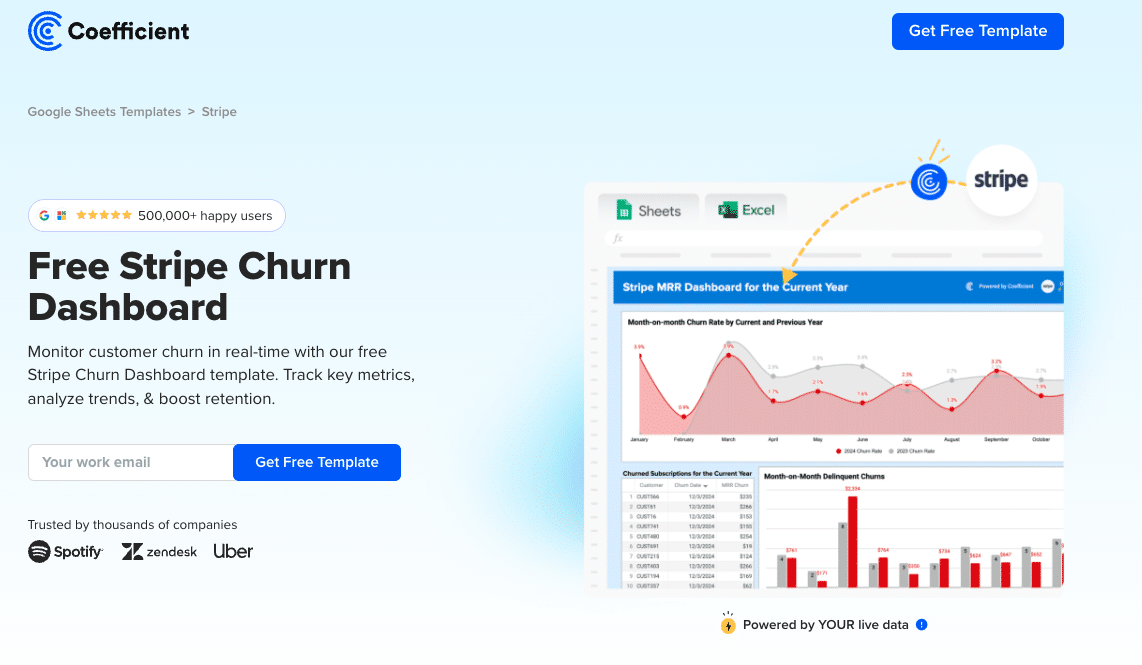
#6: Stripe Churn Dashboard
Use Case
The Stripe Churn Dashboard assists subscription businesses in monitoring and reducing customer attrition. Product teams and customer success managers use this dashboard to identify churn patterns, implement retention strategies, and measure their effectiveness.
Metrics Tracked
- Overall churn rate
- Churned customer count
- Churned MRR (delinquent)
- Plan-specific churn rates
- Customer lifecycle stages
- Retention by segment
Get the Stripe Churn Dashboard Template
#7: Invoice Tracker Dashboard
Use Case
The Invoice Tracker Dashboard helps finance teams maintain precise control over accounts receivable. Accounting professionals use this dashboard to monitor payment statuses, identify late payments quickly, and maintain healthy cash flow through proactive invoice management.
Metrics Tracked
- Payment aging analysis
- Outstanding invoice amounts
- Total paid invoices
- Age of receivables
- Payment status categories
- Customer payment histories
Get the Invoice Tracker Template
Top Stripe Dashboards for 2024 and Beyond
These Stripe dashboards provide essential visibility into your business’s financial health. Each template connects directly to your data sources, ensuring you always have current information for making critical decisions. Start with the dashboard that addresses your most pressing needs, then expand your financial monitoring as your business grows.
Ready to supercharge your Stripe data analysis? Get started with Coefficient today!
Further Reading
