Stripe’s native reporting capabilities often fall short for businesses seeking in-depth analytics. Third-party tools can significantly enhance your ability to analyze and leverage Stripe data, providing deeper insights and more robust reporting options.
Side-by-Side: Top Stripe Analytics Tools
| Tool | Row Limits / Export Limits | Data Sources | Builder License Cost | Viewer License Cost | AI Functionality | Refresh Frequency | Alerts | Security |
| Native Stripe Reporting | Limited to 10,000 rows | Stripe only | Free | Free | Limited | Real-time | Basic | PCI DSS Level 1 |
| Coefficient | Unlimited | Multiple, including Stripe | $29-$99/month | Free | Advanced | Real-time, scheduled | Customizable | SOC 2 Type II |
| Baremetrics | Unlimited | Stripe, Braintree, Recurly, etc. | $208/month | Included | Basic | Daily | Yes | SOC 2 Type II |
| ChartMogul | Unlimited | Multiple, including Stripe | Free-$600/month | Included | Advanced | Daily | Yes | SOC 2 Type II |
| CData | Depends on plan | 250+ data sources | $999-$6,999/year | Custom pricing | Limited | Real-time, scheduled | Limited | SOC 2 Type II |
1. Native Stripe Reporting
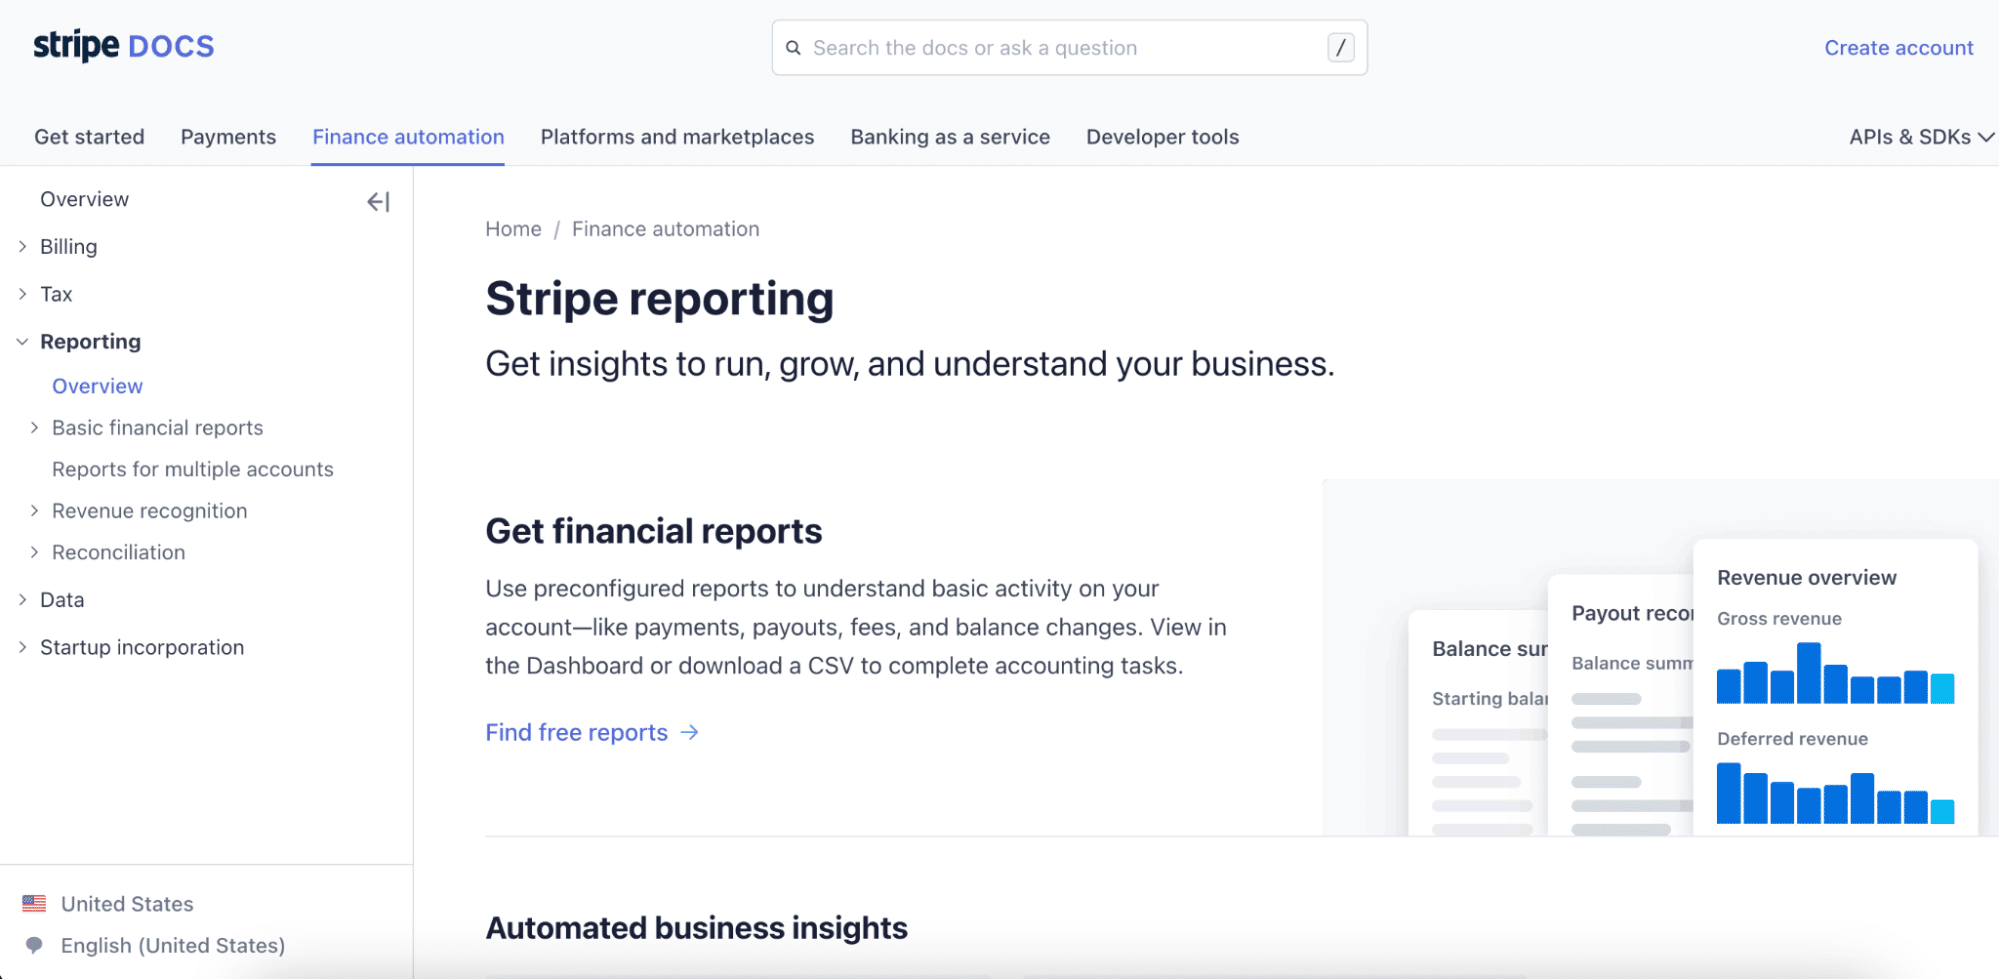
Stripe reporting offers basic analytics capabilities built directly into the Stripe dashboard. It provides essential insights into your payment processing and financial data without the need for additional tools.
Highlights of Stripe’s Native Reporting
- Real-time transaction monitoring
- Customizable reports for revenue, payouts, and disputes
Pros
- User-friendly interface: Stripe’s native reporting features a clean, intuitive dashboard that’s easy to navigate, even for those new to payment analytics.
- No additional cost: As part of the Stripe platform, these reporting tools come at no extra charge, making them an economical choice for small businesses or startups.
Cons
- Limited customization: While Stripe offers some report customization, it lacks the advanced filtering and visualization options found in dedicated analytics tools.
- Data export restrictions: Stripe limits exports to 10,000 rows, which can be problematic for businesses with high transaction volumes or those needing to analyze large datasets.
Pricing
Stripe’s native reporting is included free with all Stripe accounts as of August 2024. For the most up-to-date pricing information, visit the Stripe Pricing page.
Support
Stripe offers 24/7 support via email, with phone support available for accounts processing over $500,000 annually. They also provide extensive documentation and a community forum for self-service support.
2. Coefficient
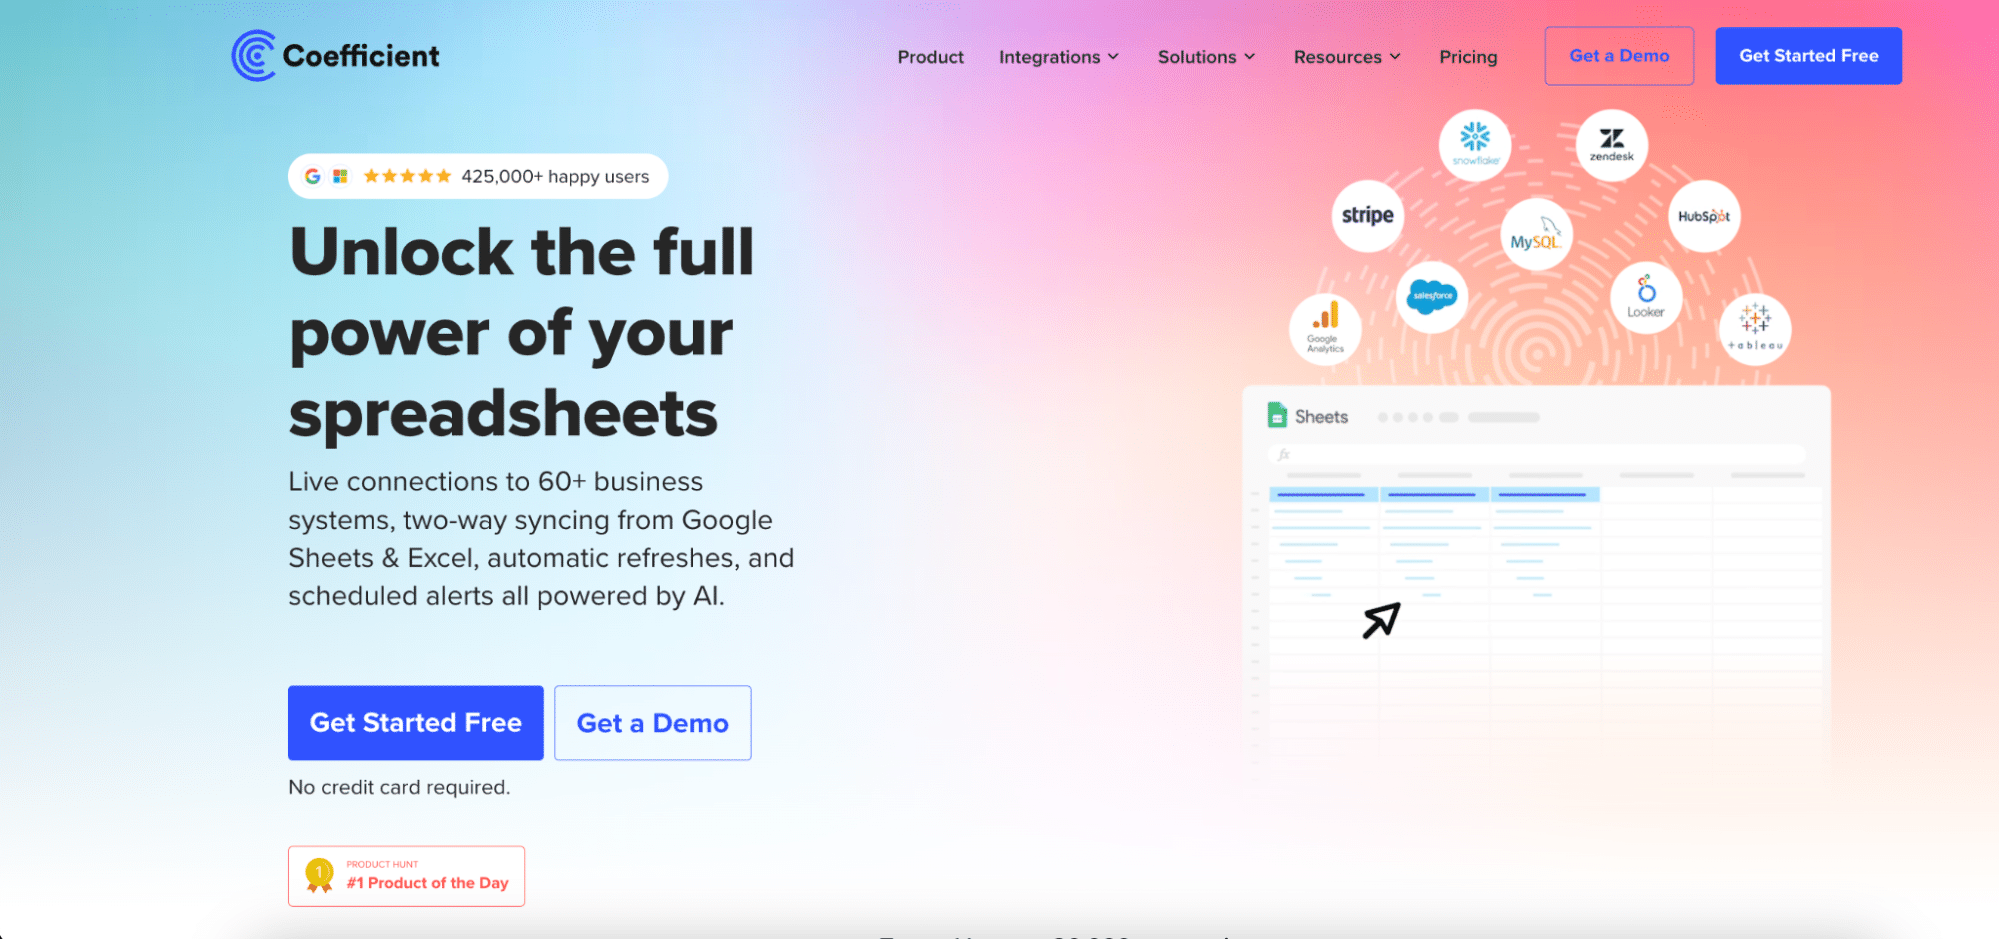
Coefficient is a powerful analytics tool that seamlessly integrates Stripe to Google Sheets integration and Stripe to Excel integration. It allows users to pull Stripe data directly into spreadsheets for advanced analysis and reporting.
Highlights of Coefficient
- No-code integration with Google Sheets and Excel
- Real-time data syncing and automated report generation
Pros
- Familiar spreadsheet environment: Coefficient leverages the power of spreadsheets, allowing users to work with Stripe data in a familiar environment, reducing the learning curve.
- Powerful automation features: With Coefficient, users can set up automated data refreshes and report generation, saving time and ensuring up-to-date insights.
Cons
- Requires spreadsheet proficiency: While Coefficient simplifies data integration, users still need a good understanding of spreadsheet functions to make the most of the tool.
- Limited visualization options: Compared to dedicated BI tools, Coefficient’s visualization capabilities are constrained by the limitations of spreadsheet charts and graphs.
Pricing
As of August 2024, Coefficient offers the following pricing tiers:
- Free: Limited features, suitable for individual use
- Pro: $29/month for small teams
- Business: $99/month for larger organizations
For the most current pricing, visit the Coefficient Pricing page.
Customer Support
Coefficient provides email support for all paid plans, with priority support for Business plan customers. They also offer extensive documentation, video tutorials, and a knowledge base for self-service support.
3. Baremetrics
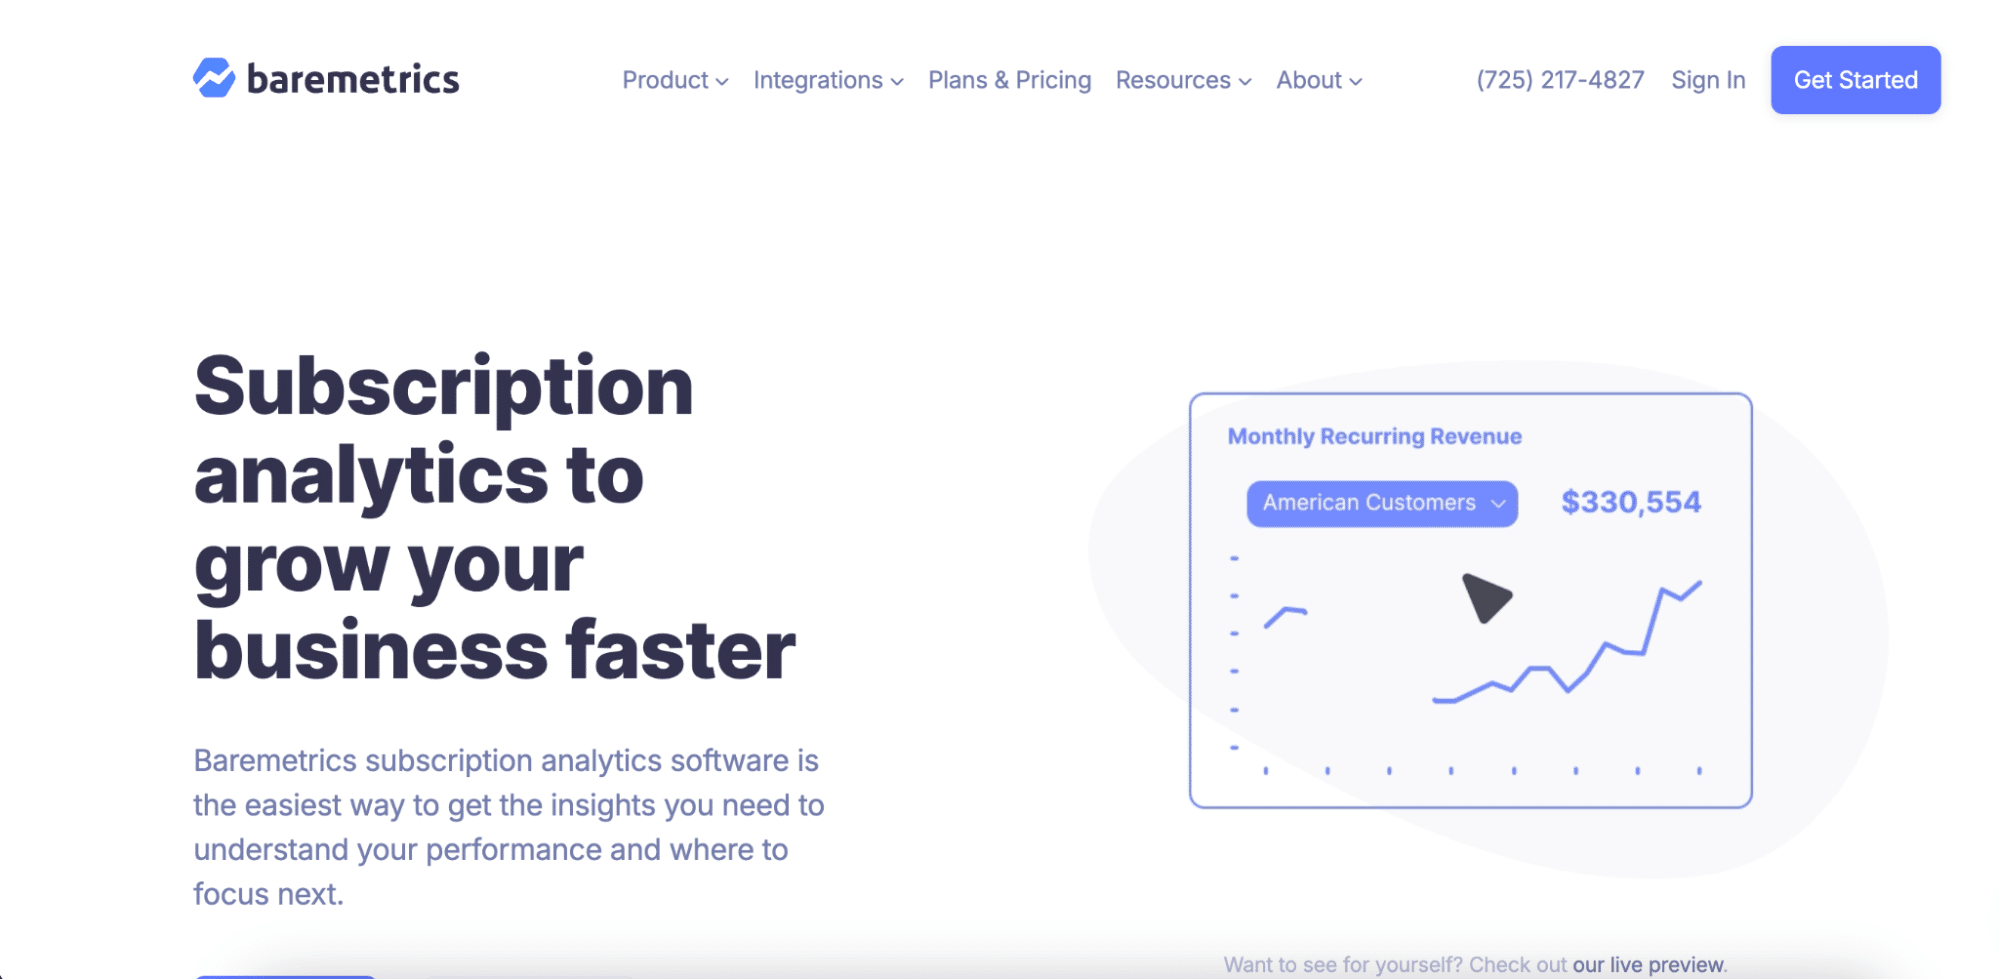
Baremetrics is a comprehensive analytics and forecasting platform designed specifically for subscription-based businesses. It offers deep insights into recurring revenue, churn, and customer lifetime value.
Highlights of Baremetrics
- Automated financial forecasting
- Detailed cohort analysis and segmentation
Pros
- Subscription-focused metrics: Baremetrics excels in providing metrics crucial for subscription businesses, such as MRR, ARR, and churn rate, with intuitive visualizations.
- Dunning management: The platform includes tools for recovering failed payments and reducing involuntary churn, directly impacting revenue.
Cons
- Limited customization: While Baremetrics offers a wide range of pre-built reports, customization options are somewhat limited compared to more flexible BI tools.
- Steep learning curve: The wealth of metrics and features can be overwhelming for new users, requiring time to fully understand and utilize effectively.
Pricing
As of August 2024, Baremetrics offers the following pricing:
- Baremetrics (Metrics): $208 per month
- Includes smart dashboards, data enrichment, segmentation, forecasting, and people insights
- Integrates with tools like Slack and Intercom for streamlined operations
- Recover: $158 per month
- Helps recover failed payments with automated email reminders and customizable credit card forms
- Includes ROI guarantee
- Cancellation Insights: $108 per month
- Provides insights into why customers cancel, with personalized email questionnaires and in-app feedback collection
- Forecast+: Included with Metrics
- Offers financial forecasting tools like scenario planning and generated financial models
For the most up-to-date pricing, visit the Baremetrics Pricing page.
Customer Support
Baremetrics provides standard support, which includes email/help desk support and access to a comprehensive knowledge base.
4. ChartMogul
ChartMogul is an advanced analytics platform that specializes in subscription analytics and revenue recognition. It offers powerful data analysis tools and customizable dashboards for SaaS and subscription-based businesses.
Highlights of ChartMogul
- Advanced customer segmentation capabilities
- Revenue recognition compliant with ASC 606 and IFRS 15
Pros
- Comprehensive subscription metrics: ChartMogul provides a wide range of subscription-specific metrics and KPIs, giving businesses deep insights into their recurring revenue models.
- Flexible data import: The platform supports data import from multiple sources, not just Stripe, making it ideal for businesses using various payment processors or billing systems.
Cons
- Complex setup process: Initial setup and data import can be complex, especially for businesses with large historical datasets or complex billing structures.
- Higher price point: ChartMogul’s advanced features come at a premium price, which may be prohibitive for smaller businesses or startups.
Pricing
As of August 2024, ChartMogul offers the following pricing tiers:
- Launch Plan
- Cost: Free (for businesses with less than $10,000 in Monthly Recurring Revenue (MRR))
- Features:
- Access to all subscription metrics
- Integration with all supported billing platforms
- Unlimited users
- API access and CSV exports
- Scale Plan
- Cost: $100 per month (includes up to $10,000 MRR) + $25 per month for each additional $10,000 MRR
- Features:
- All features from the Launch Plan
- Custom charts and customer lists
- Metrics for non-subscription revenue
- Email support
- Volume Plan
- Cost: Custom pricing based on specific business needs
- Features:
- Includes everything in the Scale Plan
- Dedicated Customer Success Manager (CSM)
- Guided onboarding and implementation support
For the most current pricing information, visit the ChartMogul Pricing page.
Customer Support
ChartMogul provides two levels of support:
- Email Support
- Availability: Included with the Scale Plan
- Features:
- Standard response times
- Support for common issues and inquiries
- Dedicated Customer Success Manager (CSM)
- Availability: Included with the Volume Plan
- Features:
- Personalized support experience
- Guided onboarding, training, and strategic support
- Ongoing assistance tailored to your specific business needs
5. CData
CData is a comprehensive data connectivity platform that offers a wide range of drivers and integrations, including for Stripe. It enables businesses to connect Stripe data with various BI, analytics, and reporting tools.
Highlights of CData
- Supports over 250 data sources and destinations
- Real-time data connectivity and integration
Pros
- Versatile connectivity: CData’s wide range of drivers allows businesses to connect Stripe data with virtually any BI or analytics tool, providing unparalleled flexibility.
- Robust data transformation: The platform offers powerful ETL capabilities, allowing users to clean, transform, and enrich their Stripe data before analysis.
Cons
- Technical complexity: CData’s power comes with increased complexity, often requiring technical expertise to set up and maintain integrations effectively.
- Pricing opacity: CData’s custom pricing model can make it difficult for businesses to estimate costs upfront, potentially leading to budget surprises.
Pricing
As of August 2024, CData Sync offers the following pricing tiers:
- Starter Plan
- Cost: $999 per year
- Features:
- Supports basic data integration with up to 2 connections
- Unlimited data rows
- On-premise deployment
- Standard support included
- Standard Plan
- Cost: $3,999 per year
- Features:
- All features of the Starter Plan
- Supports up to 5 connections
- Access to all destination types for data integration
- Premium support available as an optional add-on
- Professional Plan
- Cost: $6,999 per year
- Features:
- All features of the Standard Plan
- Supports up to 10 connections
- Designed for organizations with more complex data integration needs
- Premium support available as an optional add-on
- Enterprise Plan
- Cost: Custom pricing
- Features:
- Unlimited data sources and connections
- Cloud deployment options
- Premium support included
- Customization available to fit specific enterprise needs
For the most up-to-date pricing information, contact CData directly through their Pricing page.
Customer Support
CData offers three levels of support:
- Standard Support
- Availability: Included with all plans
- Features:
- Support via email and an online help desk during business hours
- Basic assistance with general queries, troubleshooting, and product usage
- Premium Support (Optional Add-On)
- Availability: Available for Standard and Professional plans
- Features:
- Faster response times
- Potentially extended support hours
- In-depth technical support for more complex issues, ideal for mission-critical environments
- Enterprise Support
- Availability: Included with the Enterprise Plan
- Features:
- Comprehensive, priority support tailored to large organizations
- Dedicated account management and technical advisors may be provided
- 24/7 availability and faster resolution times for critical issues
Choose the Right Stripe Analytics Tool for Your Business
Selecting the ideal Stripe analytics tool depends on your specific business needs, technical capabilities, and budget. Consider factors such as the depth of analytics required, integration capabilities, and ease of use when making your decision. Whether you opt for the simplicity of native Stripe reporting, the spreadsheet integration of Coefficient, or the advanced analytics of platforms like Baremetrics or ChartMogul, the right tool can significantly enhance your ability to leverage Stripe data for business growth. Get started with improving your Stripe analytics today and unlock the full potential of your payment data.
For more information on Stripe integrations, check out our post on Top Stripe Connector Apps.


