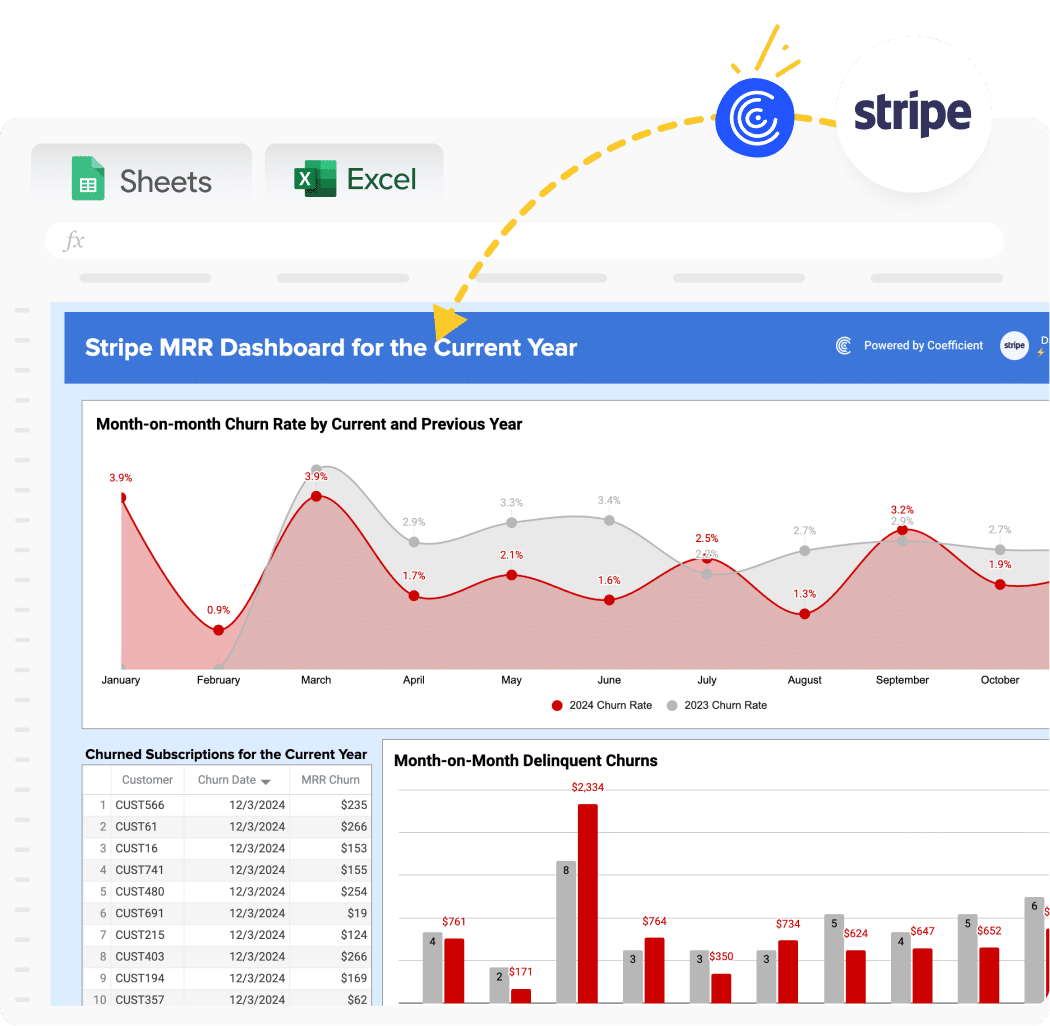
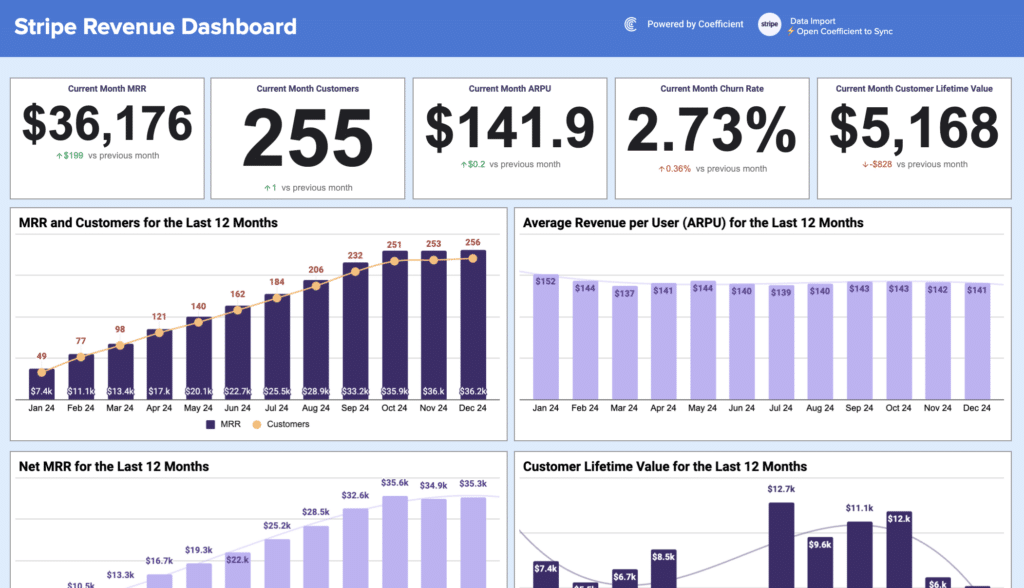
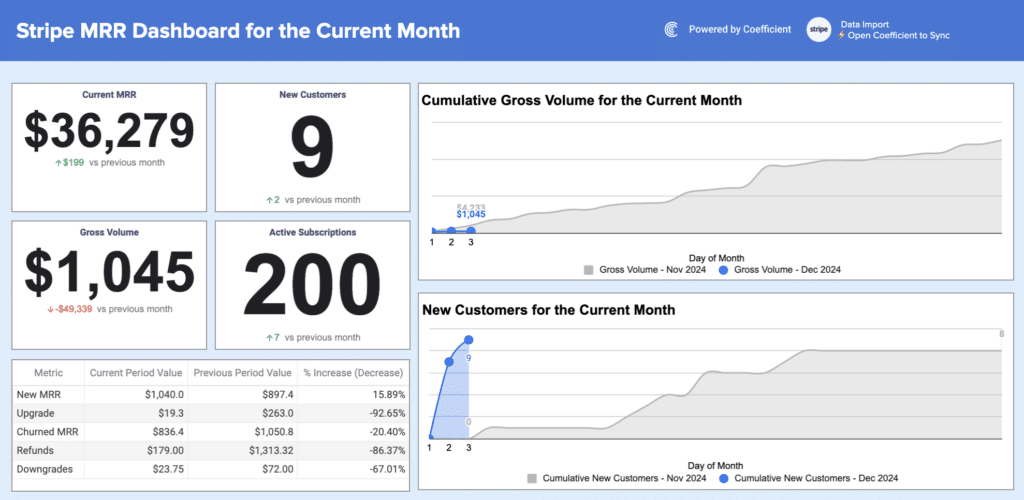
Tracking your Monthly Recurring Revenue (MRR) is crucial for SaaS businesses, but it can be challenging to get a clear picture of your financial Tracking customer churn can be challenging and time-consuming. Our free Stripe Churn Dashboard template helps you monitor key metrics in real-time, allowing you to make data-driven decisions to reduce churn and boost retention.
What is a Churn Dashboard Report?
A Churn Dashboard Report is a visual representation of key metrics related to customer attrition or loss. It provides a comprehensive view of how many customers are leaving your service, the rate at which they’re leaving, and the financial impact of this churn. This report is crucial for businesses using subscription models or recurring revenue streams, as it helps identify trends, spot potential issues, and make informed decisions to improve customer retention.
Benefits of using Stripe Churn Dashboard Template
- Real-time data updates: Get the latest churn metrics directly from your Stripe account, ensuring you always have up-to-date information.
- Comprehensive view: Track multiple churn-related metrics in one place, giving you a holistic understanding of your customer retention performance.
- Easy identification of trends: Visualize churn data over time to spot patterns and take proactive measures to reduce customer loss.
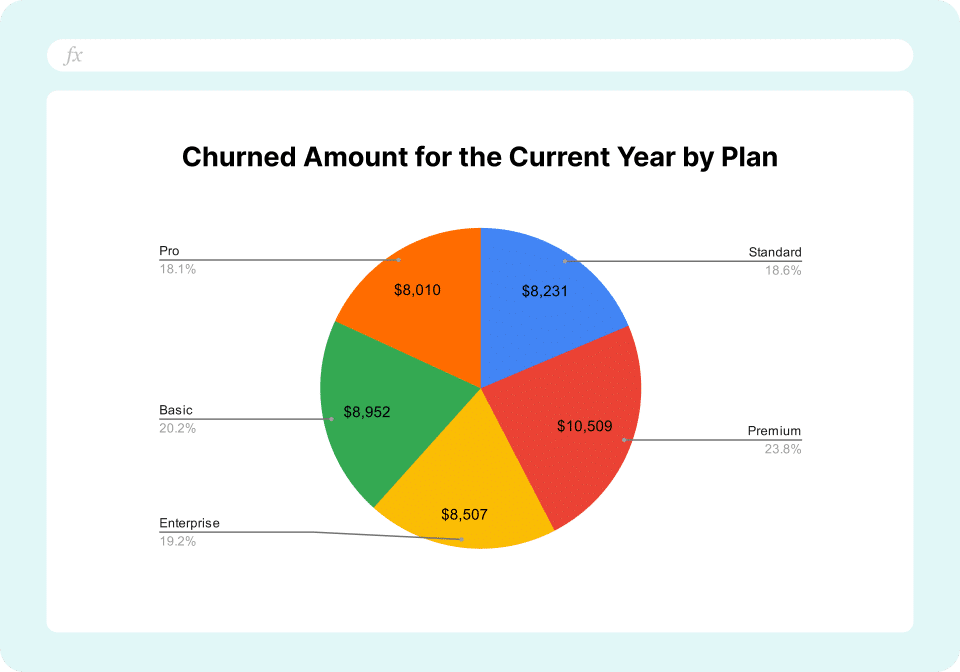
- Segmented analysis: Break down churn by plan name to identify which products or services may be underperforming.
Improved decision-making: Use accurate, live data to make informed choices about retention strategies and product improvements.
Metrics Tracked in the Report
- Churn rate
- Churned customers
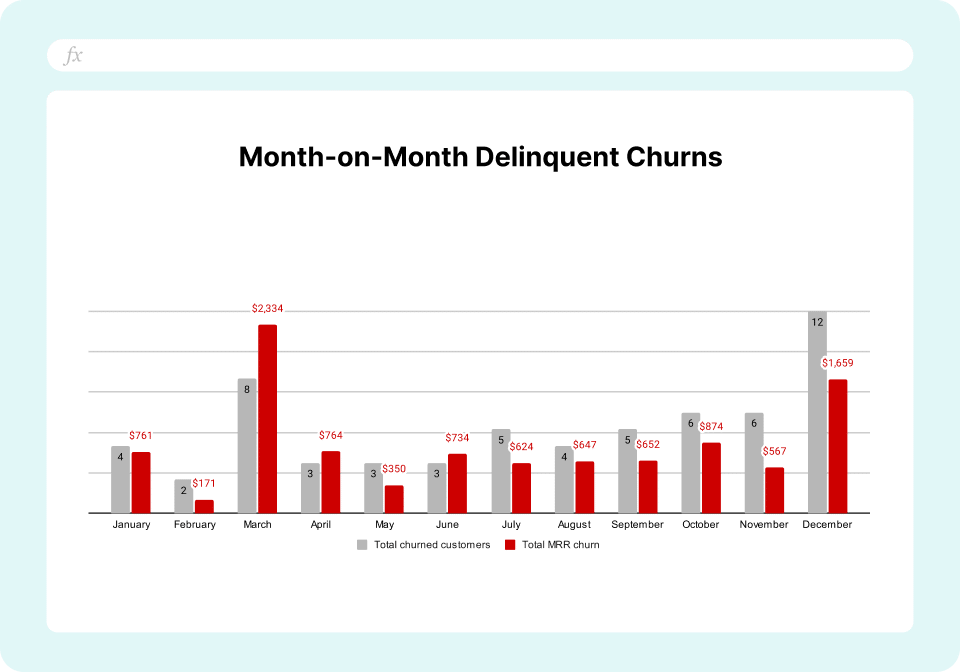
- Churned MRR (delinquent)
- Churned customers (delinquent)
- Churned MRR by plan name
More Metrics to Track and Analyze on Google Sheets
With Coefficient’s Stripe integration, you can pull additional metrics into your Google Sheets:
- Customer data
- Charge information
- Subscription details
- Refund data
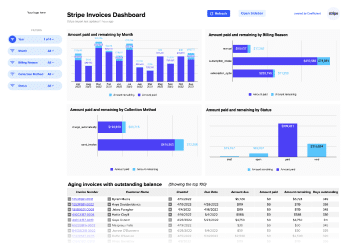
- Invoice records
These metrics can be filtered by creation date, allowing you to customize your analysis based on specific time frames.
