Are you struggling to make sense of your PostgreSQL data? You’re not alone. Many businesses find it challenging to extract meaningful information from their databases. But here’s some good news: the right reporting tool can transform your data into valuable insights.
In this post, we’ll examine five outstanding Postgres Reporting Tools that are making a significant impact. We’ll analyze their features, advantages, disadvantages, and share real user feedback. By the end, you’ll have a clear understanding of which tool might be the best fit for your needs.
Let’s explore how you can turn your PostgreSQL data into actionable information.
The Ultimate Postgres Reporting Tools Showdown
Before we examine each tool in detail, let’s take a quick look at how they compare. This comparison table provides a snapshot of key features:
Feature
Tableau
Looker
Coefficient
Apache Superset
Metabase
Row Limits / Export Limits
10 million
Customizable
1 million
Customizable
2 million
Data Sources
100+
50+
50+
30+
20+
Builder License Cost
$75/month
Custom pricing
$99/month
Free (open-source)
$85/month
Viewer License Cost
$15/month
$9/month
Free
Free
Free
AI Functionality
Yes
Yes
Yes
Limited
No
Refresh Frequency
Real-time
Real-time
Real-time
Customizable
Hourly
Alerts
Yes
Yes
Yes
Yes
Yes
Security
Enterprise-grade
Enterprise-grade
SOC 2 Type II
Customizable
Basic to Advanced
Now, let’s take a closer look at each of these Postgres reporting powerhouses.
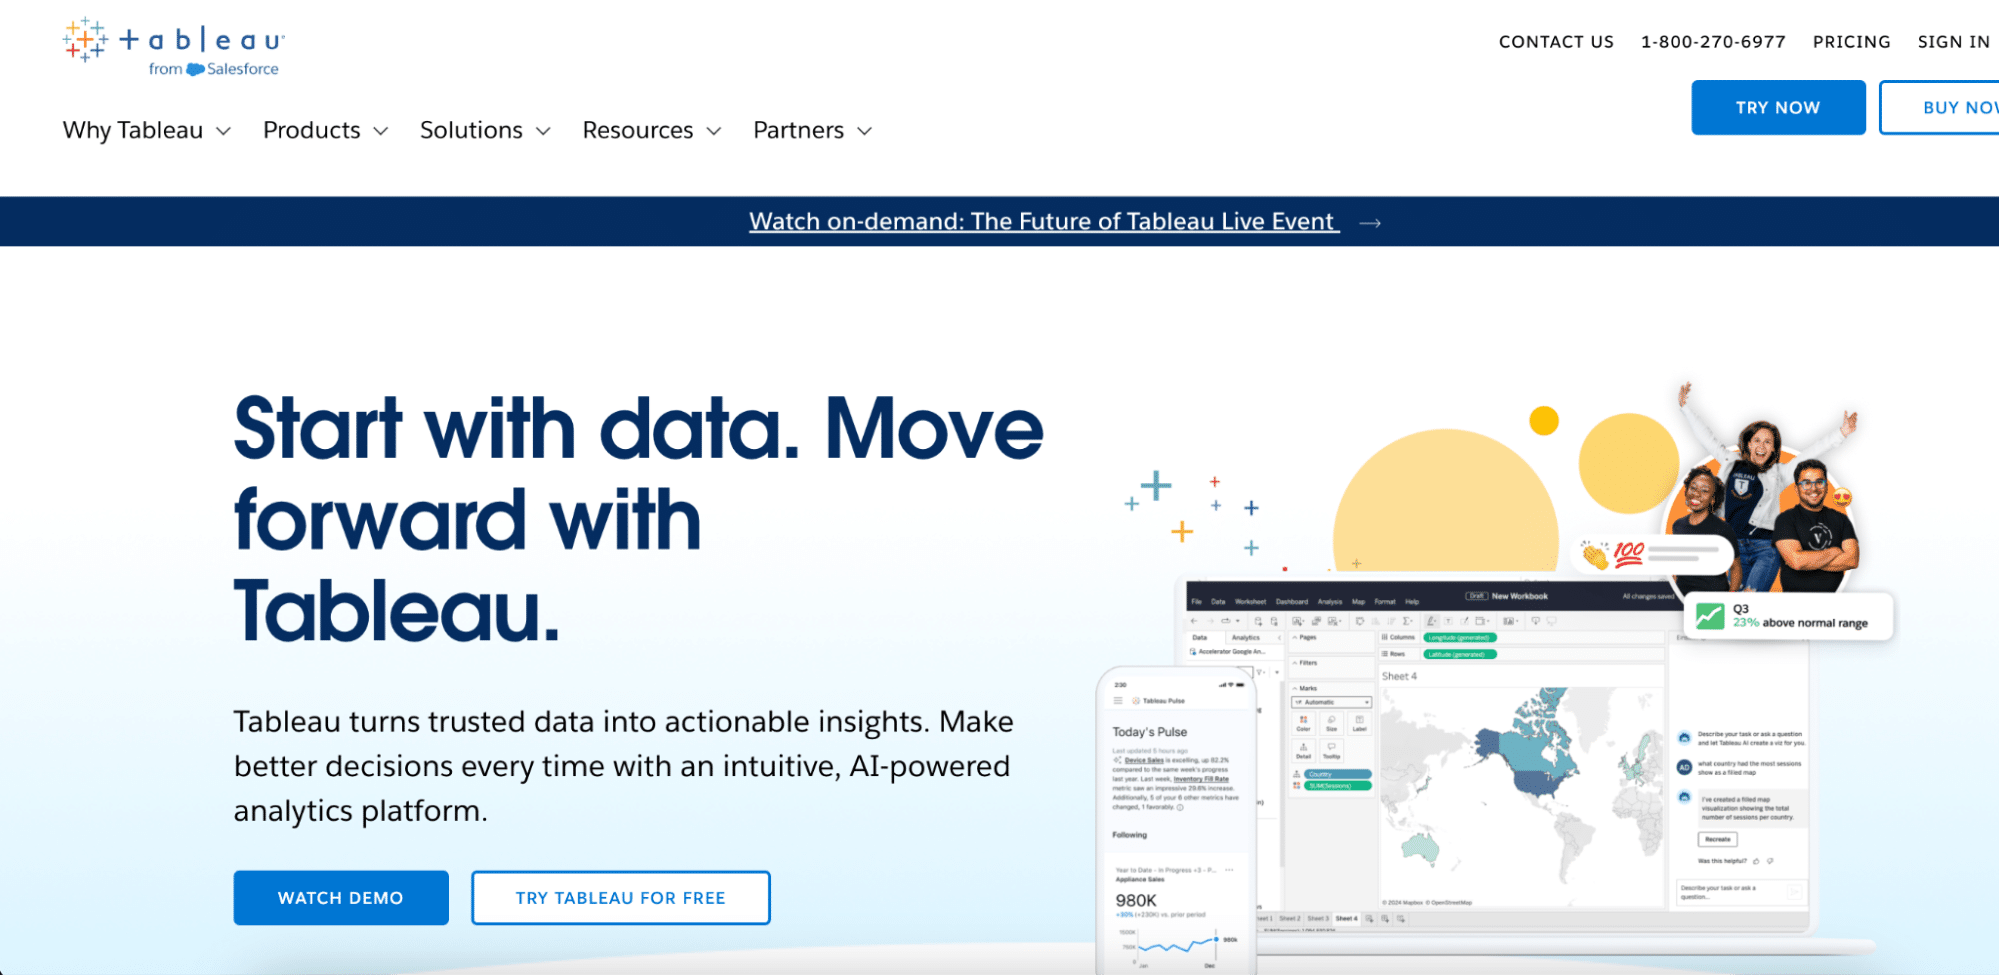
1. Tableau: Turning Postgres Data into Visual Masterpieces
Tableau excels at transforming PostgreSQL data into interactive, visually appealing dashboards that even non-technical team members can understand.
What Makes Tableau Shine?
Drag-and-drop simplicity: Creating reports is straightforward. You can drag fields onto the canvas without writing any code.
Real-time PostgreSQL connection: Your dashboards stay current with the latest data, ensuring you’re always working with up-to-date information.
The Good, The Bad, and The Pricey
Pros:
User-friendly interface: Even those new to data analysis can create professional-looking reports quickly.
Visualization variety: Tableau offers a wide range of chart types, from basic bar charts to complex geospatial maps.
Cons:
Steep learning curve for advanced features: While basic functions are easy to use, mastering Tableau’s full capabilities takes time and effort.
Not budget-friendly: Smaller teams or individual users might find Tableau’s price tag challenging.
Show Me the Money
As of August 2024, Tableau offers the following pricing tiers:
Tableau Creator: $75 per user per month, billed annually
Includes access to Tableau Desktop, Tableau Prep, and one Creator license on Tableau Cloud or Server
Ideal for users needing complete data preparation and analysis tools
Tableau Explorer: $42 per user per month, billed annually
Allows interaction with and modification of existing dashboards and visualizations
Suitable for users who need to explore data but don’t require full content creation capabilities
Tableau Viewer: $15 per user per month, billed annually
Provides access to view and interact with dashboards and visualizations created by others
Best for users who primarily need to access and interact with published content
Enterprise Plans: Custom pricing based on organizational needs
Includes enhanced data governance, advanced management features, and additional security
Often bundled with additional services and higher-level support
Straight from the User’s Mouth
Let’s hear what real users have to say about Tableau:
“Tableau has transformed our data analysis process. The visualizations are stunning and help us communicate insights effectively.” – G2 Review
But it’s not all positive:
“The pricing model can be confusing, and it’s quite expensive for smaller organizations.” – G2 Review
Help When You Need It
Tableau offers several support options:
Standard Support: Included with all licenses
Access to Tableau’s extensive online resources, including community forums, knowledge base, and documentation
Email and chat support for basic troubleshooting
Premium Support (Enterprise):
24/7 technical support with faster response times
Access to a dedicated account manager and advanced support services
Advanced Management: Add-on for Enterprise Plans
Additional tools for monitoring and managing Tableau Server or Cloud deployments
Enhanced security and compliance features, particularly for large-scale deployments
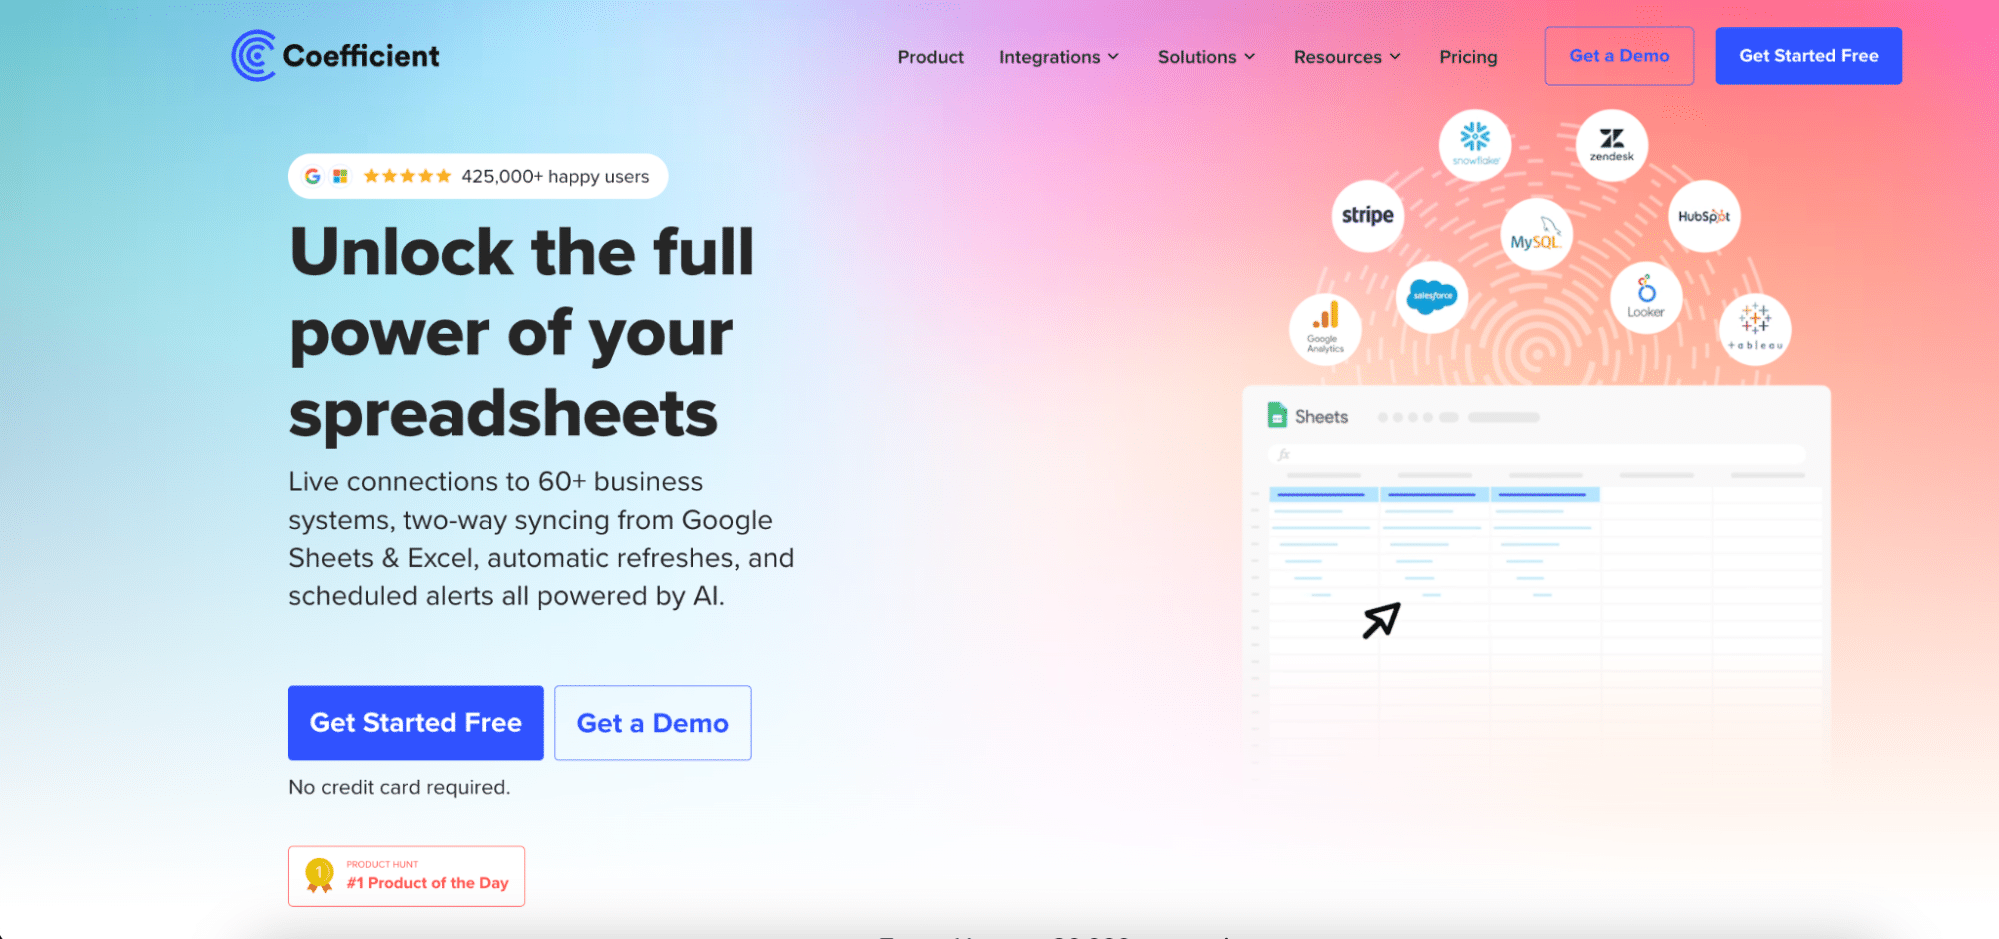
2. Coefficient: Where Postgres Meets Spreadsheets with No-Code
Coefficient brings the power of PostgreSQL directly into your favorite spreadsheet. It bridges the gap between complex databases and the familiar environment of Excel or Google Sheets.
Coefficient’s Secret Sauce
PostgreSQL data in spreadsheets: Access real-time data right where you’re used to working.
Set it and forget it: Automated data refresh and alerts keep your reports current without manual intervention.
Weighing the Pros and Cons
Pros:
Spreadsheet integration: Use your existing Excel or Google Sheets skills for PostgreSQL reporting.
No-code approach: Create complex reports without writing SQL queries.
Cons:
Spreadsheet-centric: If you’re looking for a standalone BI platform, this might not be the best fit.
Feature-rich learning curve: While user-friendly, mastering all of Coefficient’s capabilities requires some time investment.
What’s in Your Wallet?
As of August 2024, Coefficient offers the following pricing tiers:
Free Plan:
Up to 3 data sources
Import up to 5,000 rows
Manual data refresh up to 50 times a month
Ideal for individuals or very small teams starting with data automation
Starter Plan: $49/month
3 data sources
500 refreshes per month
Suitable for small businesses beginning to scale their data operations
Pro Plan: $99/month per user
6 data sources
Unlimited imports and hourly refreshes
Advanced AI features and priority support
Designed for growing businesses with more complex and frequent data needs
Enterprise Plan: Custom pricing
Fully customized solutions
Tailored for large organizations with complex, large-scale data needs
The Voice of the People
Users are praising Coefficient:
“Coefficient has streamlined our reporting process by bringing PostgreSQL data directly into our spreadsheets.” – G2 Review
But there’s room for improvement:
“The tool is great, but I wish it had more advanced visualization options built-in.” – G2 Review
A Helping Hand
Coefficient provides several support options:
Standard Support: Included with all plans
Email support during business hours
Access to online resources and community forums
Premium Support: Available with higher-tier plans or as an add-on
Faster response times
Priority support via phone or chat
Access to a dedicated support representative
Enterprise Support: Available with the Enterprise Plan
24/7 support with a dedicated technical account manager
Custom SLAs and priority issue resolution
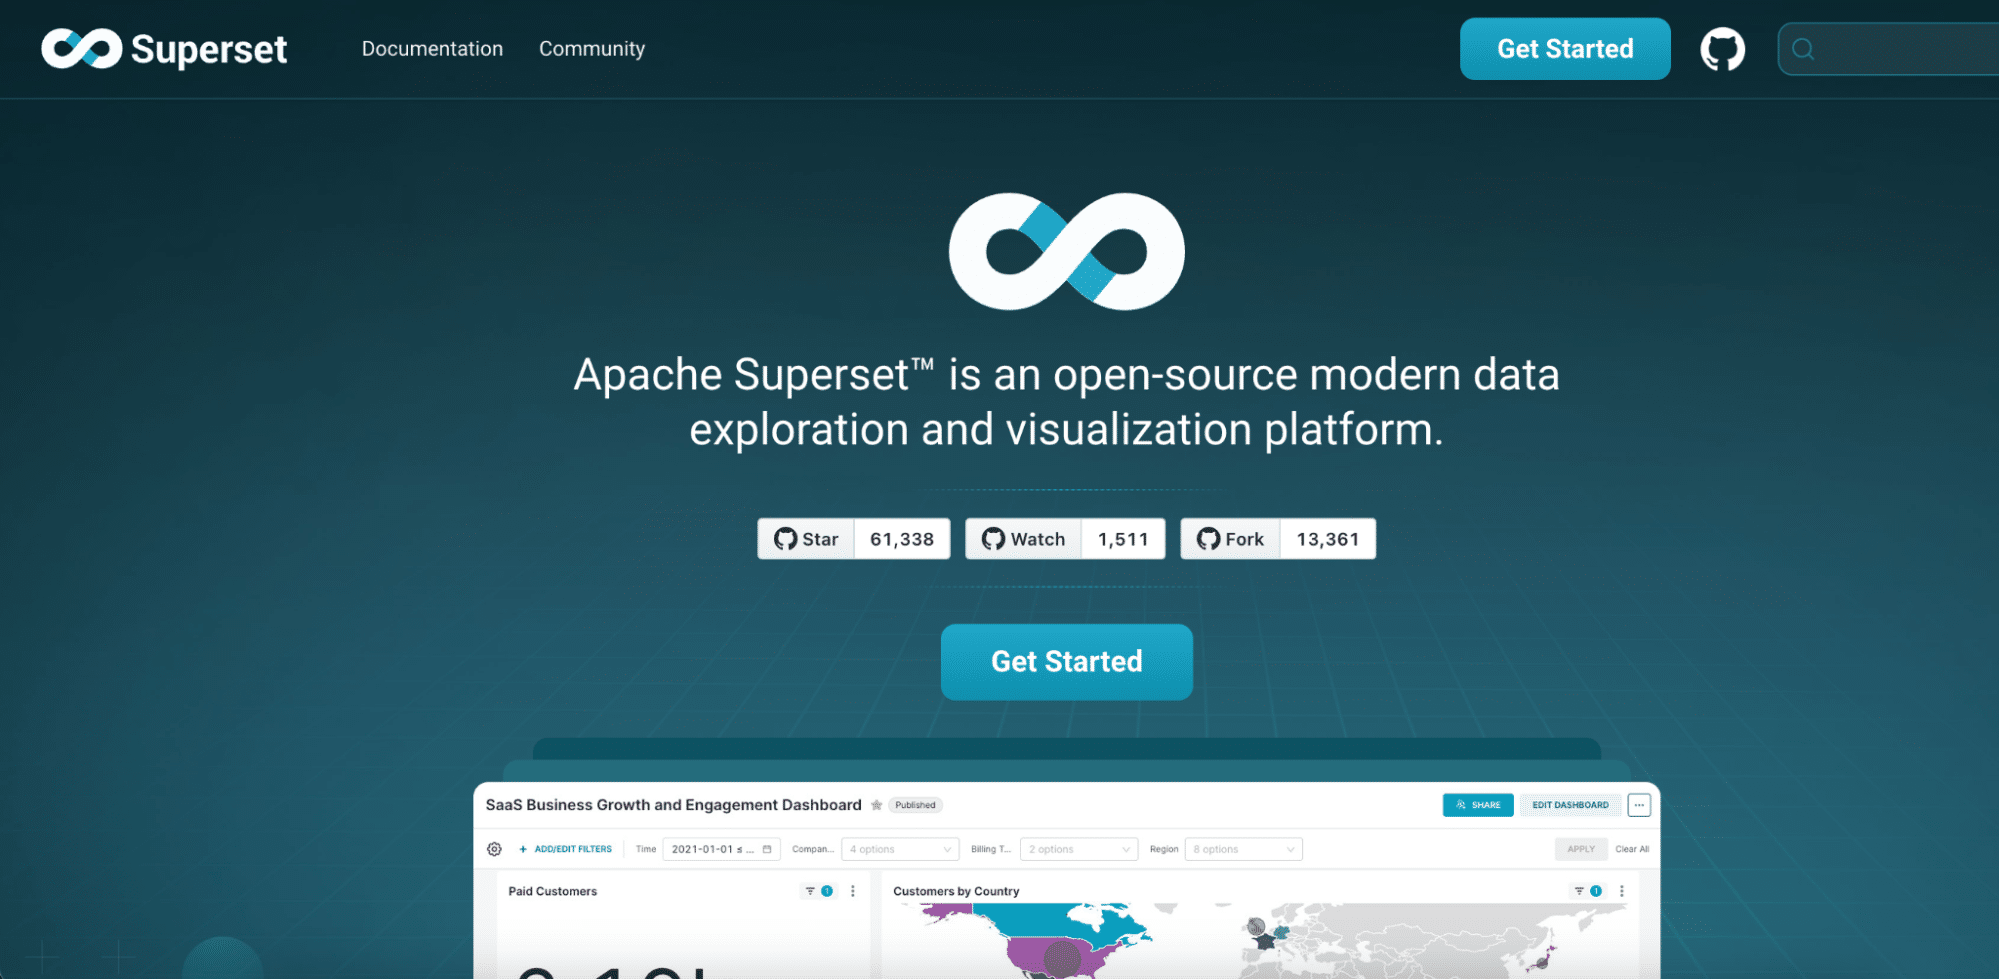
3. Apache Superset: Open-Source Postgres Reporting for the Win
For those who prefer open and free software, Apache Superset is an excellent choice. This powerful, open-source business intelligence platform works well with PostgreSQL databases, offering a robust solution for reporting and analytics.
Superset’s Superpowers
Chart bonanza: An extensive library of visualizations to bring your data to life.
SQL Lab: For times when you need to execute direct queries.
The Open-Source Advantage (and Challenge)
Pros:
Flexibility: Customize and extend the platform to meet your specific needs.
Budget-friendly: The software is free, which can significantly reduce costs.
Cons:
Technical expertise required: Deployment and maintenance need more technical knowledge.
User interface could be improved: It may not have the polished interface of some commercial alternatives.
Price Tag? What Price Tag?
Apache Superset is free and open-source. Your main costs will be hosting and any support services you might need.
From the Superset Community
Users appreciate the open-source nature:
“Superset offers incredible flexibility and power for our PostgreSQL reporting needs.” – GitHub Issue
But it’s not without challenges:
“The learning curve can be steep, especially for non-technical users.” – GitHub Issue
Community-Powered Support
Support for Superset is primarily community-driven through forums, documentation, and GitHub issues. If you need more hands-on assistance, commercial support options are available from third-party providers.
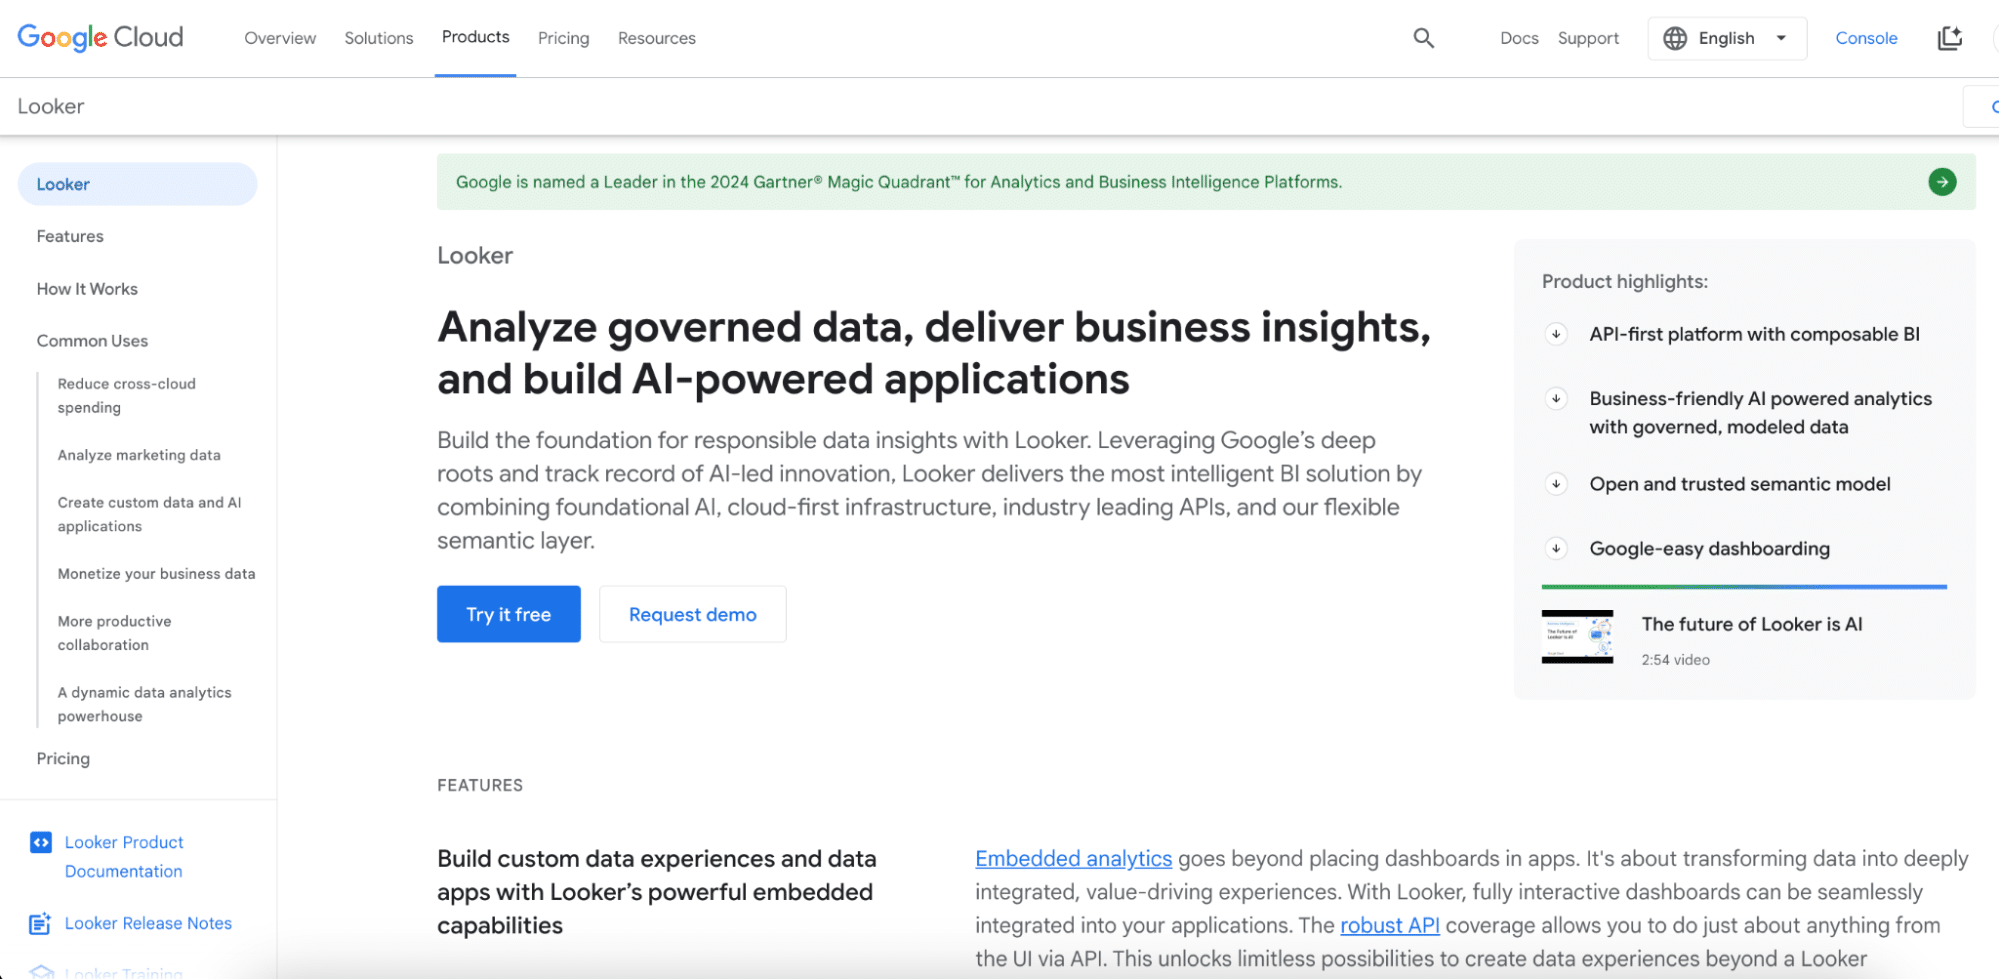
4. Looker: Taking Postgres Analytics to New Heights
Looker is a versatile PostgreSQL reporting tool. It offers advanced analytics capabilities and a unique modeling layer that can handle complex data relationships.
Looker’s Standout Features
LookML: A proprietary data modeling language that allows you to create reusable, version-controlled data models.
Embedded analytics: Seamlessly integrate Looker’s capabilities into your own applications.
The Highs and Lows of Looker
Pros:
Data modeling mastery: LookML allows for creating consistent, reusable data models across your organization.
Collaboration central: Easily share and collaborate on reports and dashboards with team members.
Cons:
LookML learning curve: Getting to grips with this proprietary language can be challenging for newcomers.
Premium pricing: Looker’s advanced features come with a price tag that might be steep for smaller organizations.
The Million Dollar Question
As of August 2024, Looker offers the following pricing tiers:
Looker Studio (Free Version):
Basic data visualization and report creation
Integration with Google services like Google Sheets, Google Analytics, and more
Suitable for small teams or businesses that need basic reporting capabilities
Looker Studio Pro: Starts at $9 per user per month
All features of the free version
Advanced collaboration tools, data governance, and security features
Enhanced content management and automated report delivery
Dedicated support from Google Cloud Customer Care
Custom Enterprise Plans: Varies based on usage and organizational needs
Customized features and support tailored to large enterprises
Higher limits on query-based and administrative API calls
Support for advanced security and compliance requirements, such as HIPAA
Options for embedding analytics and deploying custom applications at scale
Looker Through Users’ Eyes
Looker has its fans:
“Looker’s data modeling capabilities have revolutionized how we analyze our PostgreSQL data.” – G2 Review
But it’s not without its challenges:
“The initial setup and learning curve can be challenging, especially for non-technical users.” – G2 Review
Support that Looks Out for You
Looker offers the following support options:
Standard Support: Included with Free and Pro Versions
Online support via help center and community forums
Access to documentation, tutorials, and community-driven solutions
Email support for basic troubleshooting and general queries
Premium Support: Available with Enterprise Plans
Priority access to Google Cloud Customer Care
Dedicated account management and technical advisors
Faster response times and 24/7 support options
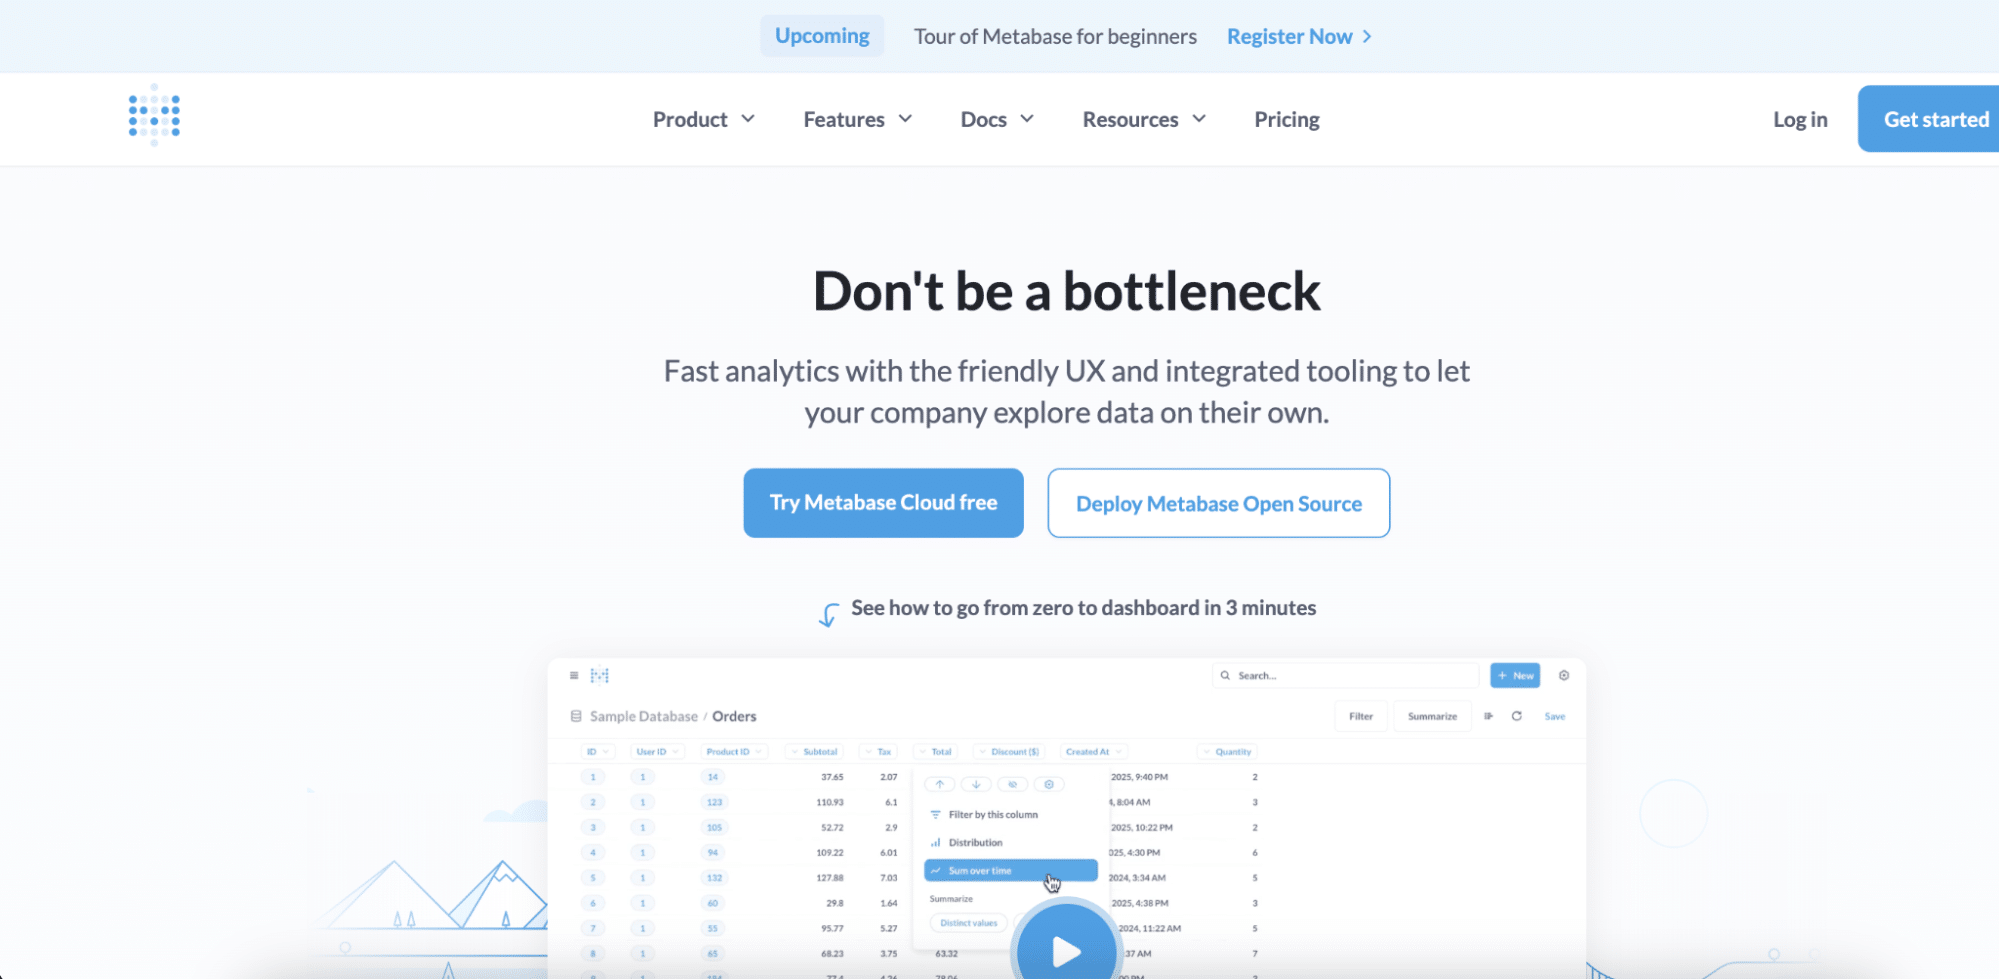
5. Metabase: Postgres Analytics for Everyone
Lastly, we have Metabase. This tool focuses on making PostgreSQL databases accessible to everyone, not just data experts.
Metabase’s Magic Touch
No-code query builder: Ask questions about your data without writing SQL.
One-click visualizations: Turn your query results into charts and graphs with a single click.
Metabase: Friend or Foe?
Pros:
Ease of use: An intuitive interface that allows anyone to create reports, no advanced skills required.
Quick setup: Connect to your PostgreSQL database and start creating reports in minutes.
Cons:
Limited advanced features: Power users might find themselves wanting more capabilities.
Performance issues: Can slow down when dealing with very large PostgreSQL databases.
Pricing that Won’t Break the Bank
As of August 2024, Metabase offers the following pricing tiers:
Starter (Metabase Cloud): $85 per month (includes 5 users, $5 per additional user)
Fully-managed cloud deployment
SOC 2 Type II compliance
Operational overhead handled by Metabase, including upgrades, patches, and backups
Growth (Metabase Cloud): $749 per month (includes 10 users, $15 per additional user)
All Starter features plus isolated application servers and databases
No “noisy neighbors” to ensure dedicated resources
Enterprise (Cloud or On-Premise): Starts at $15,000 per year
All Business plan features plus advanced options like row-level permissions, auditing tools, and priority support
Customizable deployments for large enterprises requiring extensive control and customization
Open Source (Host it Yourself): Free
Self-hosted version with all core BI features, including dashboard creation and SQL query building
Ideal for organizations with in-house expertise to manage and maintain the deployment
The Metabase User Experience
Users appreciate Metabase’s simplicity:
“Metabase made it easy for our non-technical team members to create PostgreSQL reports.” – G2 Review
But some users have encountered limitations:
“We’ve experienced some performance issues when dealing with very large datasets.” – G2 Review
A Supportive Community
Metabase provides the following support options:
Standard Support: Included in all paid plans
Email support with access to Metabase’s success engineers
Help with troubleshooting, best practices, and setup guidance
Priority Support: Available in the Enterprise plan
Faster response times
Direct access to advanced support services
Comprehensive assistance for complex deployments
Choosing Your Perfect Postgres Reporting Partner
Selecting the right PostgreSQL reporting tool is crucial. You need one that matches your team’s skills, fits your budget, and meets your specific reporting needs.
Consider these factors:
Do you need advanced visualizations? Tableau might be your best bet.
Want to stick with familiar spreadsheets? Coefficient could be a good match.
Looking for open-source flexibility? Apache Superset is worth considering.
Need advanced analytics? Looker’s got you covered.
Want user-friendly reporting for everyone? Metabase might be just what you need.
Remember, the best tool is the one that fits your unique needs and helps you turn your PostgreSQL data into actionable information.
Ready to improve your Postgres reporting? Why not give Coefficient a try? It might be the perfect blend of power and simplicity you’ve been looking for.
For more information on PostgreSQL tools and connectors, check out our guide on Top PostgreSQL Connector Apps.
Frank Ferris
Sr. Manager, Product Specialists
Frank is the spreadsheet ninja you never knew existed. Frank's focus throughout his career has been all about growing businesses quickly through both strategy and effective operations. His advanced skillset and understanding of how to leverage data analytics to automate processes and make better and faster decisions make him the unicorn any team can thrive with.