SaaS data analytics has become an indispensable tool for companies looking to drive growth, enhance customer satisfaction, and guide product development.
By leveraging the vast amount of data generated by their platforms, SaaS businesses can uncover valuable insights into user behavior, identify areas for improvement, and make informed decisions that propel them forward.
In this blog post, we’ll explore the essential metrics for SaaS data analytics, discuss common challenges and solutions, and demonstrate how to leverage data-driven decisions to optimize growth strategies.
Essential Metrics for SaaS Data Analytics
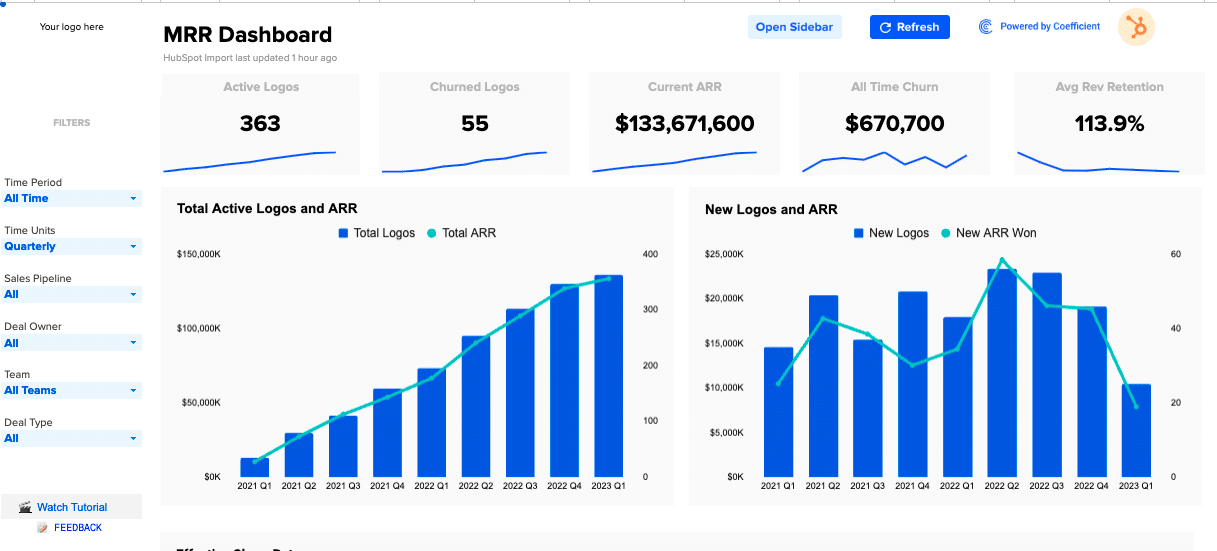
Monthly Recurring Revenue (MRR)
MRR represents the predictable and recurring revenue generated each month from subscriptions.
Monitoring MRR growth helps forecast future revenue and assess the overall health of the business. For example, if a company has 100 customers paying $50 per month, their MRR would be $5,000.
Want to dive deeper into your MRR? Check out this handy template to calculate and analyze your MRR like a pro!
Customer Lifetime Value (CLV)
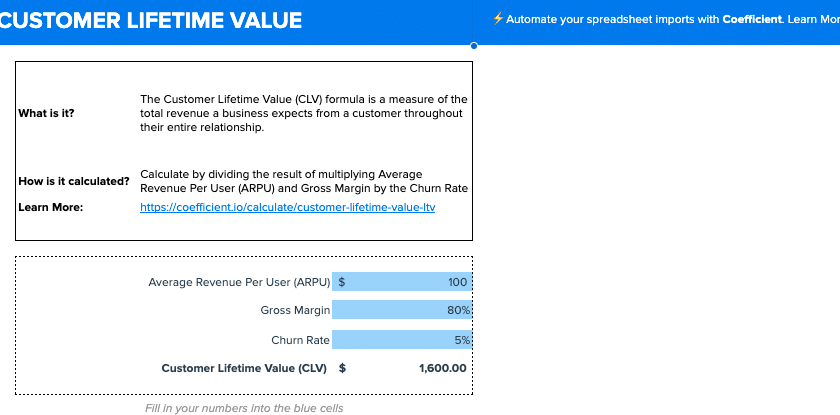
CLV is the total revenue a business expects to earn from a single customer throughout their entire relationship.
Maximizing CLV is essential for long-term profitability and growth. By understanding CLV, companies can make informed decisions about customer acquisition, retention, and upselling strategies.
For instance, if a customer pays $100 per month and remains subscribed for an average of 24 months, their CLV would be $2,400.
Uncover your CLV with this powerful template and start optimizing your customer relationships today!
Churn Rate
Churn rate represents the percentage of customers who cancel their subscriptions within a given period. Monitoring churn is crucial for identifying issues and improving customer retention strategies. A high churn rate can significantly impact MRR growth and overall business sustainability.
For example, if a company has 1,000 customers and 50 of them cancel their subscriptions in a month, the monthly churn rate would be 5%.
Customer Acquisition Cost (CAC)
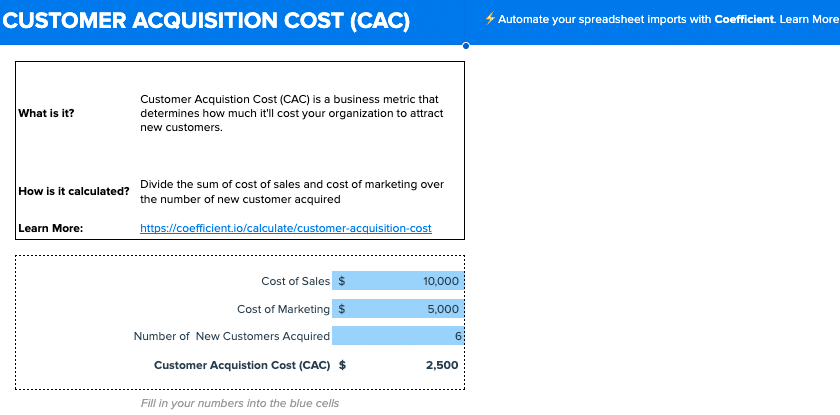
CAC measures the cost of acquiring a new customer, including marketing and sales expenses. Comparing CAC to CLV helps assess the efficiency of customer acquisition efforts.
The CAC:LTV ratio is a key indicator of the sustainability and profitability of a SaaS business. For instance, if a company spends $1,000 on marketing and sales to acquire 10 new customers, the CAC would be $100 per customer.
Master your CAC:LTV ratio with this intuitive template and ensure your growth strategy is on track!
Net Promoter Score (NPS)
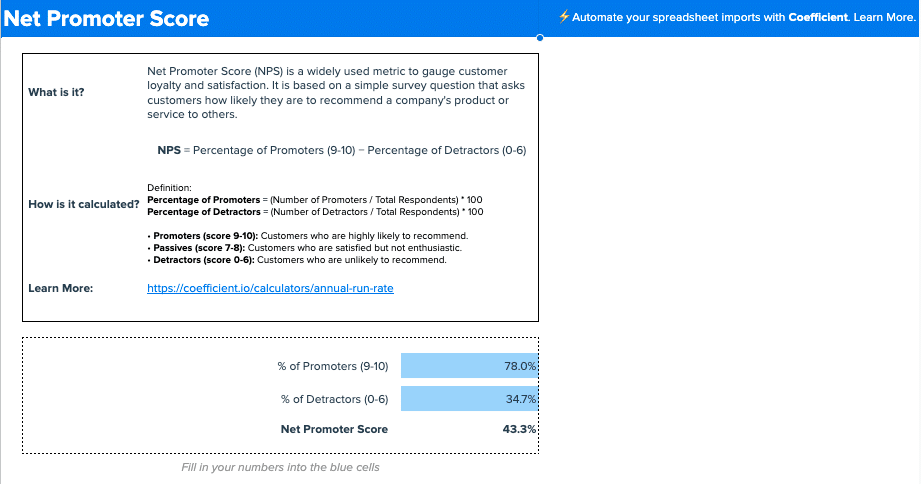
NPS is a metric that measures customer loyalty and satisfaction. It is based on a single question: “How likely are you to recommend our product or service to a friend or colleague?” Customers respond on a scale of 0-10, and the scores are categorized into Promoters (9-10), Passives (7-8), and Detractors (0-6).
To calculate NPS, subtract the percentage of Detractors from the percentage of Promoters. A high NPS indicates strong customer loyalty and can help drive growth through word-of-mouth referrals.
Track your NPS effortlessly with this template.
Other essential SaaS metrics to consider
- Lead Conversion Rate: The percentage of leads that convert into paying customers.
- Activation Rate: The percentage of users who actively engage with the product after signing up.
- Monthly Active Users (MAU): The number of unique users who engage with the product within a given month.
- Quick Ratio: The ratio of new MRR plus expansion MRR to lost MRR, indicating the efficiency of growth.
- Net Dollar Retention: The percentage of revenue retained from existing customers over a given period.
- Operating Margin: The percentage of revenue that remains after deducting operating expenses.
Overcoming Challenges in SaaS Data Analytics
Data Silos
SaaS businesses often use multiple platforms and tools, leading to data being scattered across different systems. This fragmentation makes it difficult to gain a comprehensive view of the business.
To overcome this challenge, companies should enable data accessibility from various sources in a centralized, familiar location such as spreadsheets, enabling easier analysis and decision-making.
Complexity of BI Tools
Traditional business intelligence (BI) tools can be complex and require specialized skills to operate effectively.
This complexity often hinders the adoption of data analytics across the organization. Opting for user-friendly tools that enable self-service analytics empowers non-technical users to explore and derive valuable insights from data independently.
Manual Data Consolidation
Manually gathering and consolidating data from different sources is time-consuming and prone to errors. Automating data integration processes helps save time and ensures data accuracy.
By implementing automated data pipelines and workflows, SaaS companies can streamline their data consolidation efforts and focus on analyzing insights rather than wrangling data.
Lack of Real-Time Insights
Delayed access to data can hinder timely decision-making, leading to missed opportunities. To address this challenge, SaaS businesses should adopt tools that provide real-time data access and visualization.
Real-time dashboards and reports enable teams to monitor key performance indicators and make informed decisions based on the most up-to-date information.

Stop exporting data manually. Sync data from your business systems into Google Sheets or Excel with Coefficient and set it on a refresh schedule.
Get Started
How to use SaaS Data Analytics to Drive Growth
Supercharge Marketing Campaigns
- Maximize marketing impact by analyzing channel traffic, top landing pages, and user engagement to identify the most effective channels and allocate resources accordingly.
- Optimize paid advertising ROI by tracking sales opportunities from paid ads and refining campaigns based on performance insights.
- Enhance SEO strategies by monitoring organic rankings, impressions, click-through rates (CTR), and branded vs. non-branded keyword performance to identify opportunities for improvement.
- Boost social media effectiveness by tracking social media growth metrics and engaging with the audience more effectively based on data-driven insights.
- Optimize email marketing performance by analyzing open rates, click metrics, and top-performing campaigns to improve engagement and conversions.
Accelerate Sales Growth
- Improve win rates by identifying bottlenecks in the sales pipeline through opportunity history analysis and taking corrective action.
- Optimize sales strategies by assessing team and rep performance with sales performance metrics and identifying top performers.
- Ensure accurate revenue forecasting by tracking sales to target and open pipe metrics and making data-driven adjustments to stay on track.
- Tailor sales strategies by identifying profitable markets through analysis of sales by country and industry.
- Refine sales processes and improve win rates by conducting win/loss analysis and implementing data-driven optimizations.
- Maximize sales outreach effectiveness by monitoring outreach sequence performance and ensuring sales reps are engaging prospects effectively.
- Drive sales growth by tracking key metrics like month-over-month (MoM) growth, total contract value (TCV), and revenue churn to measure business health and make data-driven decisions.
Inform Product Development
- Prioritize development efforts by analyzing feature usage and engagement metrics to identify the most valuable features and allocate resources accordingly.
- Optimize user experience by tracking user behavior and preferences to inform product roadmap decisions and ensure customer satisfaction.
- Improve user activation by monitoring the Activation Rate, identifying areas for improvement in the onboarding process, and implementing data-driven optimizations.
- Measure product stickiness and user retention by tracking Monthly Active Users (MAU) and making data-driven decisions to enhance user engagement.
Enhancing Customer Experience
- Identify areas for improvement by measuring Customer Satisfaction Score (CSAT) and addressing friction points in the customer journey.
- Assess customer loyalty and referral potential by calculating Net Promoter Score (NPS) and implementing strategies to improve customer advocacy.
- Maximize customer value by understanding and optimizing Customer Lifetime Value (CLV) through data-driven decision-making.
- Identify upselling and cross-selling opportunities by monitoring Net Dollar Retention and implementing targeted customer retention strategies.
Optimize Financial Performance
- Assess business health by monitoring Monthly Recurring Revenue (MRR) and making data-driven decisions to drive growth.
- Ensure profitable customer acquisition by comparing the cost of acquiring a customer (CAC) to their lifetime value (LTV) using the CAC:LTV Ratio template.
- Measure growth efficiency by tracking the Quick Ratio, which compares the rate of new and expansion MRR to lost MRR.
- Monitor profitability and efficiency by assessing the Operating Margin and making data-driven decisions to optimize financial performance.
Streamlining SaaS Data Analytics with Coefficient
Coefficient is a game-changer for SaaS businesses looking to streamline their data analytics processes and make informed decisions quickly.
By providing a centralized platform that integrates data from various sources, automates reporting, and facilitates collaboration, Coefficient empowers teams to uncover actionable insights and drive growth with ease. Here’s how Coefficient improves SaaS data analytics:
Blend live data from multiple systems
Coefficient’s pre-built connectors allow you to easily integrate data from your SaaS platforms, such as your CRM, billing software, and user engagement tools.
This means you can pull and consolidate data into a unified dataset automatically, saving time and ensuring accuracy. With all your data in one place, you can gain a comprehensive view of your business and make informed decisions based on the most up-to-date information.
Automate reporting and dashboards
Say goodbye to manual reporting and hello to automated dashboards that always display the latest data. Coefficient enables you to set up automatic data refreshes, ensuring that your reports and dashboards are always up to date.
This saves you time and allows your team to focus on analyzing insights and making data-driven decisions, rather than wasting hours on manual data entry and updates.
Collaborate effortlessly
Coefficient’s shared workspaces and granular access controls ensure that the right people have access to the data they need, while keeping sensitive information secure.
Empower your entire organization to make data-driven decisions and contribute to your success.
How Miro Leveraged Coefficient to Drive Growth
Miro, a leading SaaS collaborative whiteboarding platform, successfully harnessed the power of data analytics to fuel its rapid growth.
By analyzing user behavior and product usage data, Miro gained valuable insights into customer preferences and identified areas for improvement. The company leveraged these insights to optimize its pricing strategy, enhance its product features, and refine its marketing campaigns.
As a result, Miro experienced a significant increase in customer acquisition, user engagement, and revenue growth, solidifying its position as a top performer in the SaaS industry.
Read the full story to learn more.
Empowering Your SaaS Business with Data Analytics
In the highly competitive SaaS market, data analytics is essential for driving growth and success.
By tracking key metrics, addressing data challenges, and leveraging tools like Coefficient, SaaS businesses can make data-driven decisions that optimize their products, marketing campaigns, and customer experiences.
With the right data analytics strategy and tools, SaaS companies can unlock valuable insights, improve customer satisfaction, and achieve sustainable growth.
Empower your SaaS business with data-driven insights using Coefficient. Get started today for free!
