


Table of Contents
![]()
- 1. Better Salesforce Opportunity Stages, Better Forecast: Here’s How
-
2. How to create a report in Salesforce?
- What is Salesforce Report Builder?
- Pre-requisites to start creating a report in Salesforce
- Salesforce Report Types
- Step-by-Step Guide: How to Create Reports in Salesforce
- Customizing Salesforce Reports
- Saving and Sharing Reports
- Limitations of Building Reports in Salesforce
- How to schedule a Salesforce Report?
- Conclusion
- 3. A Guide to Custom Report Types in Salesforce
- 4. How to Create a Matrix Report in Salesforce
- 5. Joined Reports in Salesforce: Step-by-Step Tutorial
- 6. How to export opportunities from Salesforce
- 7. How to Build a Stage Report in Salesforce: A Step-by-Step Guide
- 8. How to Build a Salesforce Summary Report
- 9. How to Workaround Salesforce Report Limitations?
- 10. How to Clone a Report in Salesforce (And How to Never Do it Again)
- 11. How to Pull a Report in Salesforce
- 12. How to Share a Report in Salesforce
- 13. The Easy Way to Do Salesforce Field History Tracking
- 14. The Easy Way to Solve Salesforce Opportunity Management Problems

From the Salesforce reporting basics to advanced customization, this guide will equip you with the knowledge needed to transform raw salesforce data into creating strategic salesforce reports and tips of automating you SF reporting!
So, buckle up as we learn how to create reports in Salesforce!
PS. If you prefer video tutorials, we’ve got you! If not, keep scrolling for the written tutorial.
What is Salesforce Report Builder?
Salesforce Report Builder is a dynamic tool designed to unravel the Salesforce data. This tool operates within the Salesforce Classic and Lightning interface, providing an intuitive platform for crafting detailed reports without requiring intricate technical skills.
Capabilities of Salesforce Report Builder
Before we explain how to create reports in Salesforce Lightning, you need to know what features it offers
- Effortless Report Creation: Simplifies the process of generating reports, allowing users to select relevant data fields and parameters effortlessly.
- Data Filtering: The tool empowers users to filter data based on specific criteria, ensuring that reports present the information needed for insightful analysis.
- Visual Representation: Its integration with charts and graphs transforms raw data into visually appealing representations, making it easier to identify trends and patterns.
- Customization: Tailor your reports to your unique needs by customizing layouts, formatting, filters, and even incorporating conditional formatting to highlight critical data points.
Pre-requisites to start creating a report in Salesforce
Before diving straight into the process of building your report, ensure you have the following essentials in place:
- Access Permissions: Confirm that your Salesforce user profile has the necessary permissions to create and edit reports. This ensures a seamless experience without any access hurdles.
- Defined Object Relationships: Understand the relationships between Salesforce objects relevant to your report. Clear object relationships pave the way for comprehensive and interconnected data analysis.
- Data Availability: Verify that the data you intend to report is populated and up-to-date within Salesforce. Timely and accurate data is the bedrock of meaningful reports.
Salesforce Report Types
Salesforce offers various report types to help you analyze and present your data effectively:
1. Tabular Reports
Tabular reports display data in simple rows and columns, like a spreadsheet. They’re ideal for creating lists of records or exporting data. Use these when you need a straightforward view of your data, such as a list of all contacts or accounts.
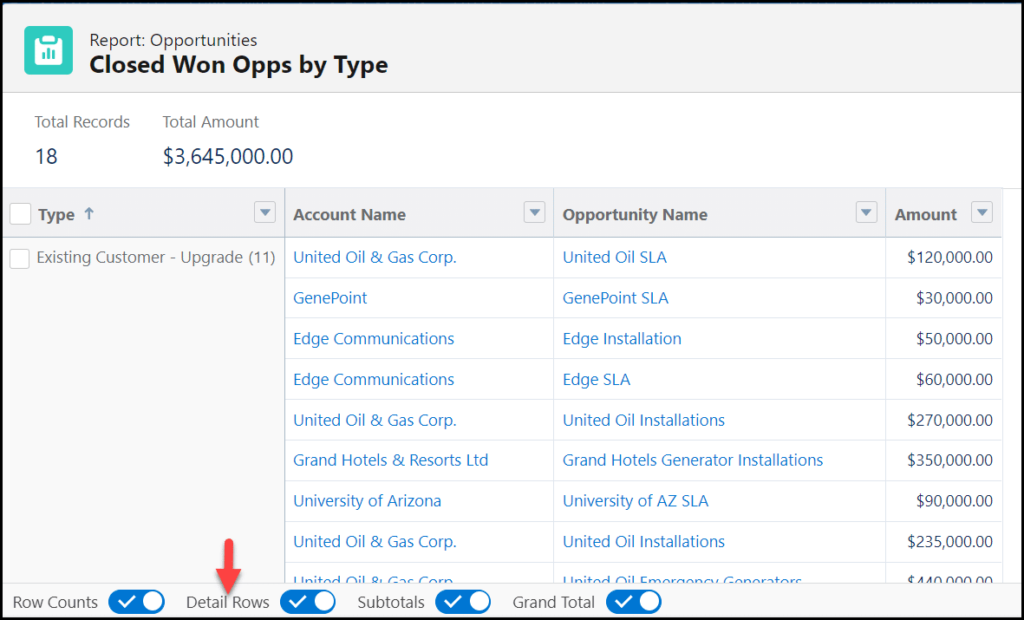
2. Summary Reports
Summary reports group data and show subtotals, allowing for a more organized view. They’re perfect for analyzing data by categories, such as sales pipelines grouped by stages. Use these when you need to see data hierarchically, like opportunities by account. Here is the step-by-step guide to create Summary reports in Salesforce.
3. Matrix Reports
Matrix reports display data in a grid format, grouping by both rows and columns. They’re excellent for comparing related totals across different dimensions. Use these for complex comparisons, such as sales performance across products, regions, and time periods. Here’s a detailed walkthrough on building a matrix report in salesforce.
4. Joined Reports
Joined reports combine data from multiple report types into a single report. They provide different views of related information side by side. Use these when you need to compare data from different objects, like leads and opportunities, in one comprehensive report. Here’s detailed guide to building joined reports in Salesforce.
5. Standard Object-Specific Reports
Salesforce also provides report types based on standard objects:
- Accounts and Contacts Reports: For analyzing account and contact relationships.
- Opportunities Reports: For tracking sales progress and product performance.
- Leads Reports: For monitoring lead conversion and source effectiveness.
- Cases Reports: For assessing support case resolution and trends.
- Activities Reports: For reviewing tasks and events linked to various objects.
- Campaigns Reports: For evaluating marketing campaign performance and ROI.
6. Custom Report Types
Custom Report Types allow you to create tailored reports for unique data relationships within your organization. These are particularly useful when standard report types don’t meet your specific needs. Here’s a quick guide to building custom reports in Salesforce.
Tips on Report Types in Salesforce: When to Use Them
- Tabular Reports: Ideal for simple lists with no subtotals, providing a straightforward data view.
- Summary Reports: Perfect for grouping data and displaying subtotals, offering a more organized and structured overview.
- Matrix Reports: Suited for complex data analysis with both row and column grouping, allowing for a comprehensive view of relationships.
- Joined Reports: Combining data from multiple report types into a single view provides a holistic perspective.
Step-by-Step Guide: How to Create Reports in Salesforce
You’re all set with your data and Salesforce account in place. Now it’s time to get into report building, so make sure you follow through the steps:
Navigate to Report Builder
To get started with your journey, begin by navigating to the Salesforce Lightning interface.
Once logged in to your Salesforce account, direct your attention to the taskbar ribbon on your dashboard. This is your gateway to several Salesforce application tabs and tasks.
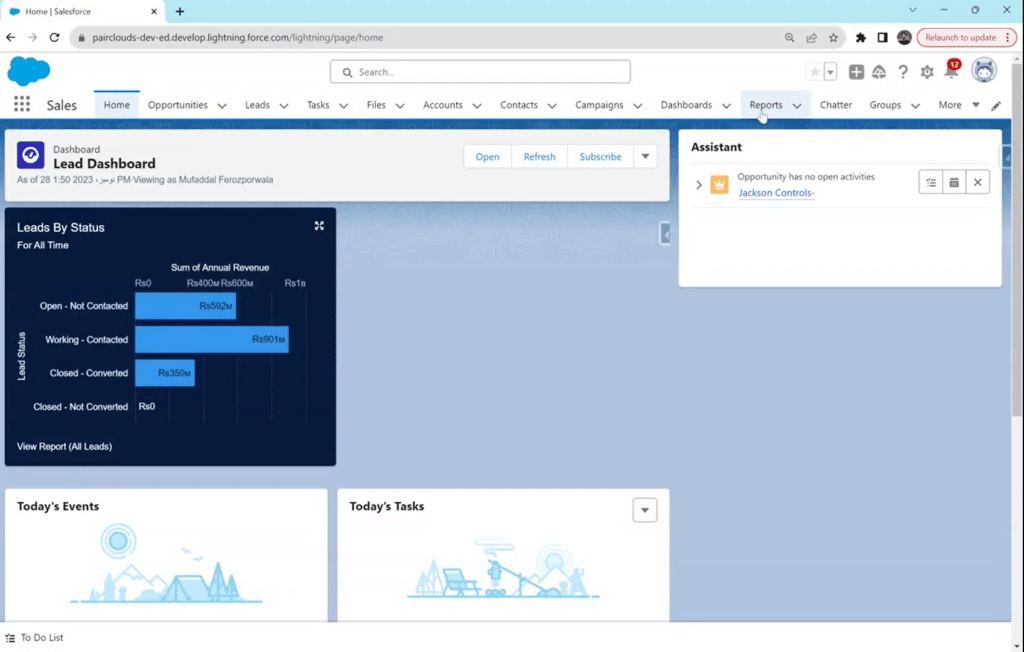
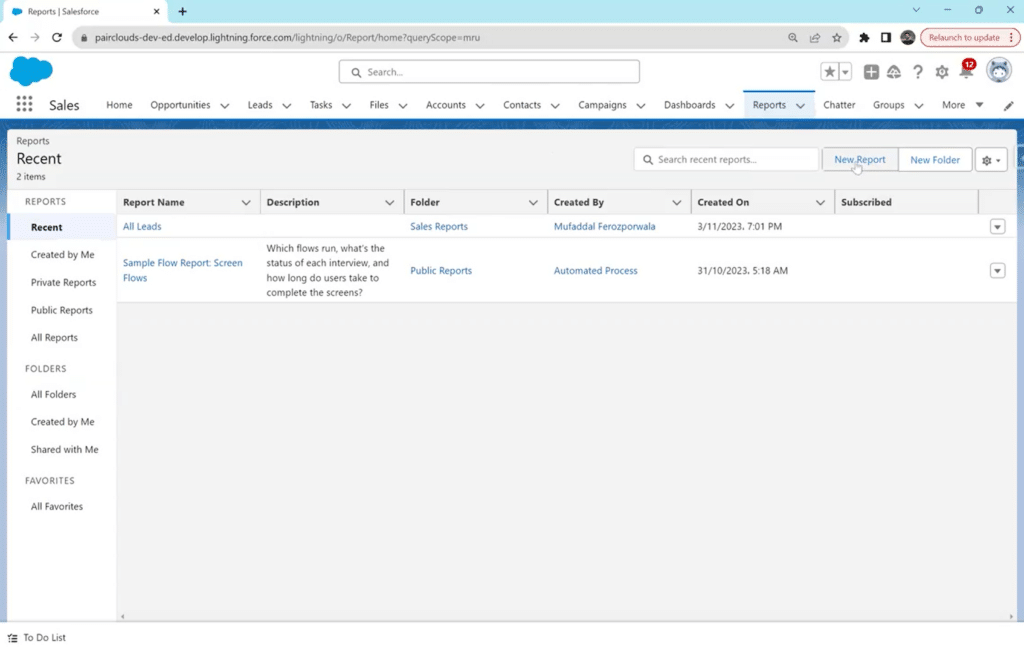
In the taskbar, directly select the “Reports” tab and navigate to ‘New Report’ to open the Report Builder.
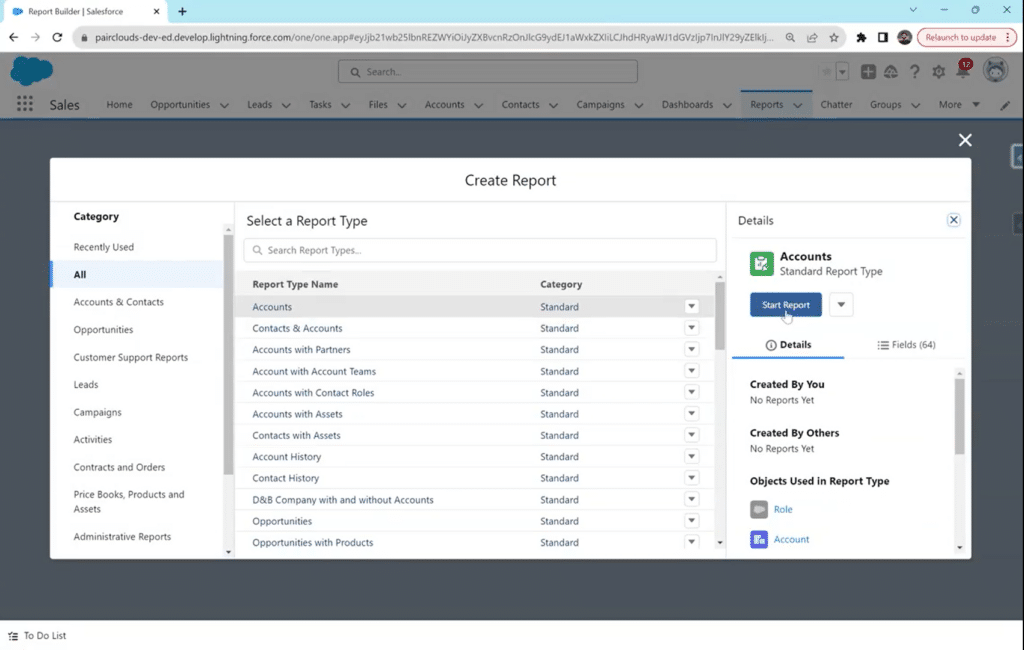
Choose a Report Type
As the next window opens, you must first choose the object you wish to create a report on – your report type.
Select the appropriate category, or navigate to ‘All’ and select the report type based on the data you wish to analyze.
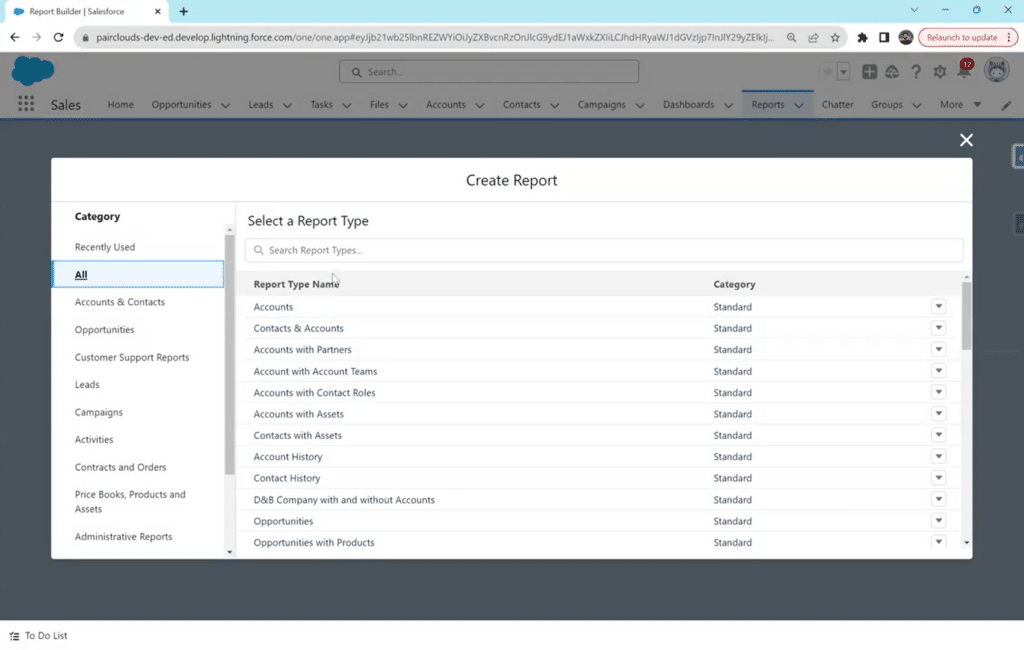
Salesforce offers standard report types, including Tabular, Summary, Matrix, and Joined reports. Each type serves a unique purpose, so choose the one that aligns with your reporting needs.
In our example, we will use ‘Accounts’ as our report type.
Once you’ve selected the report type, click ‘Start Report.’
Add Fields to Your Report
Now, you’ll be redirected to the Fields pane. This is where you handpick the data fields you want to include in your report. This step allows you to customize your report to focus on specific information relevant to your analysis.
Start by selecting a date filter. You can choose from various options, from the current fiscal year to last week, or simply ‘All Time.’
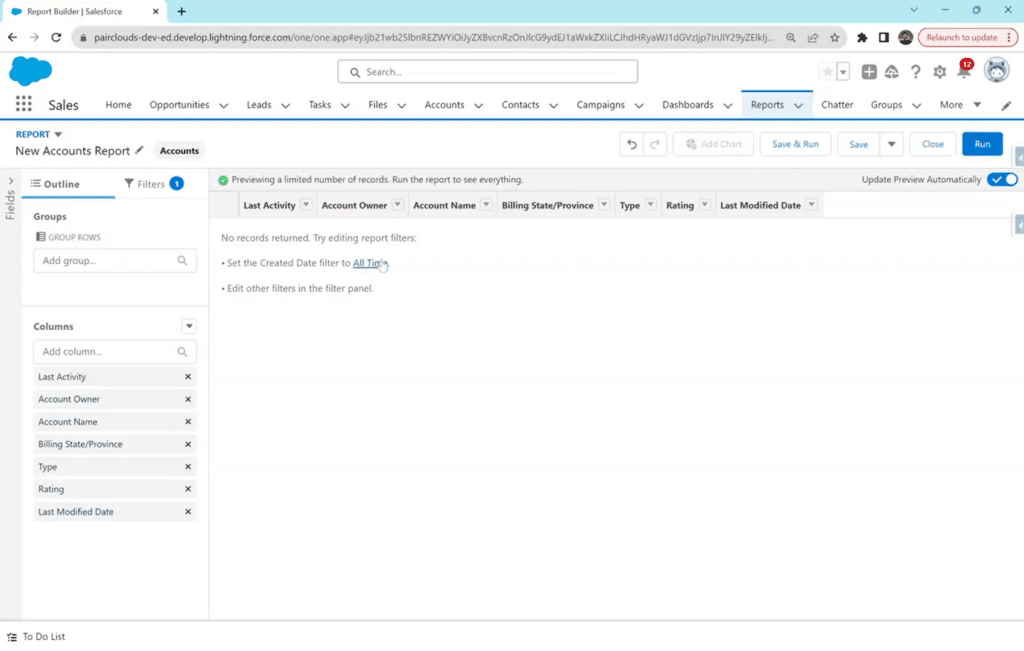
After selecting your data’s time frame, Salesforce will automatically generate the report.
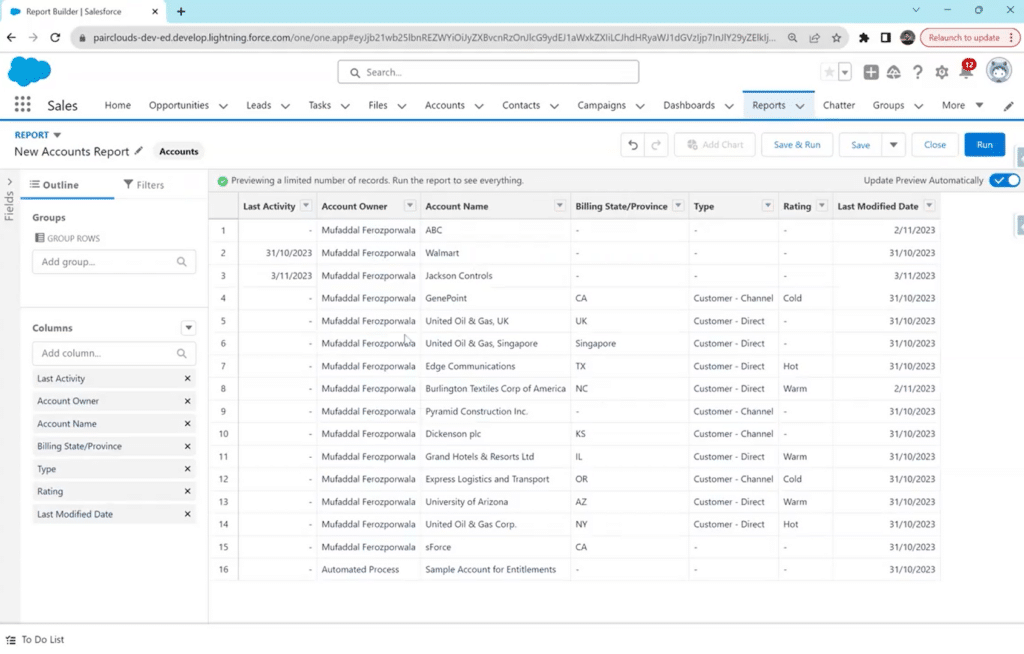
Set Filters and Criteria
Refine your report by adding filters and criteria. Whether it’s narrowing down data based on specific dates, categories, columns, or other parameters, filters ensure your report delivers targeted insights.
You can also remove some columns to make the data more precise by navigating to the left sidebar and simply clicking on the ‘x’ mark to delete all columns from your report that match the criteria.
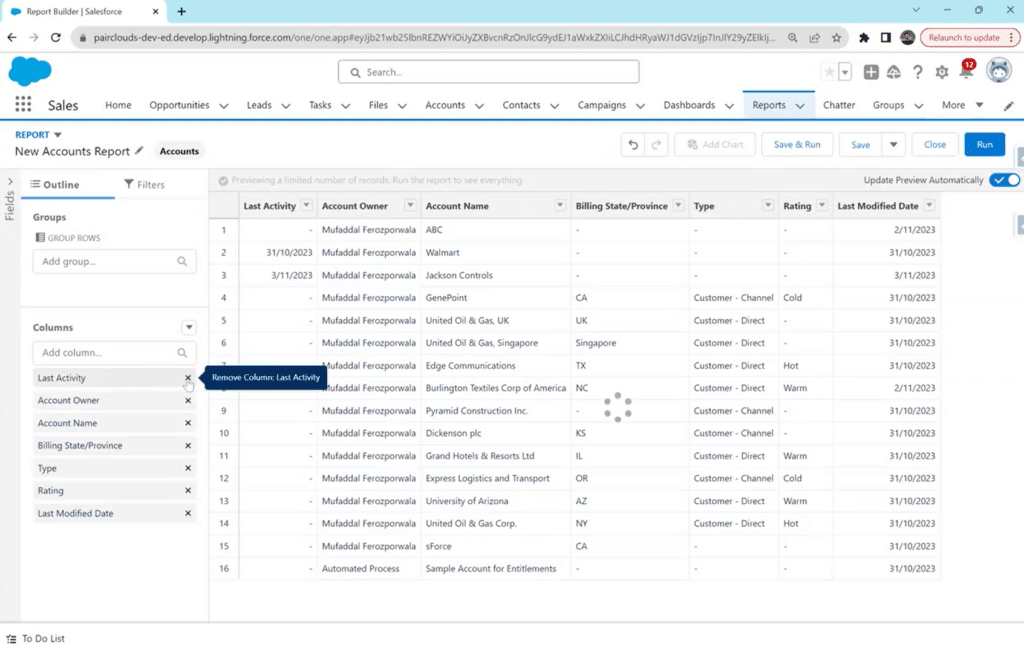
You can also add columns not generated automatically by Salesforce from the search bar, e.g., created by date, created by (user), and other specific criteria to further add details to your report.
Group Data (Optional)
For a more organized view, consider grouping data based on specific fields. This step helps in creating a structured report that highlights trends and patterns.
In the ‘Group Rows’ section, type the word for whatever group you wish to sort for. For example, type “Industry” and your data will be grouped based on industries as shown below:
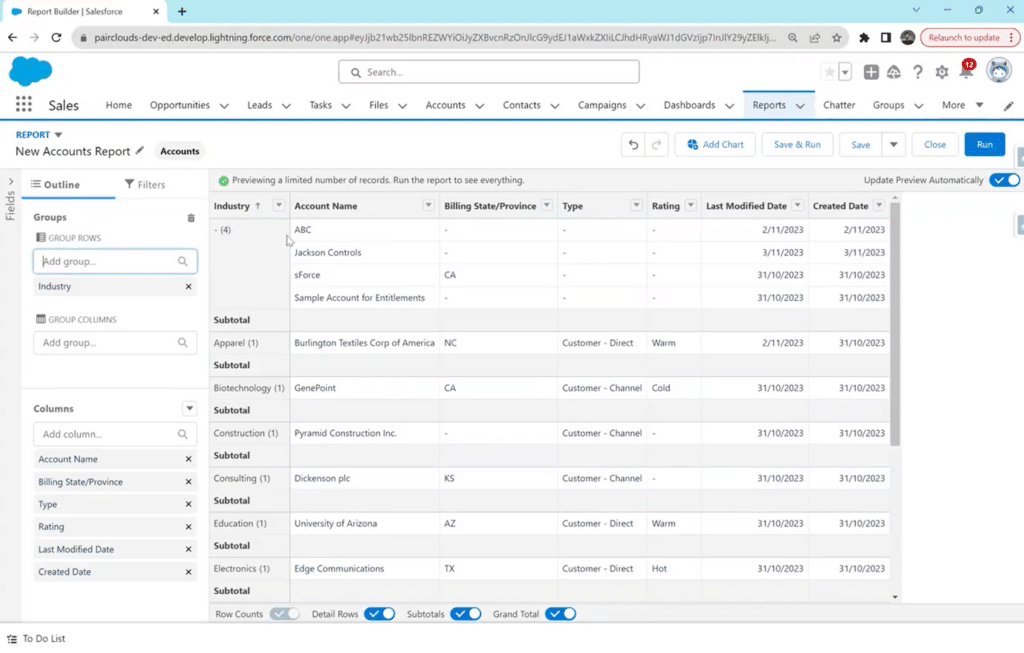
Here, customers’ accounts have been grouped into different types of industries they were marked, e.g., apparel, construction, and consulting. For data that does not belong to any specific industry, you can see a ‘-.’
Important: You can only add data visualization to your reports if you have created data groups. If you don’t need any data groups or choose not to make any, Salesforce will disable the visualization option.
Add Charts and Filters
Enhance the visual appeal of your report by incorporating charts and graphs. Choose from various chart types to represent your data in a way that is easy to understand and visually impactful.
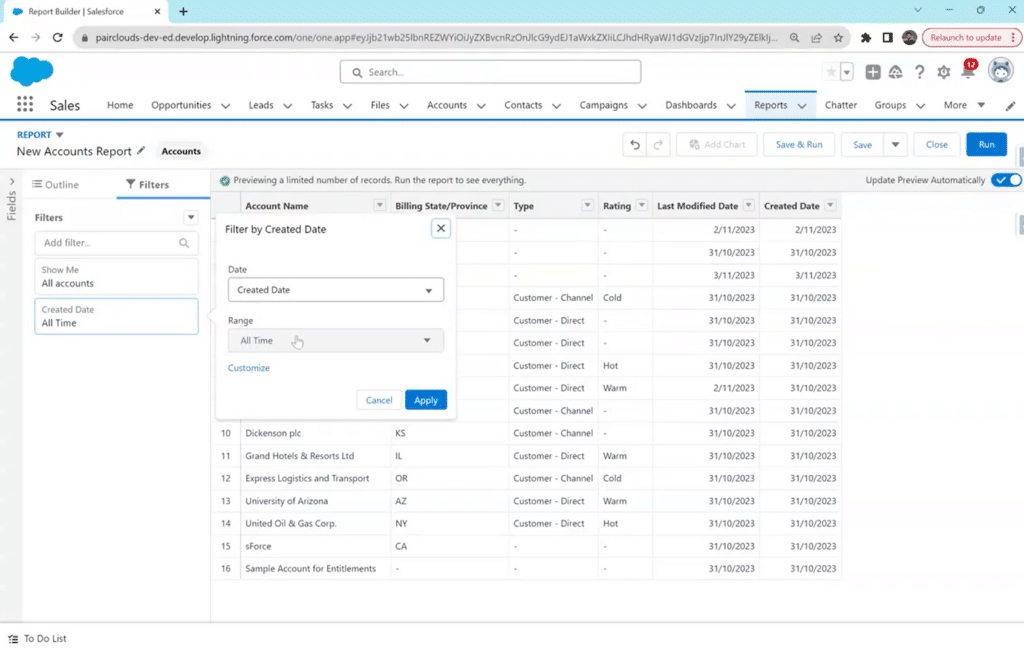
Also, refine your data set with filters by precisely adjusting ranges. For example, you can sort data based on creation date, publisher, and owner. When setting date filters, consider using dynamic options like “This Month” or “Last Quarter” for reports that require real-time relevance.
Click on the ‘Filters’ tab in the Fields sidebar and type your filter categories in the search bar. Select the right option from the drop-down menu.
Customizing Salesforce Reports
Customizing reports goes beyond aesthetics. It’s about presenting data that resonates with your audience, facilitating better comprehension and decision-making.
Here are some tips for making your reports more readable and informative:
- Consistent Formatting – Maintain consistency in formatting throughout your report. A uniform layout improves readability and makes navigating and understanding the information presented easier for users.
- Use Conditional Formatting – Highlight crucial data points with conditional formatting. Whether color-coding cells based on specific criteria or adding icons for emphasis, this feature draws attention to critical insights.
- Strategic Use of White Space – Avoid clutter by strategically incorporating white space. Well-organized reports with balanced spacing create a clean and professional appearance, facilitating easier absorption of information.
- Choose Appropriate Chart Types – Select chart types that align with your data and analysis goals. Bar charts are effective for comparisons, while line charts are suitable for showcasing trends over time. Experiment with different options to find the most appropriate visualization for your insights.
- Include Descriptive Labels – Ensure clarity by providing descriptive labels for your fields and data points. Descriptive labels contribute to the overall understanding of the report, making it accessible to a broader audience.
For even more customization options, try Coefficient. It lets you pull Salesforce data into spreadsheets, giving you more flexibility to create custom reports. This makes it easier to build exactly the kind of reports you need, with all the features of spreadsheet software at your fingertips. Companies like Miro, Klaviyo has saved so many hours using Coefficient for Salesforce Reporting.
Saving and Sharing Reports
Once you’ve crafted the perfect report in Salesforce Report Builder, it’s essential to safeguard your hard work.
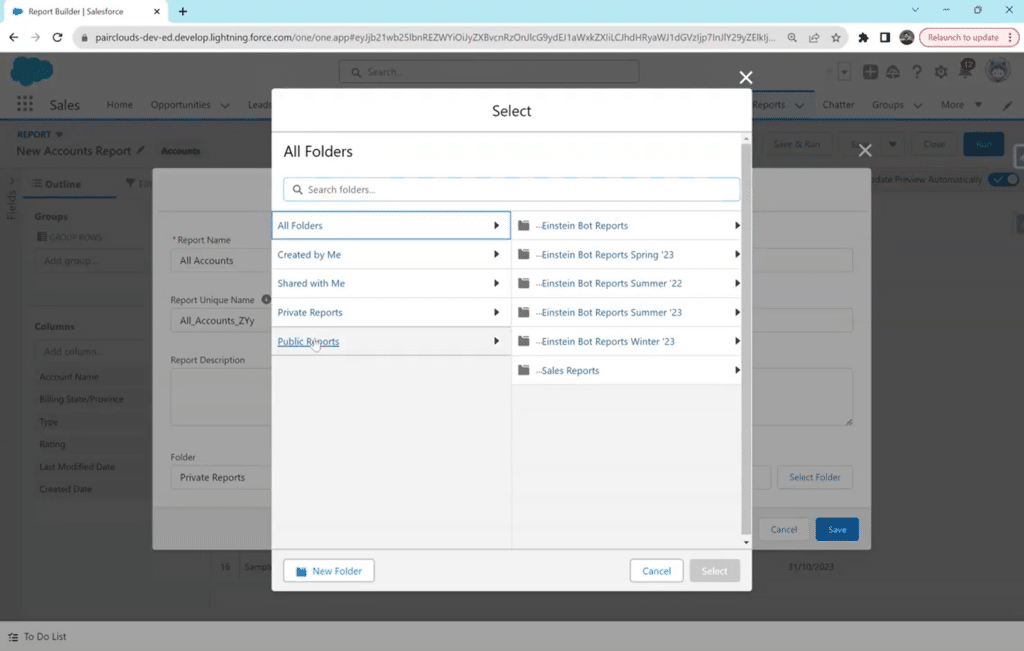
Click on the “Save” button, and a dialogue box will prompt you to provide a meaningful name and description for your report. This helps you identify and recall the report later and contributes to organized data management within Salesforce.
You will also be directed to choose a folder to place your report in. Create a new folder or select an existing one. This is a crucial step before your report is saved!
Save and Sharing Options
Sharing your insights is as crucial as generating them. It’s important to note that you can only share folders that contain your reports rather than your complete dashboards. When you give access to other users, you will need to manage access limitations to ensure what reports the other user can edit, delete, or only view.
If you want other options to save, click the arrow next to ‘Edit’ and select other methods from the drop-down menu.
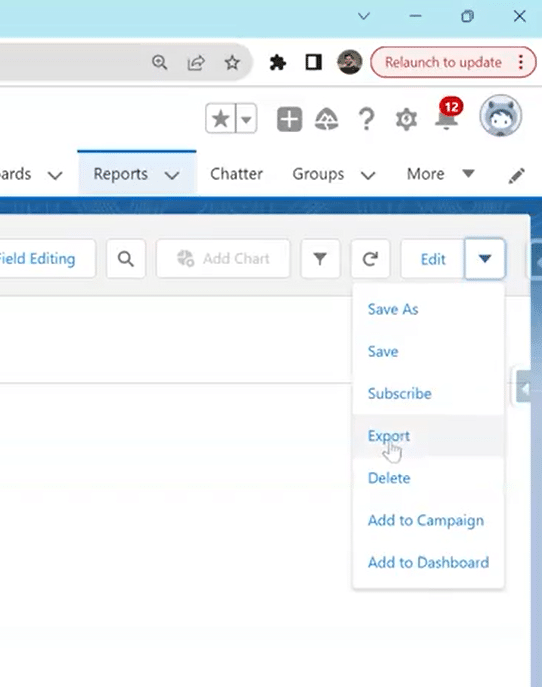
You can save your report mainly as an Excel sheet as an alternative option.
Limitations of Building Reports in Salesforce
Despite its robust capabilities, Salesforce reporting has some significant constraints:
- Data Volume Limits: Reports can time out or fail to run when dealing with large datasets (typically over 2,000 records), impacting real-time analysis of big data.
- Lack of Real-Time Data: Reports are based on the last data snapshot, which can be up to 30 minutes old, potentially leading to decisions based on outdated information.
- Complex Cross-Object Reporting: Creating reports that span multiple objects often requires custom report types, which can be challenging to set up and maintain.
- Limited Visualization Options: While Salesforce offers basic charts, advanced visualizations or custom chart types are not natively supported, restricting data presentation options.
- Sharing and Collaboration Hurdles: Sharing reports across teams or with external stakeholders can be cumbersome, often requiring manual exports or additional user licenses.
To overcome these limitations and create more flexible reports, consider using Coefficient. It enables you to pull Salesforce data directly into spreadsheets, allowing for real-time updates, advanced visualizations, and easier sharing across your organization.
How to schedule a Salesforce Report?
Scheduling reports in Salesforce lets you automatically run and send reports at set times. Here’s how to do it:
- Save your report: After creating or customizing your report, click “Save & Run”. Give it a name and choose where to save it.
- Find the scheduling option: Go to the Reports tab, find your saved report, and open it. Click the dropdown arrow next to “Edit” and select “Subscribe”.
- Set up the schedule: Choose how often you want the report sent – daily, weekly, or monthly. Pick who should receive it and how it should be delivered (as a summary or full report).
- Add conditions (optional): You can set rules for when the report should be sent, like only when certain data changes.
- Save and you’re done: Click “Save” to activate your scheduled report.
You can always change or stop these scheduled reports later by going back to the “Subscribe” option.
Coefficient can make this process even easier. It lets you automatically update your spreadsheets with fresh Salesforce data, so you always have the latest info without scheduling multiple reports.
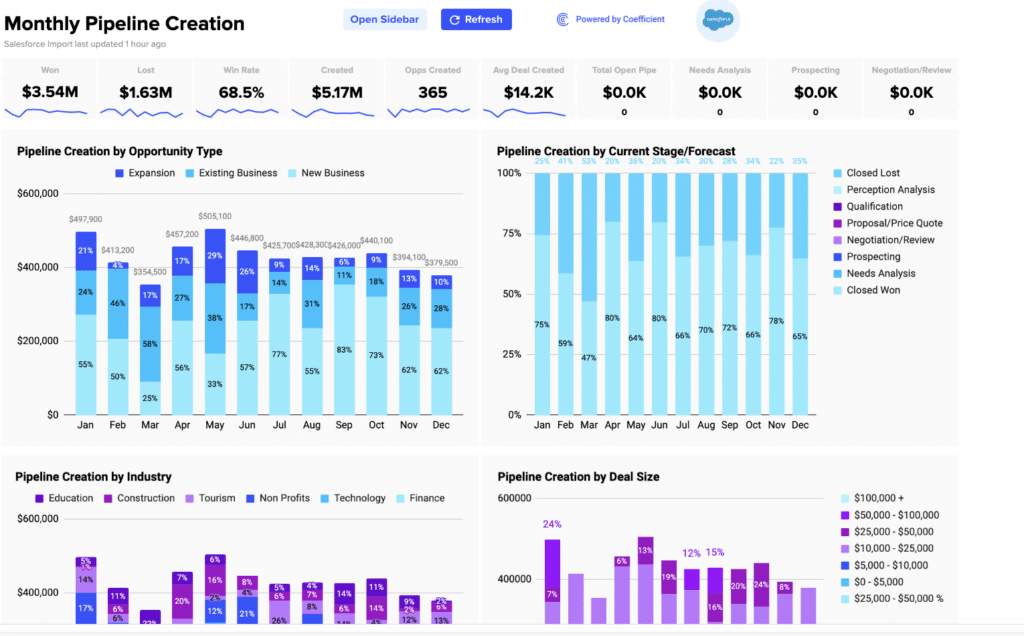
For example, Coefficient’s Sales Pipeline Creation Dashboard offers powerful features:
- Filter sales activities by team members, sales cycle, time period, or opportunity type directly in Google Sheets.
- Visualize core pipeline creation metrics with pre-built dashboards.
- Track pipeline by opportunity type, industry, deal stage, and other key segments.
- Monitor overall performance, including win rates and closed opportunities.
- Automatically sync with real-time Salesforce data for up-to-date metrics.
Conclusion
Learning to create salesforce reports opens a gateway to transformative insights, empowering users to navigate and analyze their sales data precisely. From crafting customized reports to seamlessly sharing them with stakeholders, enables companies to gain valuable insights than can help with key decisions with sales strategies.
However, the need for an automated and advanced approach to saving and sharing reports becomes evident in the ever-evolving data management landscape.
So, elevate your data integration game with Coefficient.io, revolutionize how you save track, and share your Salesforce reports.


