How to show pipeline coverage ratio on a Salesforce sales leaderboard dashboard

Sales Ops and RevOps managers can calculate pipeline coverage ratio and sales velocity dynamically, per rep, per territory and per time period, in Google Sheets or Excel using Coefficient’s Salesforce connector, combining Opportunity data with quota data in a single refreshing dashboard. Salesforce native dashboards struggle with these metrics because they require joining pipeline data against quota data from a separate object or external source and calculating ratios dynamically across changing close dates and remaining quota balances.

A common challenge for Sales Ops teams: pipeline coverage and sales velocity are the two numbers sales leadership asks about most, yet both require calculations Salesforce can’t run natively without custom formula fields or a BI tool licence.

How to build a pipeline coverage and sales velocity dashboard

Step 1. Import Opportunity data with stage and close date fields

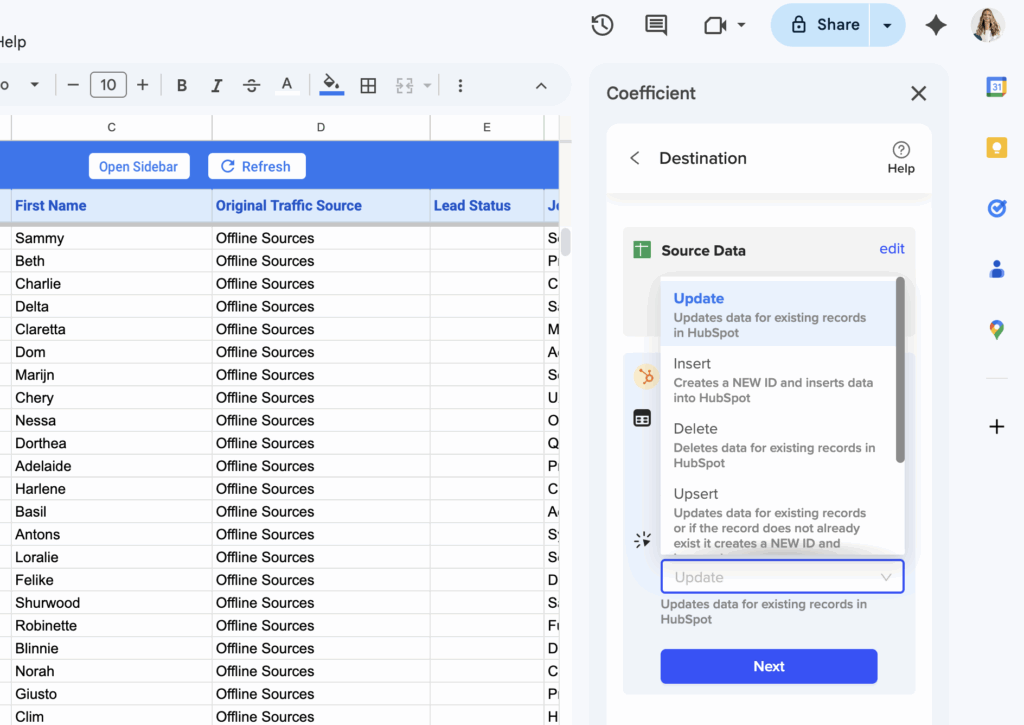
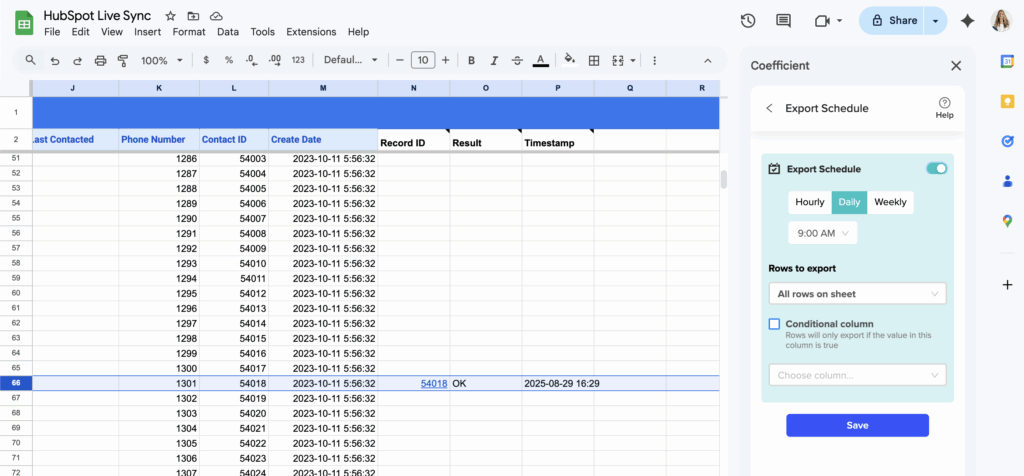
Open Coefficient in Google Sheets or Excel and select Import from Salesforce. Use From Objects and Fields to pull Opportunity records with Amount, StageName, CloseDate, CreatedDate, OwnerId and Probability. Apply a dynamic date filter scoped to your current quarter close dates to keep the import focused on active pipeline. Set an hourly or twice-daily refresh to keep coverage calculations current as deals move.

Step 2. Import quota data and calculate remaining quota per rep

Create a second import for your quota source, a custom Salesforce object, a separate sheet, or an external file you paste in manually. Add a formula column calculating remaining quota for each rep: total quota minus closed-won amount for the period. This is the denominator for your coverage ratio and the input your sales velocity formula needs.

Step 3. Build coverage ratio and sales velocity formulas

Add a summary table with one row per rep. For pipeline coverage, divide total open pipeline value for the rep by their remaining quota: open pipeline sum divided by remaining quota. For sales velocity, use the standard formula: number of qualified opportunities multiplied by average deal value multiplied by win rate, divided by average sales cycle length in days. Use COUNTIFS, AVERAGEIFS and SUMIFS referencing your Opportunity import to keep each component dynamic.

Step 4. Add conditional formatting thresholds and trend tracking

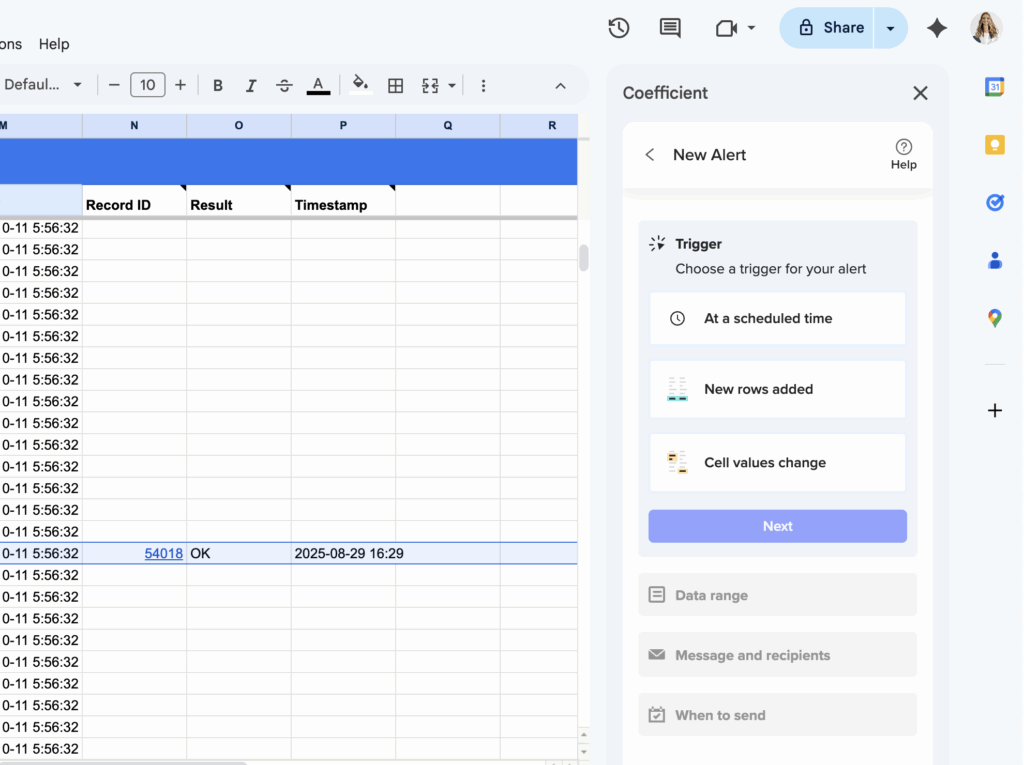
Apply conditional formatting to the coverage ratio column: red for below 1.5x, amber for 1.5x to 3x, green for above 3x, the standard thresholds most sales orgs use. Use Coefficient’s snapshot feature to capture coverage ratio values at the end of each week, so you can add a trend column showing whether each rep’s coverage is improving or declining over the past four weeks.

What you get

Pipeline coverage and sales velocity update automatically as deals move and quota data refreshes. Sales leaders see which reps are under-covered before the quarter closes, not after. Trend data surfaces whether the pipeline is building or eroding week over week. For layout reference on how to present Salesforce pipeline metrics alongside rep-level data, see Coefficient’s Salesforce dashboard examples.

Start tracking pipeline coverage and sales velocity automatically at coefficient.io/get-started.

How to show user-specific data in Salesforce dashboards without dynamic licenses

Salesforce’s static dashboards show the same data to every viewer because they run in the dashboard owner’s security context. This means everyone sees the owner’s records, not their own personalized data.

You’ll learn how to create truly personalized dashboards that display each user’s specific data without paying for expensive dynamic dashboard licenses.

Create personalized Salesforce dashboards in spreadsheets using Coefficient

CoefficientSalesforceThe solution involves building user-specific dashboards in Google Sheets or Excel usingto import livedata with custom filters. Each user gets their own dashboard that automatically shows only their records – opportunities, leads, cases, and accounts they own.

How to make it work

Step 1. Set up user-specific data imports in your spreadsheet.

SalesforceUse Coefficient’s “From Objects & Fields” feature to importrecords with filters like “Owner ID equals [User ID]” or “Owner Email equals [User Email]”. This ensures each import only pulls records belonging to that specific user.

Step 2. Create dynamic filtering for flexible user switching.

Set up Coefficient’s dynamic filters that reference a cell containing the current user’s ID or email. When you change the cell value, the import automatically refreshes to show that user’s records without editing the import settings.

Step 3. Build dashboard visualizations that update automatically.

Create charts, pivot tables, and summary metrics in your spreadsheet that automatically update when the underlying filtered data refreshes. Use formulas to calculate win rates, pipeline values, and goal attainment specific to each user.

Step 4. Control access with spreadsheet sharing permissions.

Use Google Sheets or Excel sharing permissions to ensure each user only accesses their personalized dashboard version. You can create individual sheets for each user or use a template approach with dynamic filters.

Step 5. Schedule automatic data refreshes.

Set up Coefficient to refresh user data hourly, daily, or weekly so dashboards always show current information without manual intervention. This keeps personalized metrics up to date automatically.

Skip the licensing fees and get better functionality

Try CoefficientThis approach eliminates dynamic dashboard license costs while providing more advanced filtering and visualization options than native Salesforce dashboards.to build your first user-specific dashboard today.

How to split large HubSpot contact lists into smaller segments for email campaigns

HubSpot’snative list management can’t easily split large contact lists into equal segments for sequential email sends, and there’s no built-in batch size management for campaigns over 1,000 contacts.

Here’s how to automatically segment large contact lists into manageable batches with precise size control and sequential timing.

Create automated batch segments for sequential campaigns using Coefficient

Coefficienthandles automated list segmentation through advanced filtering and conditional export capabilities. You can use Excel formulas to assign batch numbers to contacts, then create multiple HubSpot static lists with different filter criteria.

HubSpotThe key advantage is dynamic batch sizing. You can adjust segment sizes by changing filter values in Excel cells without recreating the entire workflow.can’t automatically split lists into equal-sized segments or provide batch processing for large email sends.

How to make it work

Step 1. Add batch assignment formulas to your contact data.

Use Excel formulas like =MOD(ROW(),500)+1 to assign every 500 contacts to sequential batches. This creates numbered batches (1, 2, 3, etc.) that you can filter on later.

Step 2. Set up multiple Contact List Sync exports with batch filters.

Create separate import configurations in Coefficient, each filtering on different batch numbers. For example, one export filters where Batch_Number=1, another where Batch_Number=2, and so on.

Step 3. Schedule sequential list creation.

Use Coefficient’s scheduling feature to create batch lists at timed intervals. Set daily schedules to automatically generate new batch lists for sequential email campaigns.

Step 4. Implement proportional distribution for A/B testing.

Use RANDBETWEEN formulas to randomly assign contacts to batches while maintaining equal distribution. This ensures your A/B test segments are properly balanced.

Step 5. Set up email alerts for campaign readiness.

Configure Coefficient’s email alerts to notify your marketing team when new batch lists are created and ready for email sends. This automates campaign preparation workflow.

Optimize email deliverability with controlled batch sizes

Get startedAutomated batch segmentation helps you manage large email volumes while maintaining deliverability best practices.with automated list segmentation for your email campaigns.

How to structure opportunity touchpoint data in Salesforce sales activity reports

Structure touchpoint data by linking all Tasks and Events to Opportunity records through WhatId relationships, include stage history tracking, and map activity timing to deal progression for comprehensive touchpoint analysis.

Salesforcestruggles with complex touchpoint analysis because it requires joining multiple objects and calculating patterns across time periods. Here’s how to build touchpoint tracking that reveals what actually moves deals forward.

Build touchpoint analysis using Coefficient

CoefficientSalesforceexcels at touchpoint analysis through custom SOQL queries and cross-object relationships. You can map every activity to deal outcomes and calculate touchpoint effectiveness patterns that aren’t visible in standardreports.

How to make it work

Step 1. Import primary opportunity data with touchpoint context.

Pull in Opportunity fields like Id, Name, StageName, Amount, CloseDate, CreatedDate, plus context fields like Lead_Source__c, Pipeline_Category__c, and Deal_Size_Tier__c to segment touchpoint analysis by deal characteristics.

Step 2. Map all activity touchpoints to opportunities.

Import Tasks and Events where WhatId equals Opportunity.Id. Include activity fields like Subject, ActivityDate, Type, Status, Duration_Minutes__c, Meeting_Type__c, and Outcome__c to track touchpoint quality and timing.

Step 3. Include stage progression history.

Import OpportunityFieldHistory records to track stage changes over time. This lets you correlate activities with stage advancement and calculate touchpoint effectiveness by deal progression.

Step 4. Use custom SOQL for complex touchpoint queries.

Write queries like “SELECT Id, Name, StageName, (SELECT Subject, ActivityDate, Type FROM Tasks WHERE ActivityDate = LAST_N_DAYS:30) FROM Opportunity WHERE StageName IN (‘Qualified’,’Proposal’)” to get touchpoints by deal stage and timeframe.

Step 5. Calculate touchpoint effectiveness metrics.

Use formulas to create metrics like “Days between touchpoints” with date calculations, “Activities per stage” with COUNTIFS functions, and “Touchpoint velocity” by analyzing activity frequency patterns across deal progression.

Step 6. Set up touchpoint scoring and exports.

Calculate engagement scores based on touchpoint patterns and export these back to Opportunity records as Engagement_Score__c or Touchpoint_Quality__c fields for sales team visibility and prioritization.

Discover what touchpoints actually drive deals

Start buildingProper touchpoint analysis reveals patterns like “Opportunities with >5 touchpoints in first 30 days have 3x higher close rates.” This insight helps you coach reps on effective engagement strategies and prioritize high-touch activities.touchpoint analysis that shows what really moves deals forward.

How to sync Google Sheets form responses to HubSpot contacts for conditional email workflows

HubSpotCoefficientYou can sync Google Sheets form responses directly tocontacts and trigger conditional email workflows automatically using.

This guide shows you how to set up real-time form data synchronization and create automated email sequences based on your Google Sheets responses.

Bridge the gap between Google Forms and HubSpot automation using Coefficient

HubSpot’s native form tools only work with forms created inside HubSpot. But many teams prefer Google Forms for data collection and want to keep their existing Google Sheets workflow while gaining HubSpot’s email automation power.

Coefficient solves this by creating a direct bridge between your Google Sheets form responses and HubSpot contact properties. Once your form data syncs to HubSpot, workflows can trigger automatically based on the imported information.

How to make it work

Step 1. Connect your Google Sheets form responses to Coefficient.

Open your Google Sheets document with form responses. Install Coefficient from the Google Workspace Marketplace, then click the Coefficient sidebar. Go to “Connected Sources” and select Google Sheets to establish the connection.

Step 2. Set up scheduled exports to HubSpot.

In Coefficient’s sidebar, choose “Export to HubSpot” and select your form response sheet. Configure the scheduled export to push new responses hourly or in real-time. Choose “Append New Data” to ensure new form responses are added without overwriting existing contacts.

Step 3. Map form fields to HubSpot contact properties.

Coefficient automatically maps common fields like name, email, and phone. For custom form questions, create corresponding HubSpot properties (dropdown for status, checkboxes for multi-select answers, date properties for timestamps). Map each Google Sheets column to its matching HubSpot property.

Step 4. Create conditional HubSpot workflows.

In HubSpot, build workflows that enroll contacts based on the synced form data. Set enrollment criteria using the imported properties – for example, enroll contacts where “Application Status” equals “Submitted” or “Interest Level” is “High Priority.”

Step 5. Enable bi-directional tracking.

Set up Coefficient imports to pull HubSpot email engagement data back to your Google Sheets. This creates complete visibility – you can see form responses, email opens, clicks, and sequence completion all in one spreadsheet.

Start automating your form response workflows

Try CoefficientThis setup keeps your familiar Google Forms process while adding HubSpot’s sophisticated email automation. Your team gets the best of both platforms without changing existing workflows.to connect your forms and start automating today.

How to sync HubSpot contact updates bidirectionally with Google Sheets without workflow limitations

HubSpot workflows create significant limitations for bidirectional sync: they only trigger on initial property assignments, lack real-time capabilities, and provide no reliable way to push spreadsheet changes back to HubSpot.

You need complete bidirectional synchronization that eliminates workflow dependencies. Here’s how to get reliable two-way data flow between HubSpot and Google Sheets.

Get complete bidirectional sync using Coefficient

Coefficient provides a complete bidirectional synchronization between HubSpot and Google Sheets or Excel by establishing direct API connections that bypass HubSpot’s trigger-based system entirely. This enables reliable inbound sync fromto Sheets and outbound sync from Sheets back to HubSpot.

The system captures every property modification through scheduled imports while pushing spreadsheet changes back to HubSpot through automated exports, creating seamless two-way data flow.

Coefficient is a certified HubSpot App Partner on HubSpot’s app marketplace. Here’s a full walkthrough of how it works.

How to make it work

Step 1. Set up comprehensive HubSpot contact import with all required properties.

Connect to HubSpot and select contact properties, custom fields, and association data from related deals, companies, and tickets. Use dynamic filtering to create flexible import criteria that adjust automatically.

hubspot contact updates in google sheets

Step 2. Configure scheduled refresh for inbound sync.

Set up automated imports every hour to capture all contact property changes from HubSpot. This detects every modification, not just “unknown to known” transitions that limit workflows.

schedule refreshes for hubspot contacts in google sheets

Step 3. Create export configuration for outbound sync to HubSpot.

Set up scheduled exports to push spreadsheet changes back to HubSpot using UPDATE, INSERT, UPSERT, or DELETE actions. Use conditional exports to only sync rows that meet specific criteria, like Status = “Updated”.

export configuration for hubspot to google sheets

Step 4. Schedule bidirectional sync timing for optimal data flow.

Configure inbound sync every hour and outbound sync daily to maintain current data flow. Adjust timing based on your business needs and data change frequency.

schedule hubspot contact data refreshes to and from google sheets

Step 5. Enable contact list management for advanced HubSpot operations.

Add or remove contacts from HubSpot lists directly from spreadsheet data. Manage contact list memberships and object associations without workflow dependencies.

Step 6. Set up monitoring alerts for bidirectional sync health.

Configure Slack and email alerts for both import and export activities. Monitor connection status and get error logging with specific details for troubleshooting sync issues.

trigger slack email alerts on hubspot contact data in google sheets

Start reliable two-way sync

Coefficient for HubSpot eliminates all workflow trigger limitations while providing automated bidirectional synchronization with complete transparency. You’ll get reliable data flow in both directions with comprehensive monitoring and error reporting.with bidirectional sync today.

Get Started with Coefficient for HubSpot

How to sync specific HubSpot contact fields to Google Sheets columns with live updates

Syncing specific HubSpot contact fields to designated Google Sheets columns with live updates requires precise field mapping and reliable refresh mechanisms that HubSpot’s native integration cannot consistently deliver.

You need superior field-specific synchronization with near real-time updates. Here’s how to get precise control over which fields sync to which columns with automated live updates.

Get precise field sync with live updates using Coefficient

CoefficientHubSpotprovides superior field-specific synchronization through advanced import and mapping capabilities. It offers granular field control for custom selection of exactly whichcontact properties to import, automatic column mapping with clear labeling, and data type preservation for proper formatting.

The system enables near real-time field synchronization through scheduled refresh systems, complete field monitoring, and automated field management that maintains data integrity as fields update.

How to make it work

Step 1. Select specific contact properties during import setup.

Connect to HubSpot through Coefficient sidebar and choose exactly which contact properties to import. Access both standard HubSpot fields and custom properties, plus association fields from related companies, deals, and tickets.

Step 2. Configure automatic column mapping with clear field identification.

Let Coefficient automatically map HubSpot property names to Google Sheets column headers for easy identification. The system preserves proper formatting for dates, numbers, and boolean values while maintaining clear column organization.

Step 3. Set up hourly refreshes for near real-time field synchronization.

Configure scheduled imports to run every hour for live field updates and enable manual refresh buttons for immediate synchronization when critical changes occur. Each refresh captures current state of all selected fields.

Step 4. Enable dynamic field filtering for targeted synchronization.

Use spreadsheet cell references to dynamically filter which contacts to sync and create multiple imports for different contact segments with different field requirements. Apply up to 25 filters across 5 groups for precise control.

Step 5. Configure automated field management and monitoring.

Use formula auto-fill to extend calculations automatically when new contacts are added and set up data validation to maintain integrity as fields update from HubSpot. Enable historical tracking with snapshots to preserve field value history.

Step 6. Set up field change alerts for live monitoring.

Configure Slack or email notifications for field value changes, new contacts added, or specific property modifications. Use variables in alerts for personalized field change notifications.

Start syncing specific fields with live updates

Get startedThis approach ensures specific HubSpot contact fields remain synchronized with designated spreadsheet columns through reliable, automated live updates. You’ll get precise field control with near real-time synchronization and comprehensive monitoring.with live field sync today.

How to track customer acquisition cost (CAC) on a Salesforce sales leaderboard dashboard

Customer acquisition cost reveals the true efficiency of your sales efforts, but Salesforce can’t easily integrate marketing spend data with sales performance or calculate rep-specific CAC across multiple attribution models.

This guide shows you how to track comprehensive CAC metrics that combine sales and marketing costs for accurate performance analysis.

Calculate comprehensive CAC metrics using Coefficient

CoefficientSalesforceSalesforceenables sophisticated customer acquisition cost tracking that overcomes major limitations inandnative reporting. You get multi-source data integration, complex attribution modeling, and automated cost allocation across territories and reps.

How to make it work

Step 1. Import and integrate cost data sources.

Pull Opportunity data for closed won deals and Campaign Member data for marketing attribution. Import external cost data including payroll, marketing spend, and territory budgets. Use custom formulas to calculate rep-specific CAC combining salary, commission, and attributed marketing costs.

Step 2. Set up attribution modeling and cost allocation.

Create first-touch attribution (CAC based on initial marketing touch), multi-touch attribution (distributed cost across campaign interactions), and sales-assisted attribution separating marketing vs. sales-sourced leads. Use automated distribution formulas for shared costs across reps based on performance.

Step 3. Calculate advanced CAC metrics and ratios.

Build blended CAC (overall cost per customer), paid CAC (cost from paid channels only), and organic CAC (cost from referral sources). Add LTV ratio calculations comparing customer lifetime value to acquisition cost with territory-specific adjustments.

Step 4. Create performance correlation and optimization analysis.

Calculate CAC efficiency scores comparing rep CAC to company averages. Track quarter-over-quarter CAC improvement trends and identify lowest CAC sources by rep. Set up predictive CAC modeling based on current pipeline and spend rates with automated monthly updates.

Optimize your acquisition investment strategy

Start trackingComprehensive CAC tracking enables data-driven decisions about territory investment, channel optimization, and sales process improvements that maximize return on acquisition spending.CAC metrics to optimize your customer acquisition strategy.

How to track deal progression stages on a Salesforce sales leaderboard dashboard

Deal progression tracking shows how efficiently reps advance opportunities, but Salesforce native reporting has significant limitations in tracking stage velocity, regression analysis, and historical progression patterns.

Here’s how to set up comprehensive deal progression tracking that identifies bottlenecks and coaching opportunities.

Automate deal progression analysis using Coefficient

CoefficientSalesforceSalesforceexcels at tracking deal progression stages through advancedandintegration with real-time data capabilities. You get automated stage velocity calculations, progression scoring, and stalled deal identification that native reports can’t provide.

How to make it work

Step 1. Import progression data sources.

Pull current Opportunity records with Stage and LastModifiedDate fields. Import OpportunityFieldHistory for complete stage change tracking. Use custom SOQL queries to capture stage duration calculations and related Account data for segmentation analysis.

Step 2. Calculate stage velocity metrics.

Create formulas for stage duration using =DATEDIF(stage_entry_date, stage_exit_date, “D”) and auto-fill down for each stage transition. Calculate average progression velocity, stage conversion rates, and identify deals exceeding average duration thresholds for stalled deal alerts.

Step 3. Build progression scoring and analysis.

Develop stage progression scores using weighted averages of stage advancement speed. Calculate deal acceleration rates showing percentage of deals moving faster than historical averages. Create pipeline quality scores combining stage velocity with conversion probability.

Step 4. Set up automated tracking and alerts.

Use the append new data functionality to maintain complete stage progression history while capturing real-time updates. Schedule hourly refresh to capture same-day stage changes. Add dynamic filtering for instant analysis by territory, product, deal size, or time period.

Optimize your sales process efficiency

Start trackingComprehensive deal progression tracking provides sales managers with actionable insights into each rep’s ability to advance opportunities efficiently through the sales process.deal progression to identify process bottlenecks and coaching opportunities.

How to track email opens and clicks in Salesforce without HTML Email Status report

Tracking email opens and clicks without the HTML Email Status report type requires alternative data sources since Salesforce’s native tracking capabilities are limited when specific report types are unavailable.

Here’s how to build comprehensive email engagement tracking that exceeds what the HTML Email Status report type offers by combining multiple data sources for complete visibility into email performance.

Build comprehensive email engagement tracking using external platform integration with Coefficient

CoefficientSalesforceSalesforceprovides superior email tracking by connecting email marketing platforms directly withcontact data. You can import open and click tracking data from platforms like Mailchimp, Gmail, or Outlook, then combine it with Salesforce contact and lead information for comprehensive engagement reporting that provides more detailed insights than the HTML Email Status report type ever could in.

How to make it work

Step 1. Connect external email platforms for engagement data.

Use Coefficient to connect email marketing platforms like Mailchimp, Constant Contact, Gmail, or Outlook directly. Import open rates, click-through rates, bounce rates, and engagement timing data that provides detailed email performance metrics.

Step 2. Enhance Campaign Member data with external metrics.

Import Campaign Member data from Salesforce and combine it with external email engagement metrics. This creates detailed reports showing open rates, click-through rates, and conversion metrics segmented by contact type, industry, or campaign.

Step 3. Supplement Task activity tracking with engagement data.

Use Coefficient’s advanced filtering on Task objects to identify email activities, then supplement with external tracking data. Filter Tasks where Type equals “Email” and join with engagement metrics for complete email performance visibility.

Step 4. Create unified email performance dashboards.

Combine Salesforce contact engagement history with email platform analytics to create dashboards showing email performance across all touchpoints. Track which contacts are most engaged and which email types drive the best results.

Step 5. Set up automated email analytics monitoring.

Schedule refreshes that automatically update email engagement data from external sources. Configure alerts for engagement thresholds, low open rates, or high-performing campaigns to stay on top of email effectiveness.

Get real-time email engagement insights across all platforms

Start buildingThis multi-platform approach provides more comprehensive email tracking than the HTML Email Status report type while offering real-time automation and cross-platform insights.your unified email engagement dashboard today.