Average Deal Size: How to Measure + Optimize Forecasting (With Template)

Average deal size is a crucial metric for sales operations. It guides strategic decisions, provides insights into sales efficiency, and helps forecast revenue.

Coefficient’s spreadsheet dashboard templates give you real-time access to this critical data, making it easy to track, analyze, and act on.

In this blog, we’ll explore what average deal size is, how to calculate it, and how Coefficient can help you leverage it to supercharge your sales strategy.

Understanding Average Deal Size

Average deal size represents the average revenue your company expects from each closed deal. It’s a key indicator of sales efficiency, product market fit, and customer value.

Here are the factors influencing average deal size:

  1. Product/Service Value: Higher-value offerings lead to larger deals, as customers invest more for solutions that provide substantial benefits or solve critical pain points.
  2. Target Market and Customer Segments: Enterprise-level clients or customers in certain industries may have larger budgets and more complex needs, resulting in higher-value deals compared to small businesses or consumers.
  3. Sales Strategy and Pricing: Effective sales techniques (bundling, upselling, cross-selling) and competitive pricing can increase deal value and attract more customers, influencing average deal size.

How to Calculate Average Deal Size

To calculate average deal size, use this simple formula:

Average Deal Size = Total Revenue from Closed Deals / Number of Closed Deals

  • Total Revenue from Closed Deals: This is the sum of all revenue generated from deals that were successfully closed within a specific time period, such as a month, quarter, or year.
  • Number of Closed Deals: This represents the total number of deals that were successfully closed within the same time period used for calculating the total revenue.

Using Coefficient to Calculate Average Deal Size

Coefficient’s Sales Performance Dashboard for Google Sheets makes it easy to track and understand your average deal size.

Here’s how you can use it:

Step 1: Download the (Free) Average Deal Size Dashboard

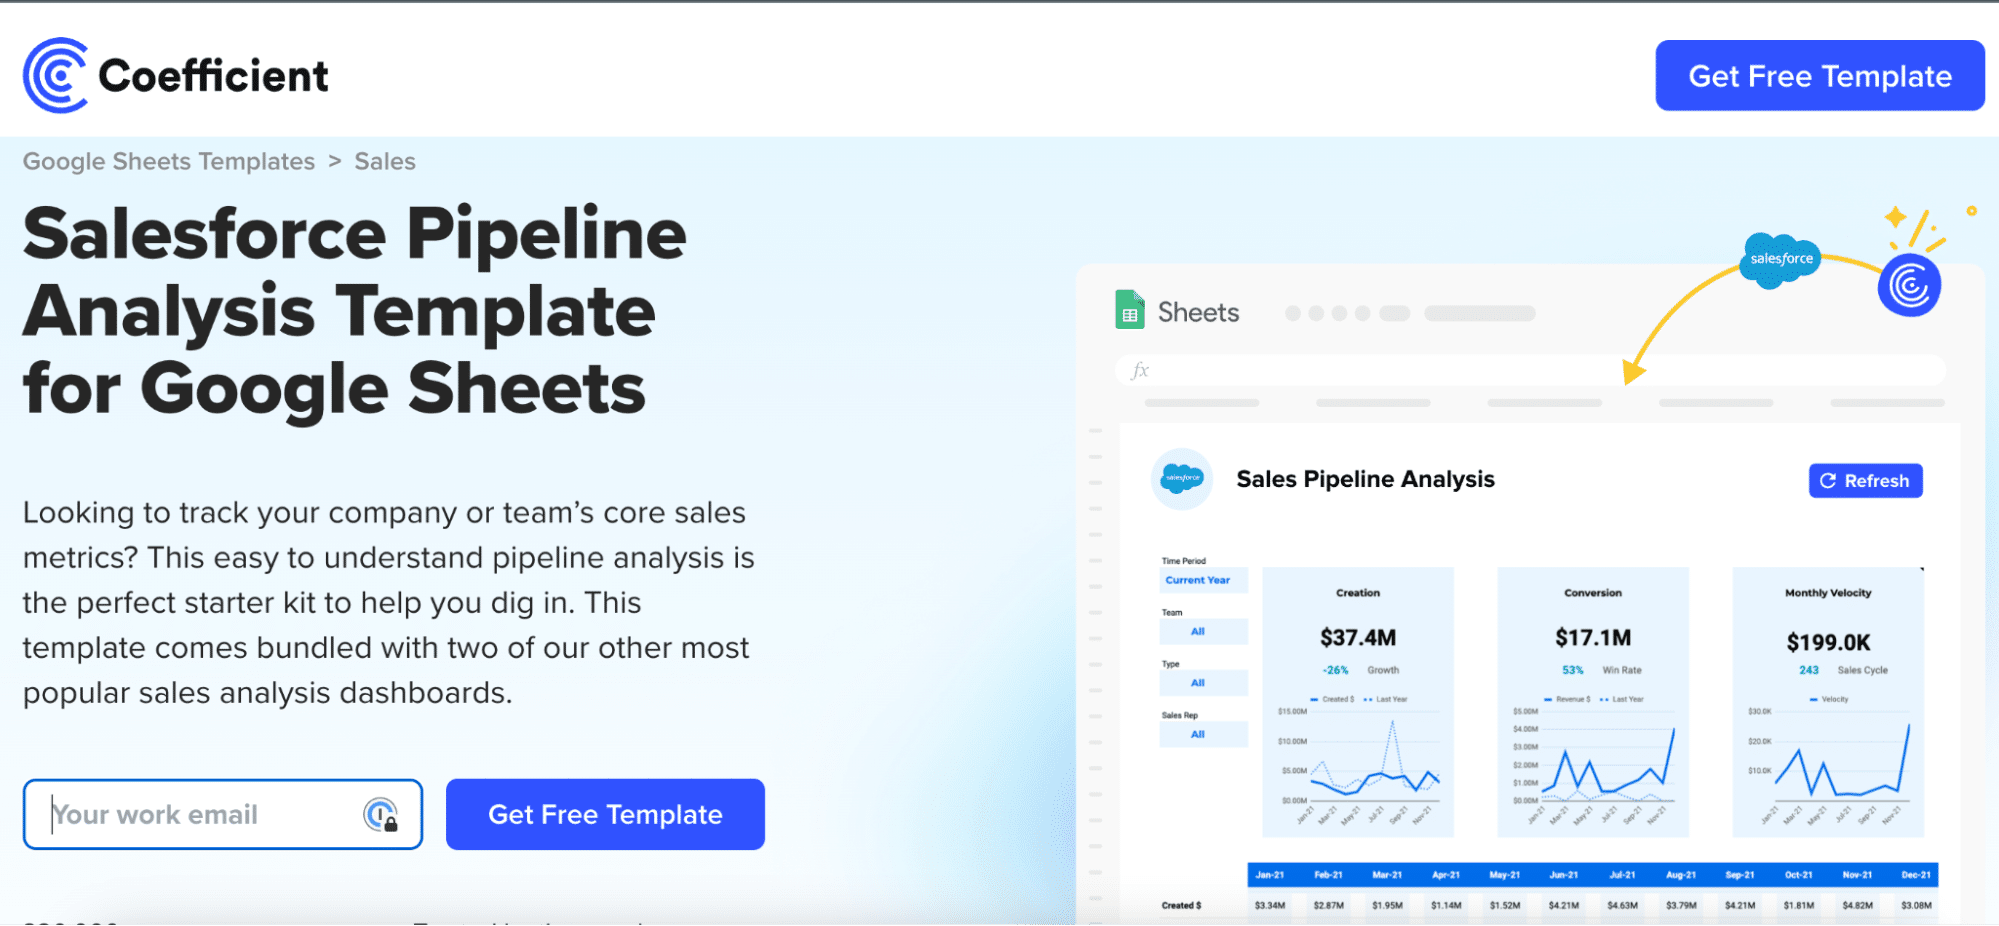
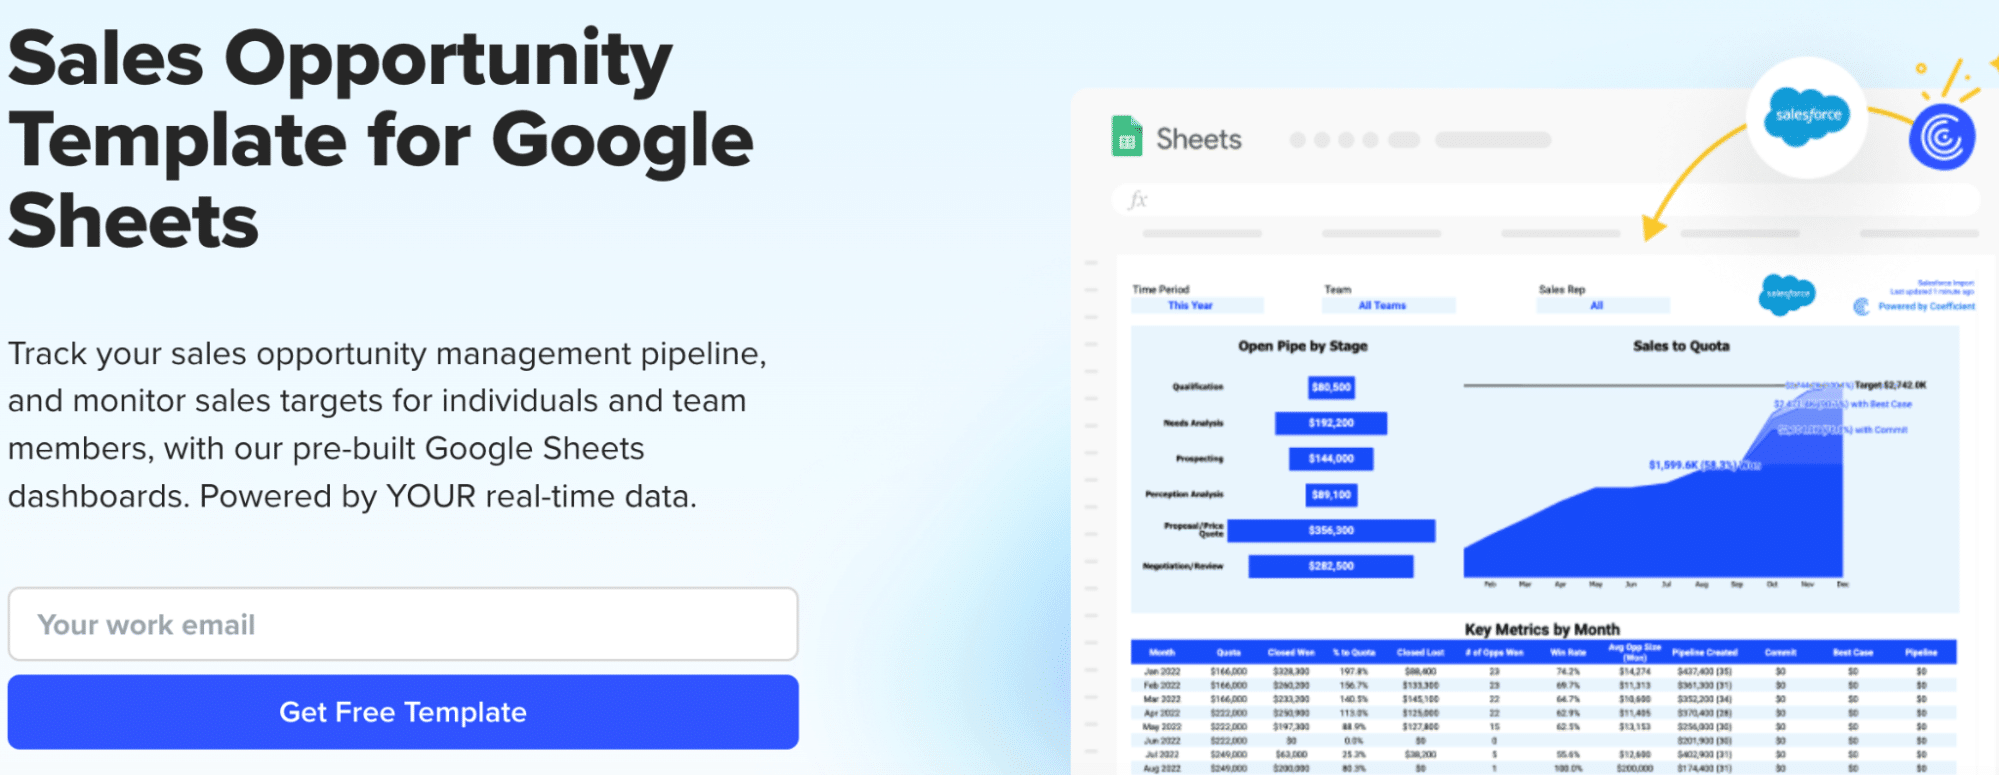
To start, head to Coefficient.io. Enter your work email in the box and click ‘Get Free Template.’ 
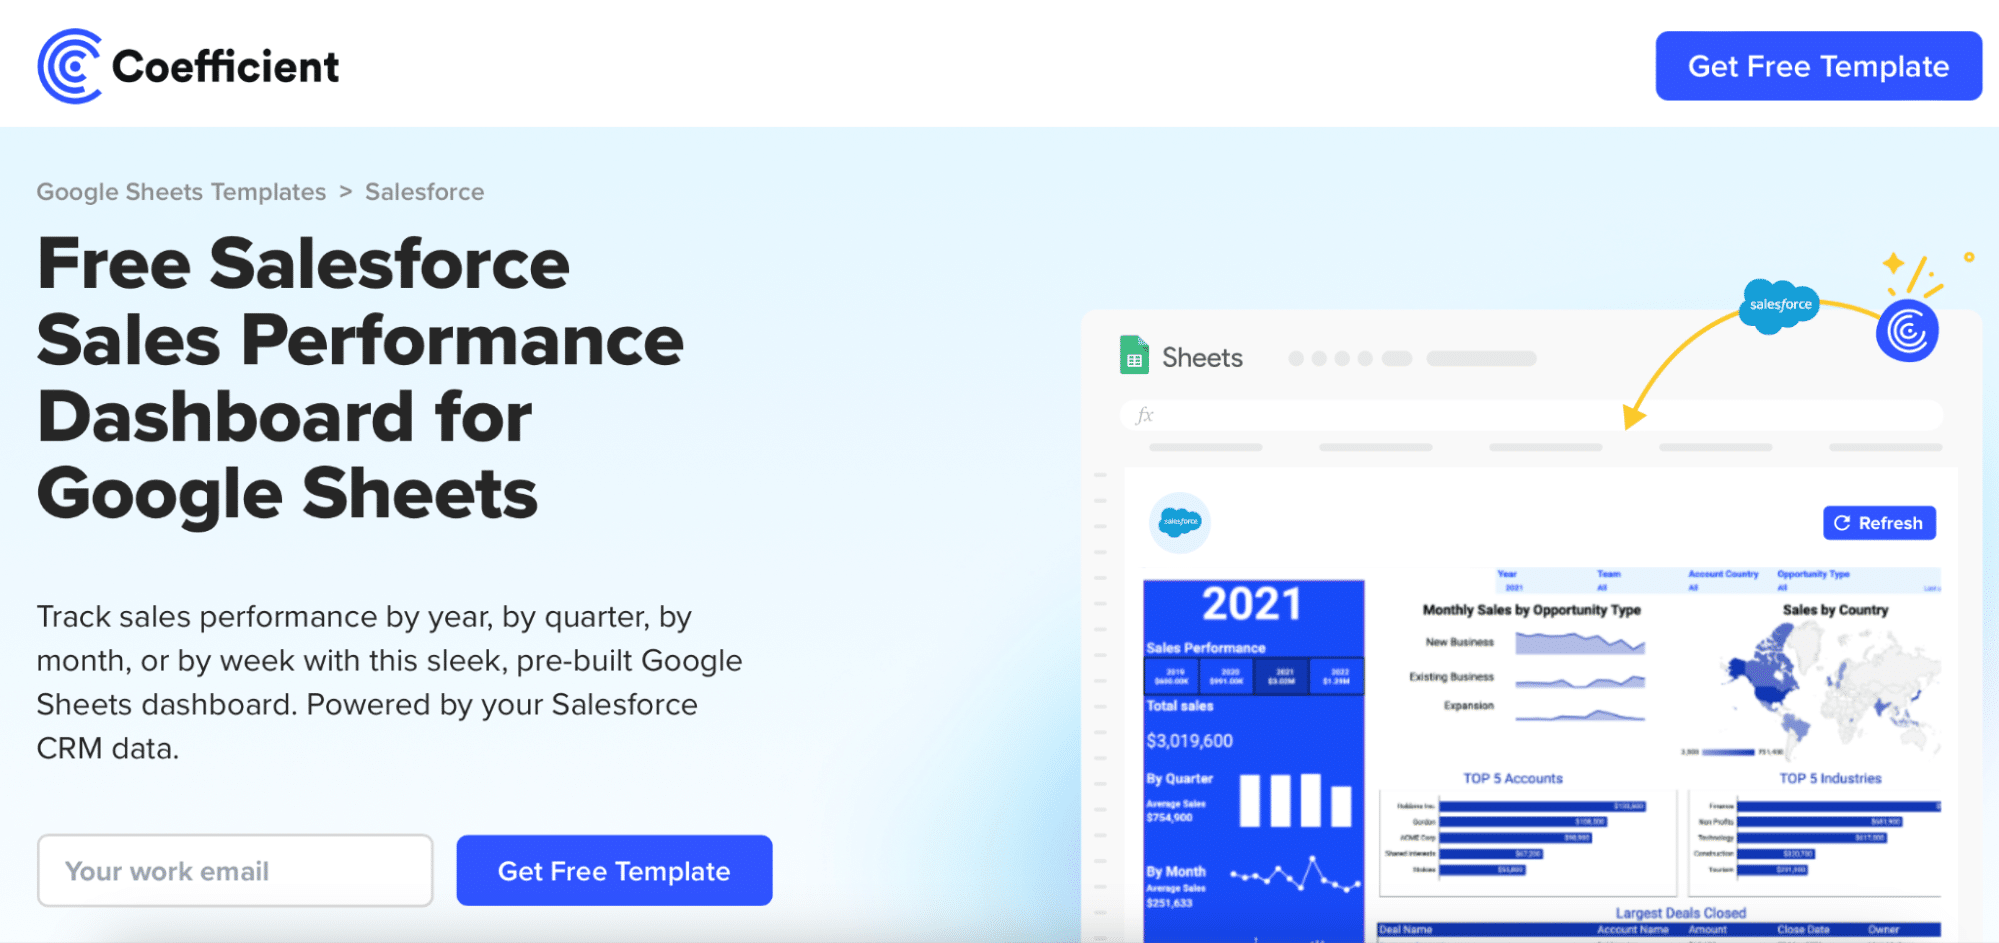
Entering a work email at Coefficient.io for accessing a free template.

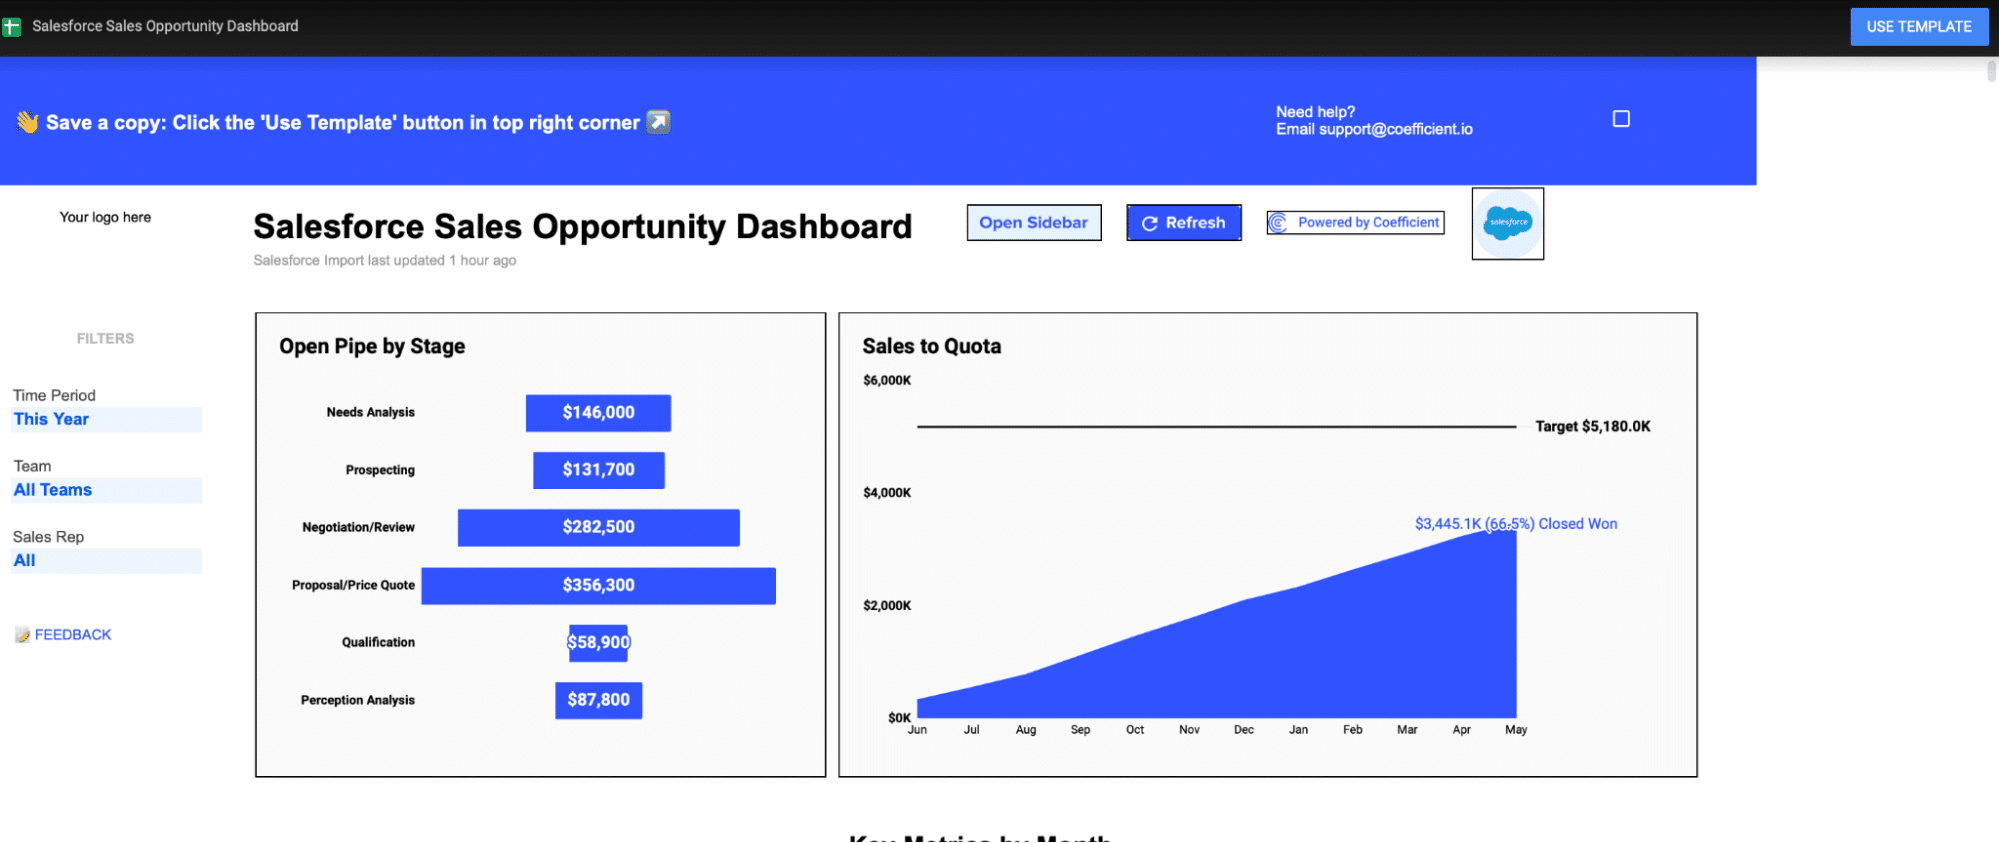
You can save the template to your Google account by clicking the ‘Use Template’ button at the top right corner of your screen.
Saving a Coefficient template by clicking 'Use Template' in Google Sheets.

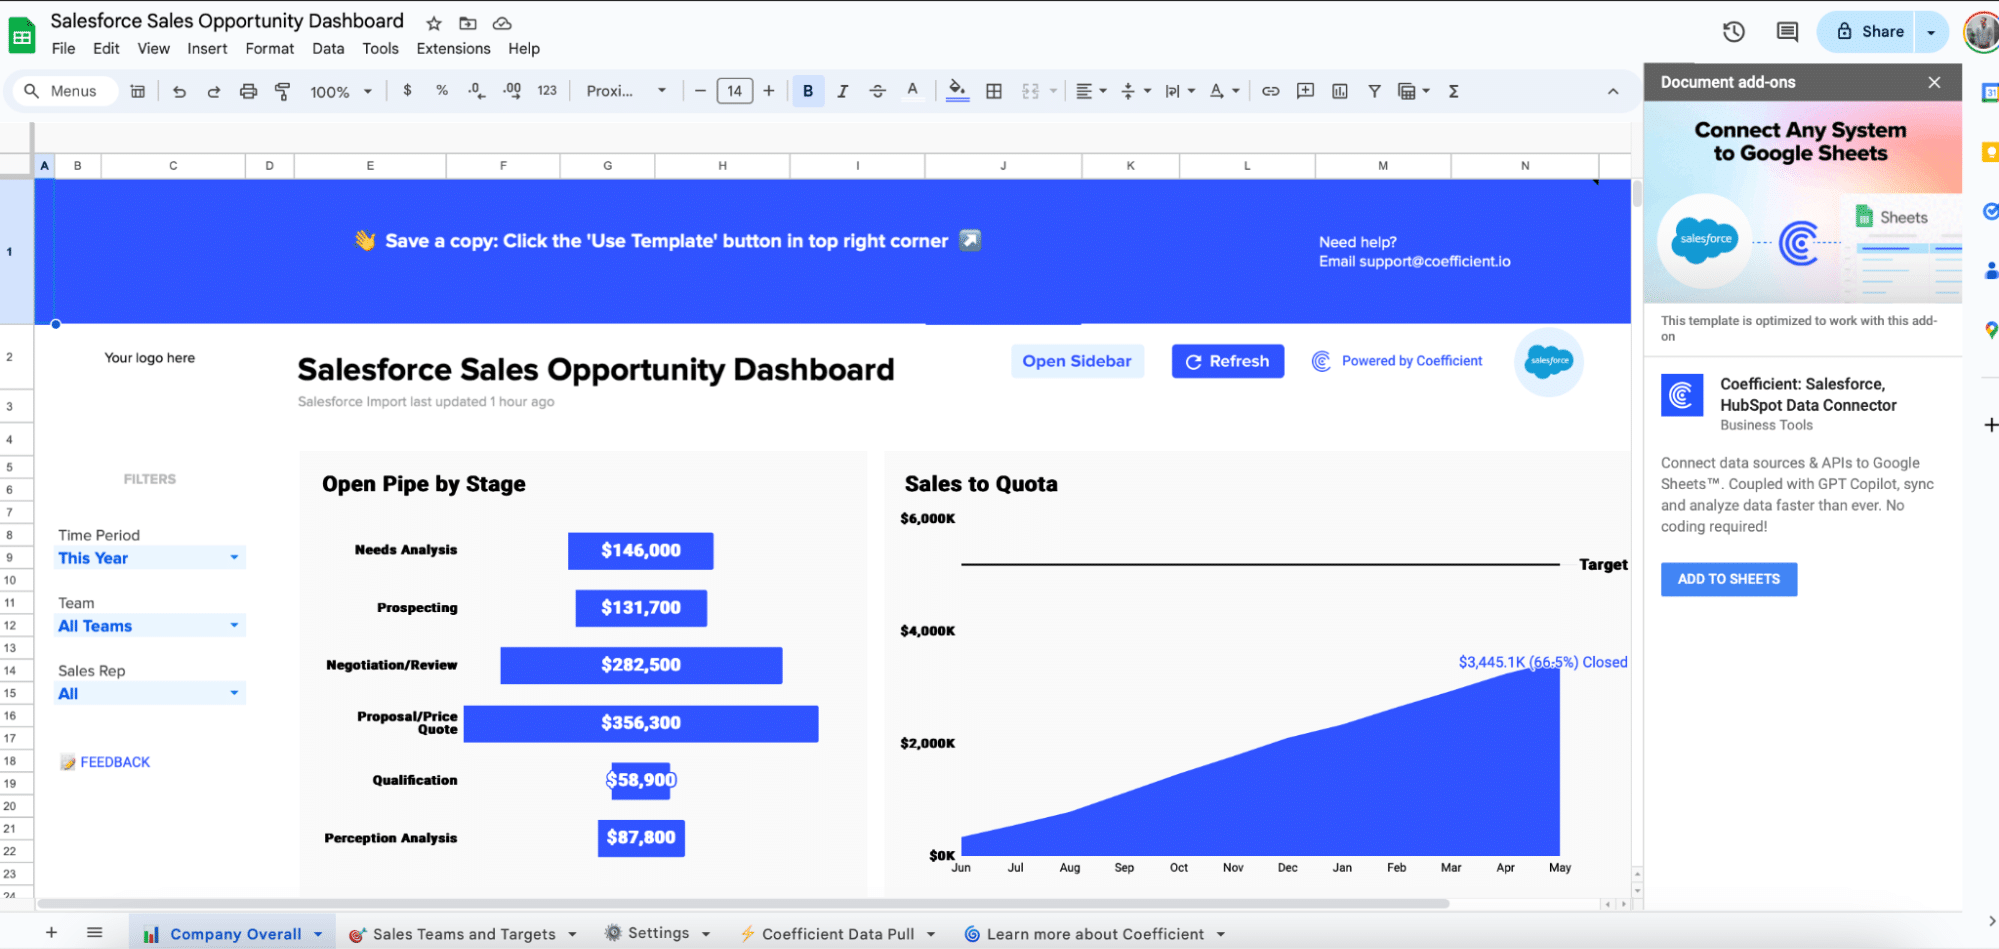
Coefficient will open in a new spreadsheet.
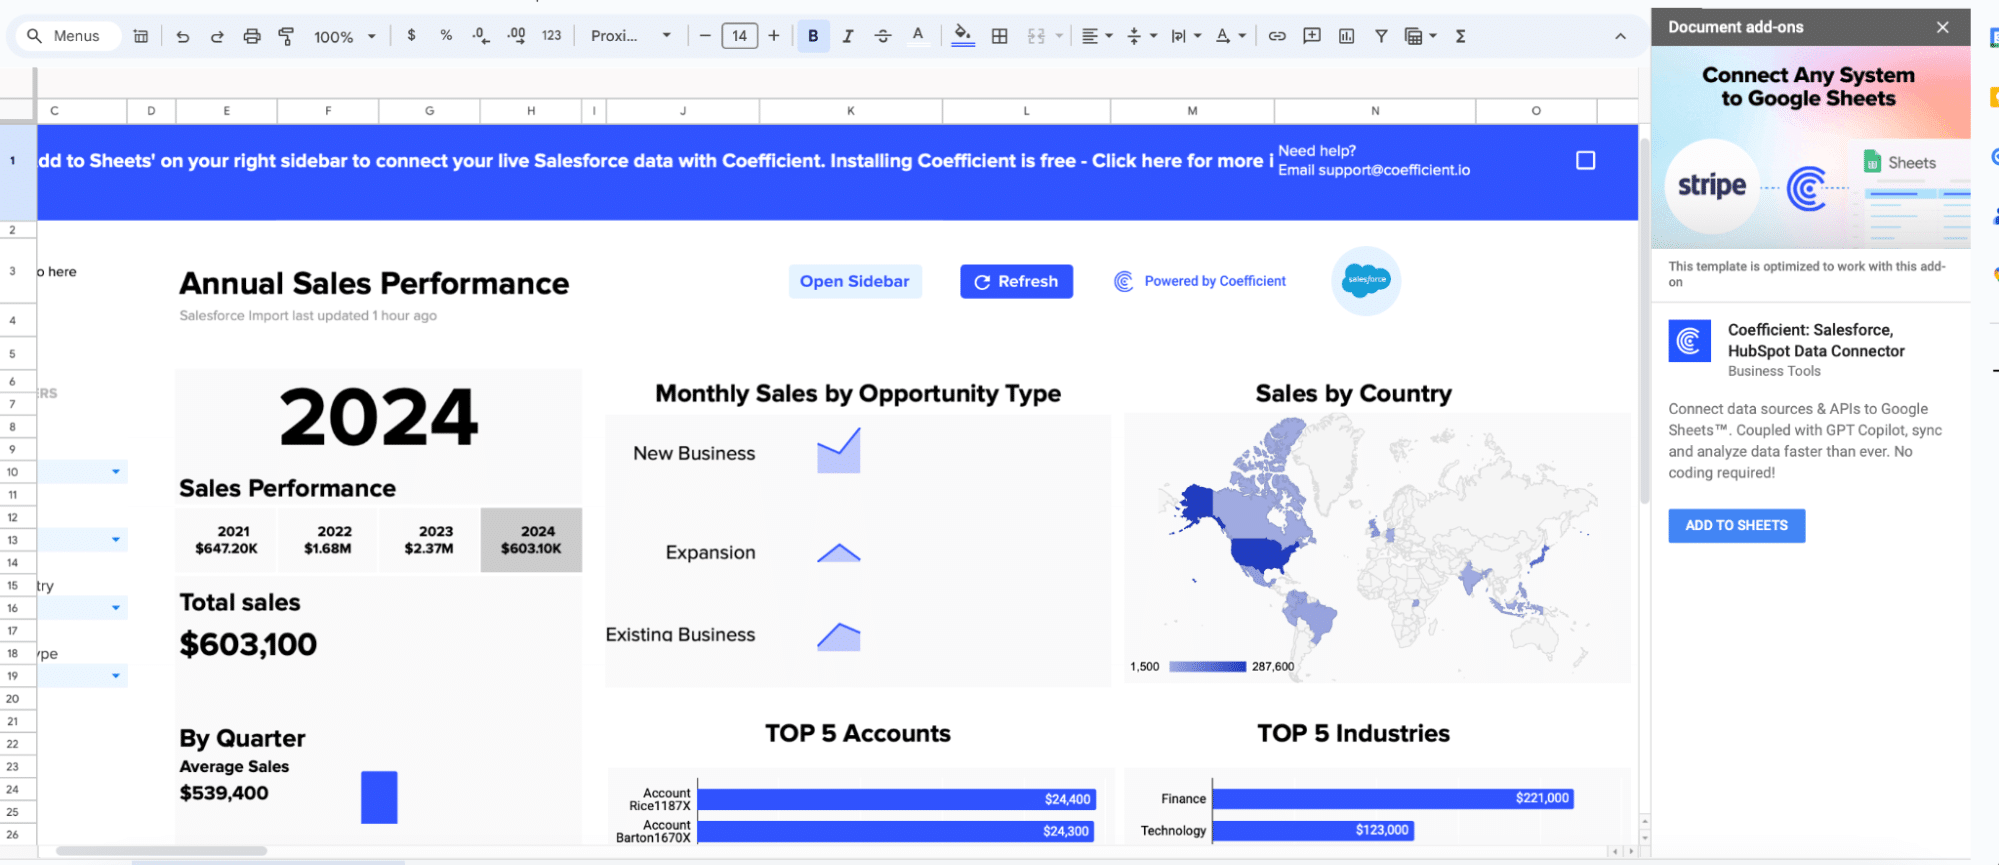
Viewing a newly opened Coefficient template in a Google Sheets spreadsheet.

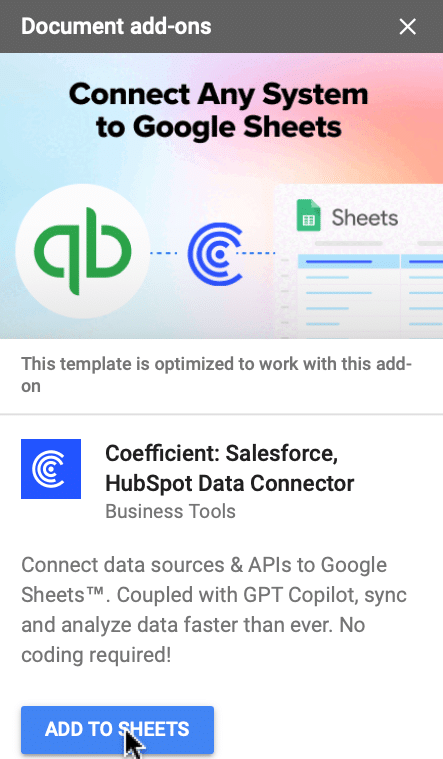
If this is your first time using Coefficient, you’ll need to add it as an add-on to Google Sheets.        

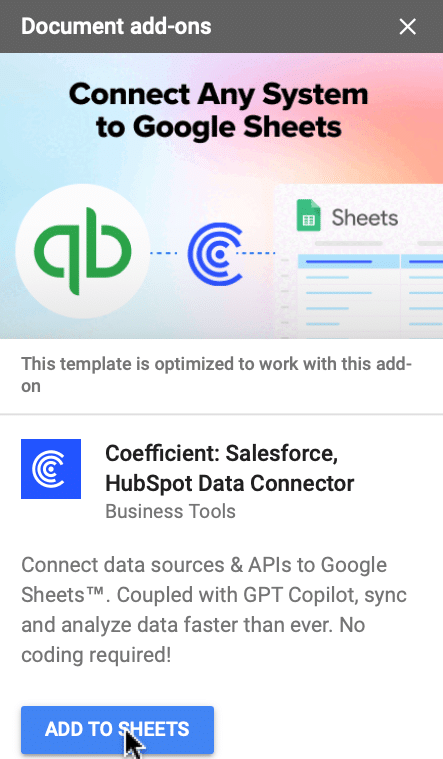
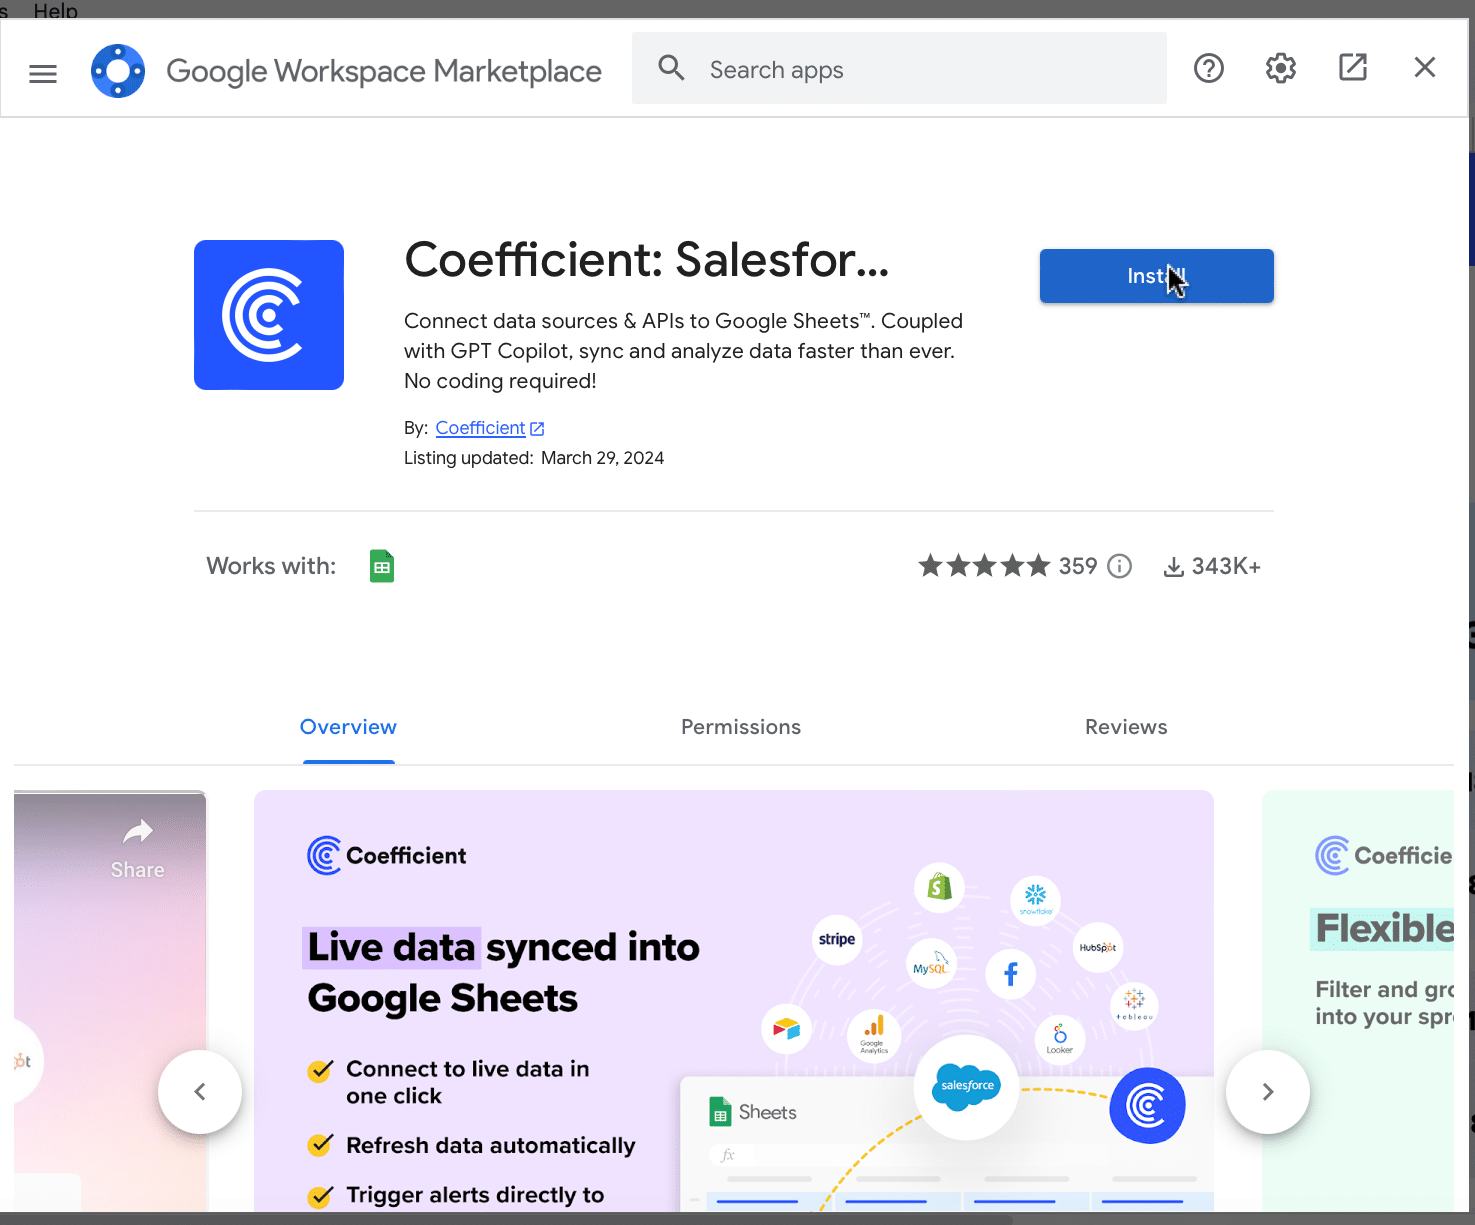
Click â€˜Add to Sheets’ to continue.

Adding Coefficient as an add-on in Google Sheets for enhanced functionality.

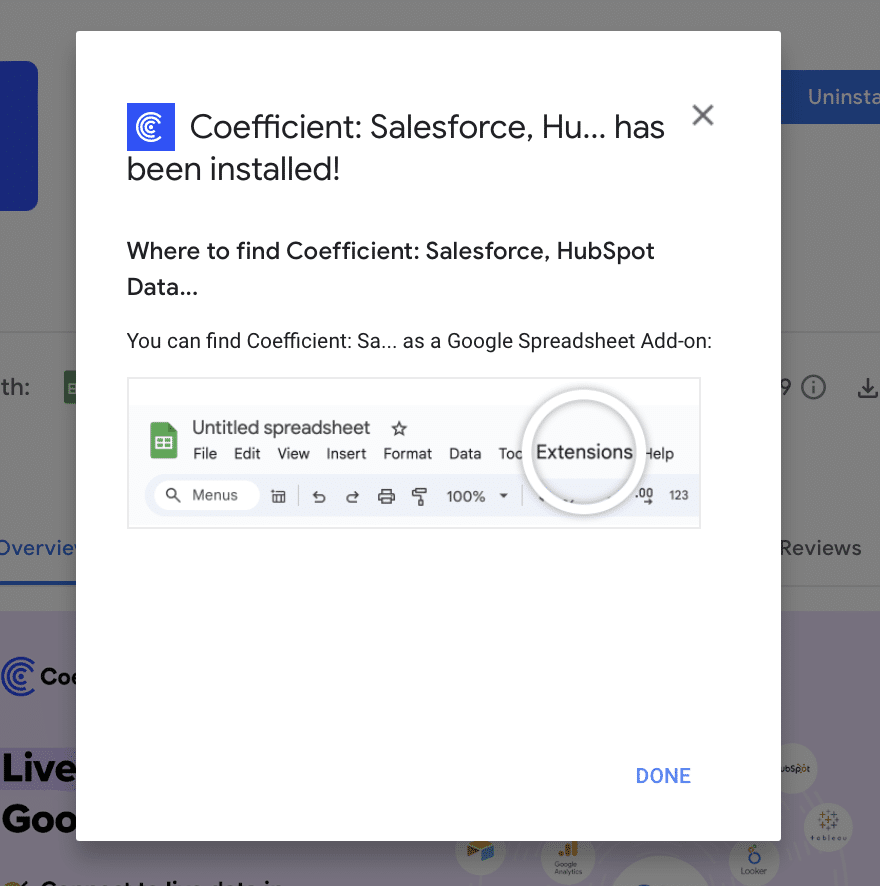
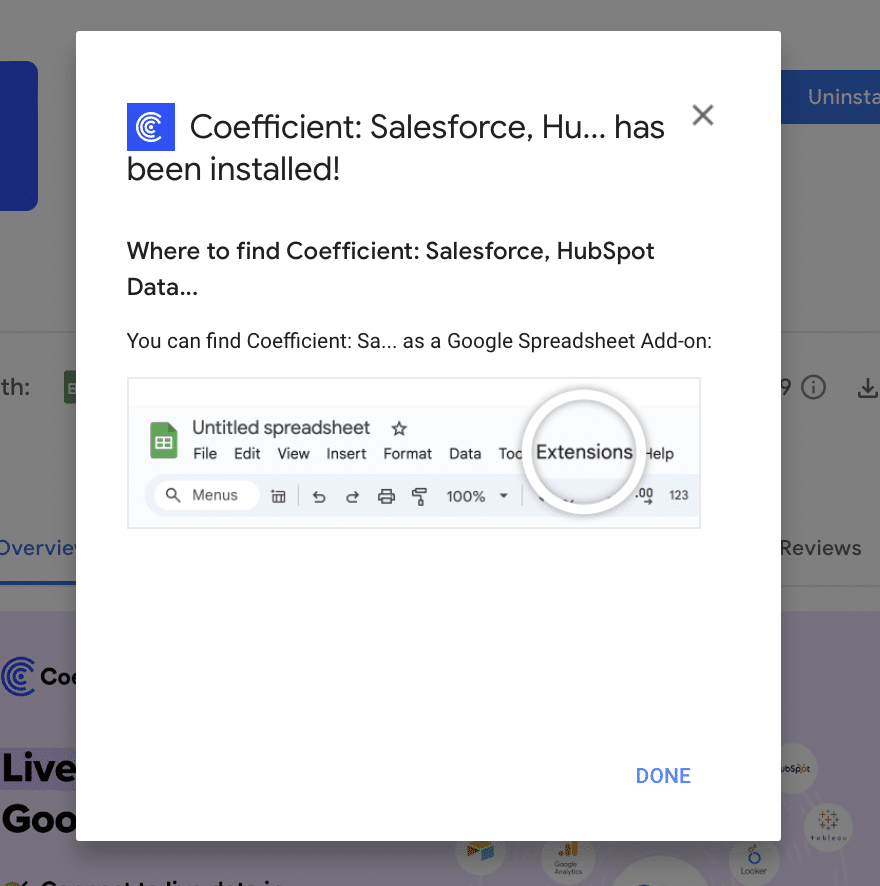
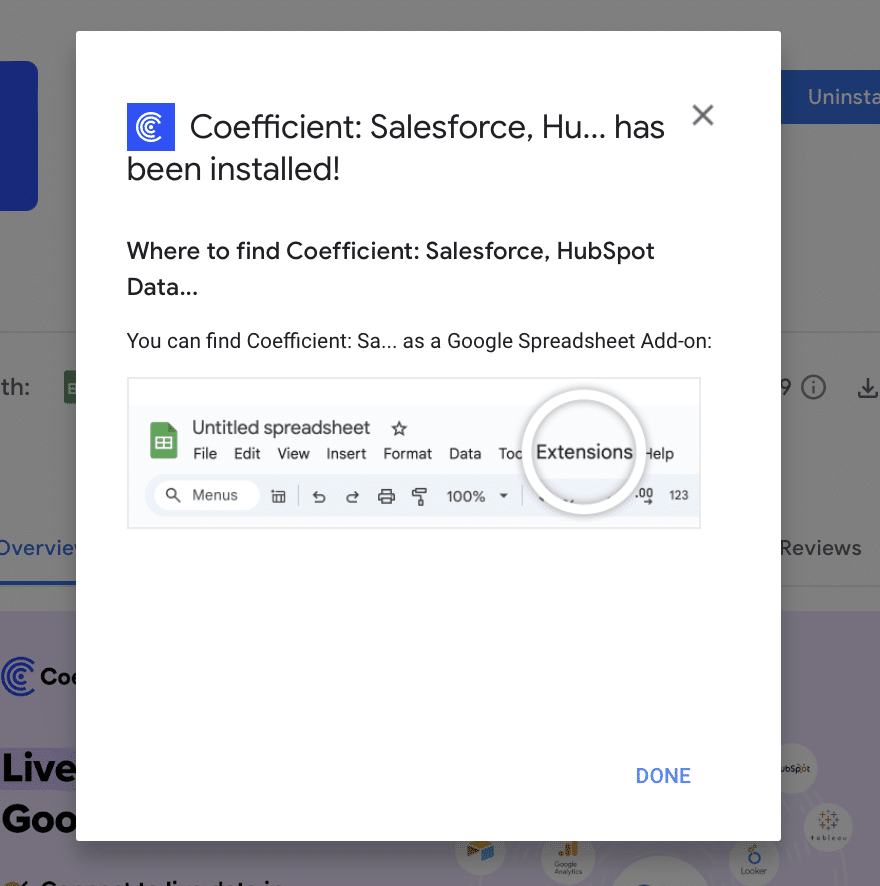
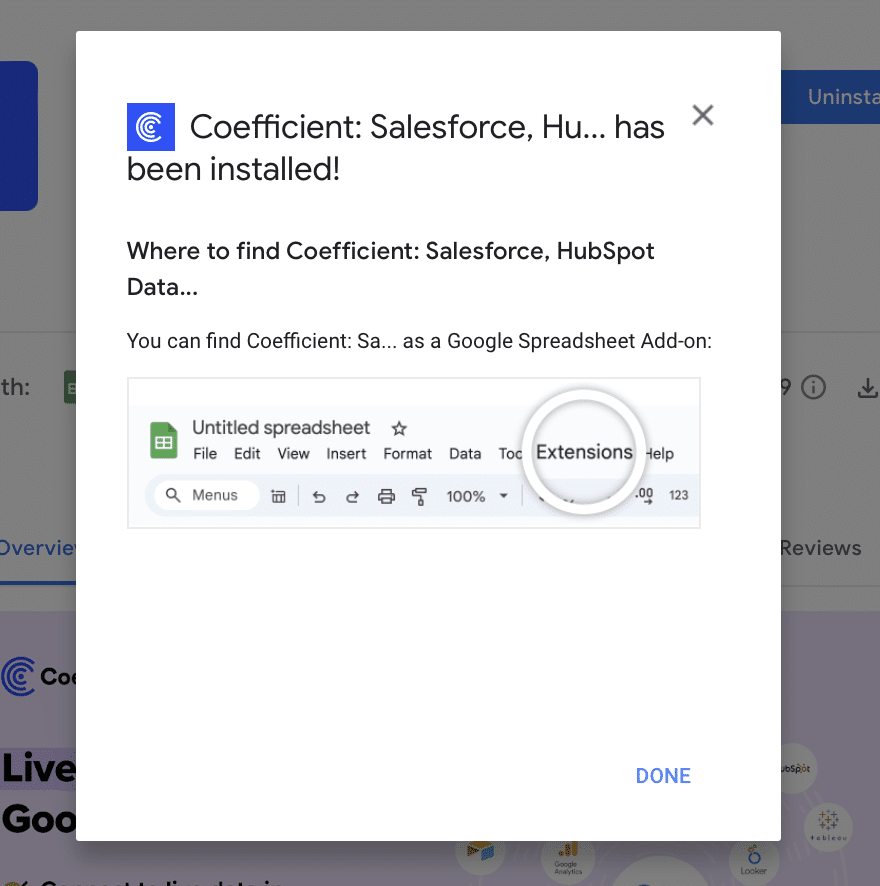
Hit the â€˜Install’ button and follow the prompts to complete the installation.
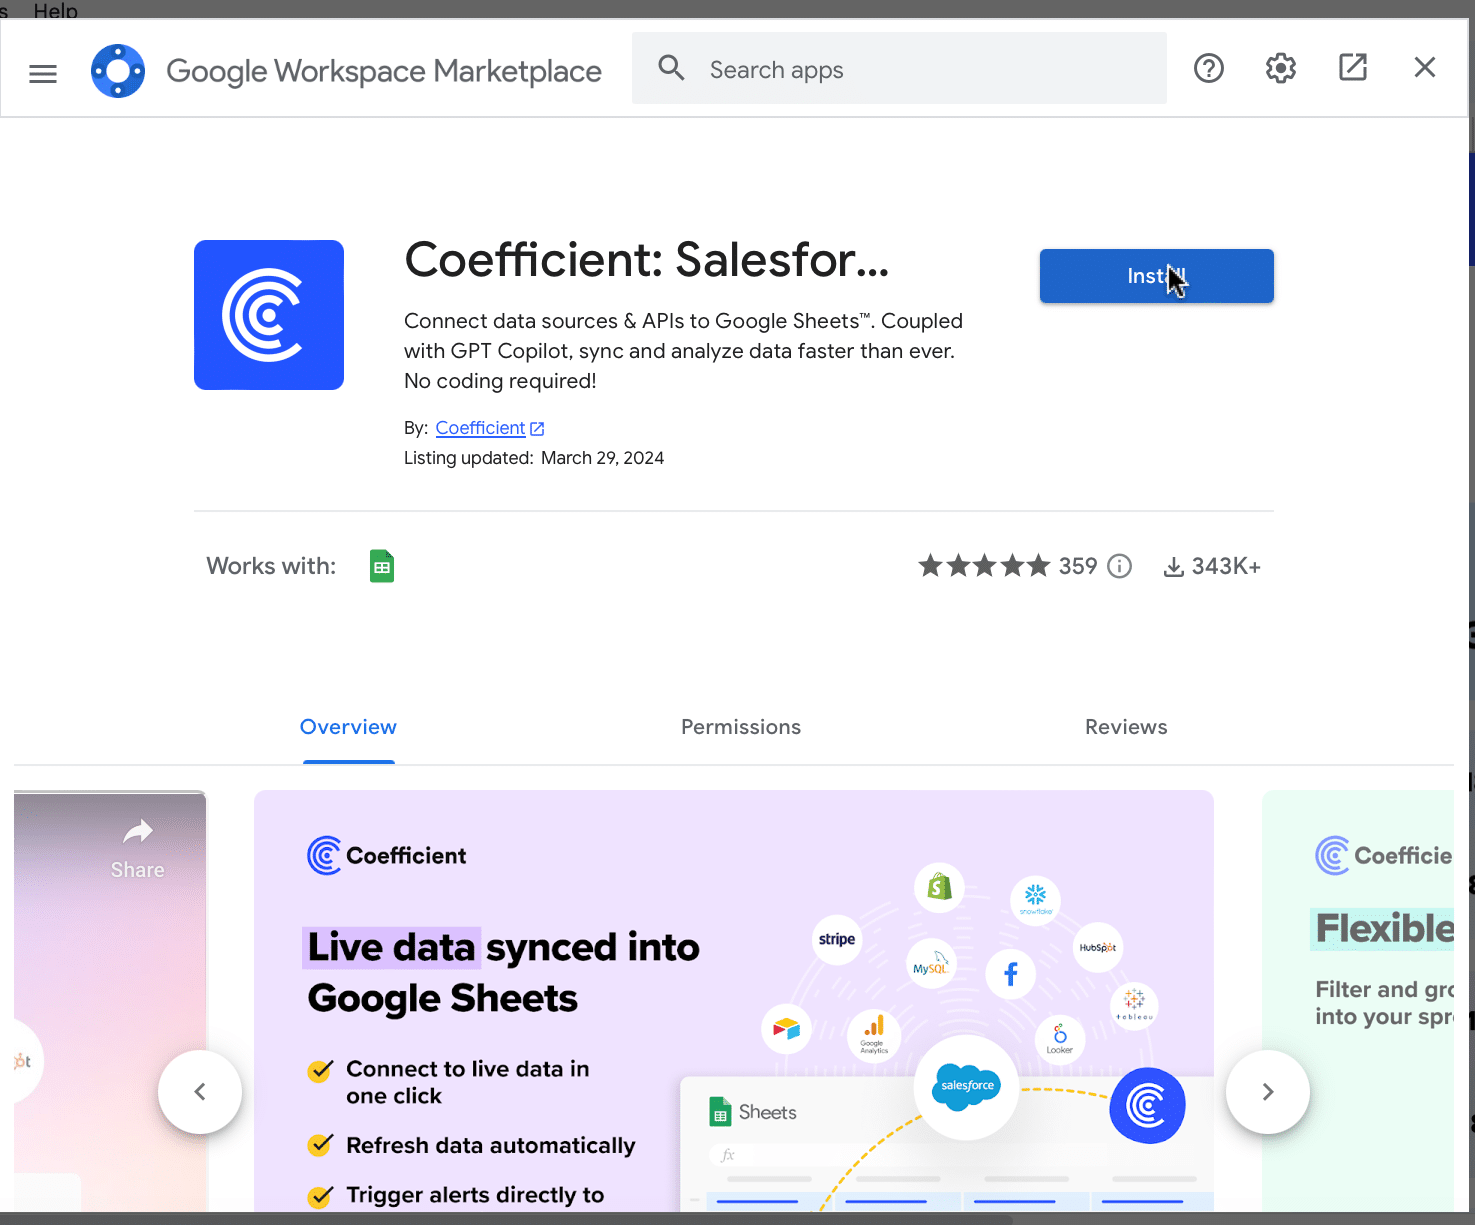
Completing the installation of Coefficient as a Google Sheets add-on.

Step 2: Connect Coefficient to Salesforce

After installation is complete, click â€˜Done’ to return to your spreadsheet.

Clicking 'Done' to return to the spreadsheet after Coefficient installation.

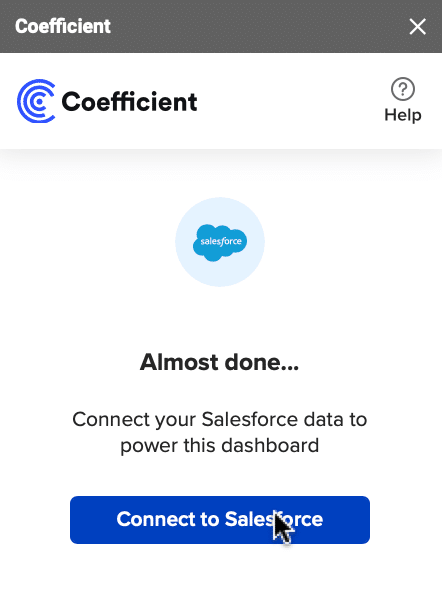
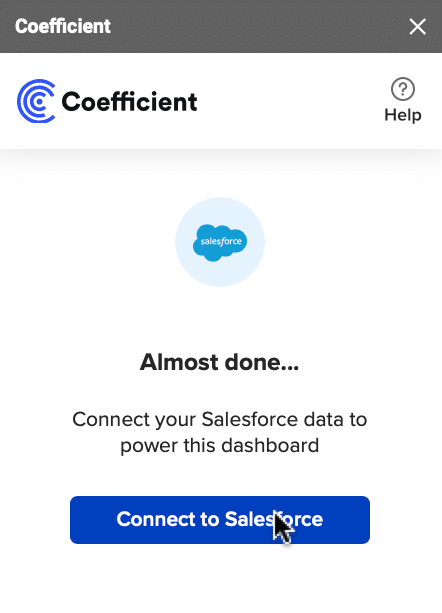
Click ‘Connect to Salesforce’ from the Coefficient menu on the right-hand side of your spreadsheet.
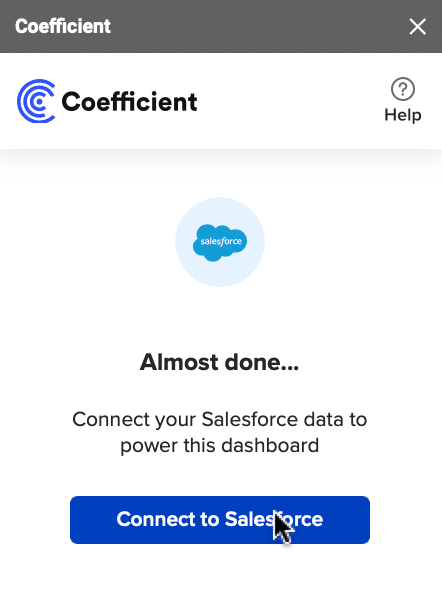
Initiating Salesforce connection from the Coefficient menu in Google Sheets.

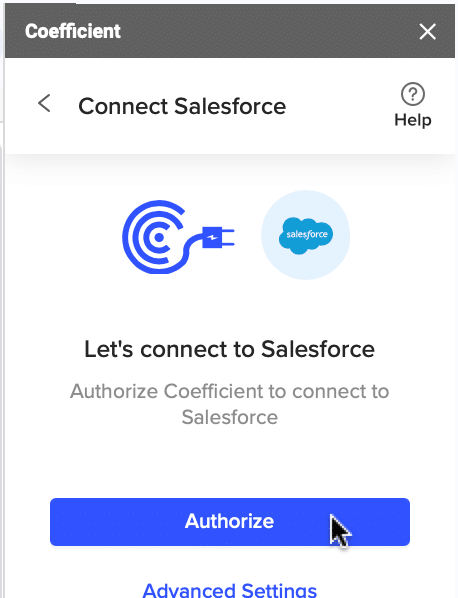
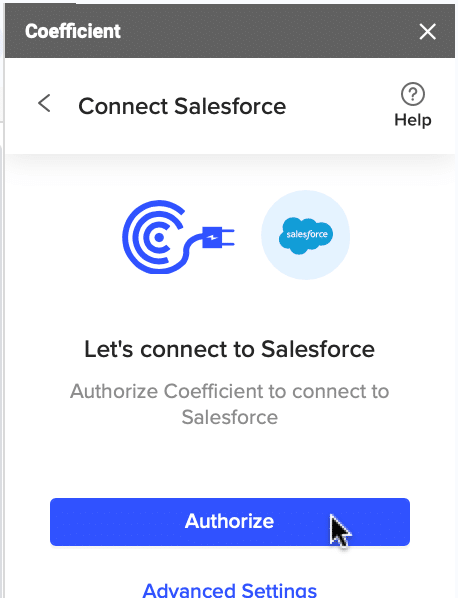
Follow the prompts to authorize Coefficient to your Salesforce account.
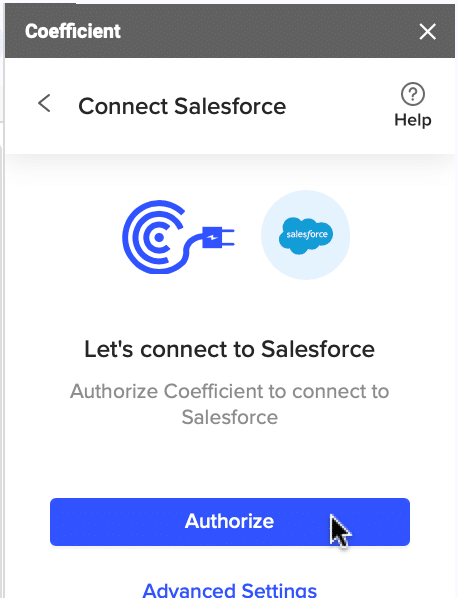
Completing authorization steps for Salesforce account connection in Coefficient.

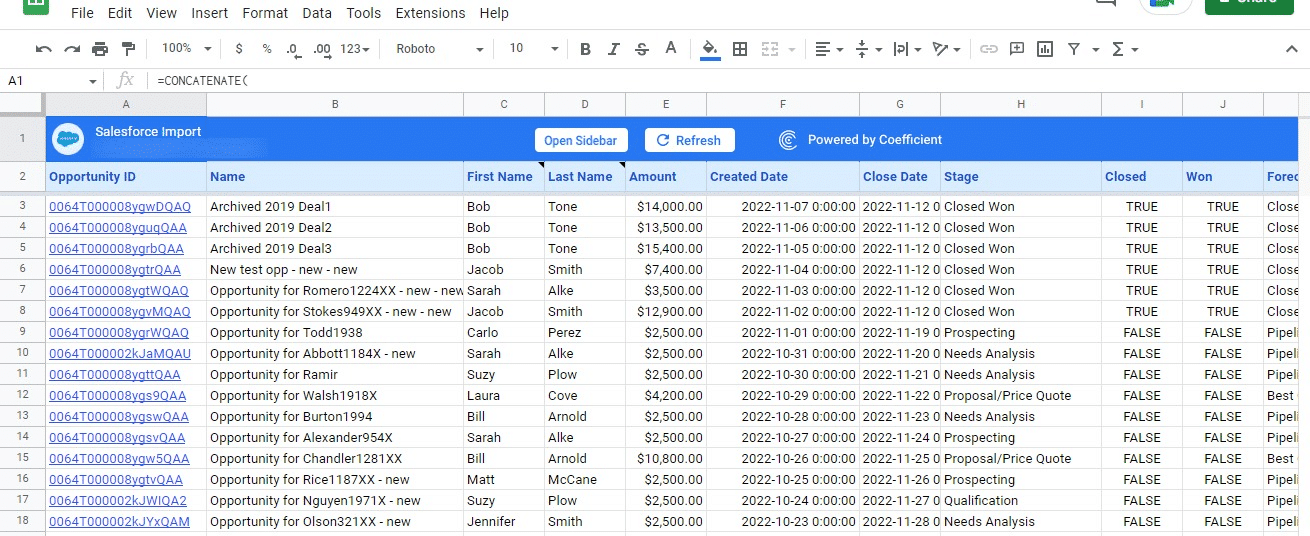
If successful, you’ll see the following notification at the top of your spreadsheet.

Observing Salesforce connection success notification in the Google Sheets with Coefficient.

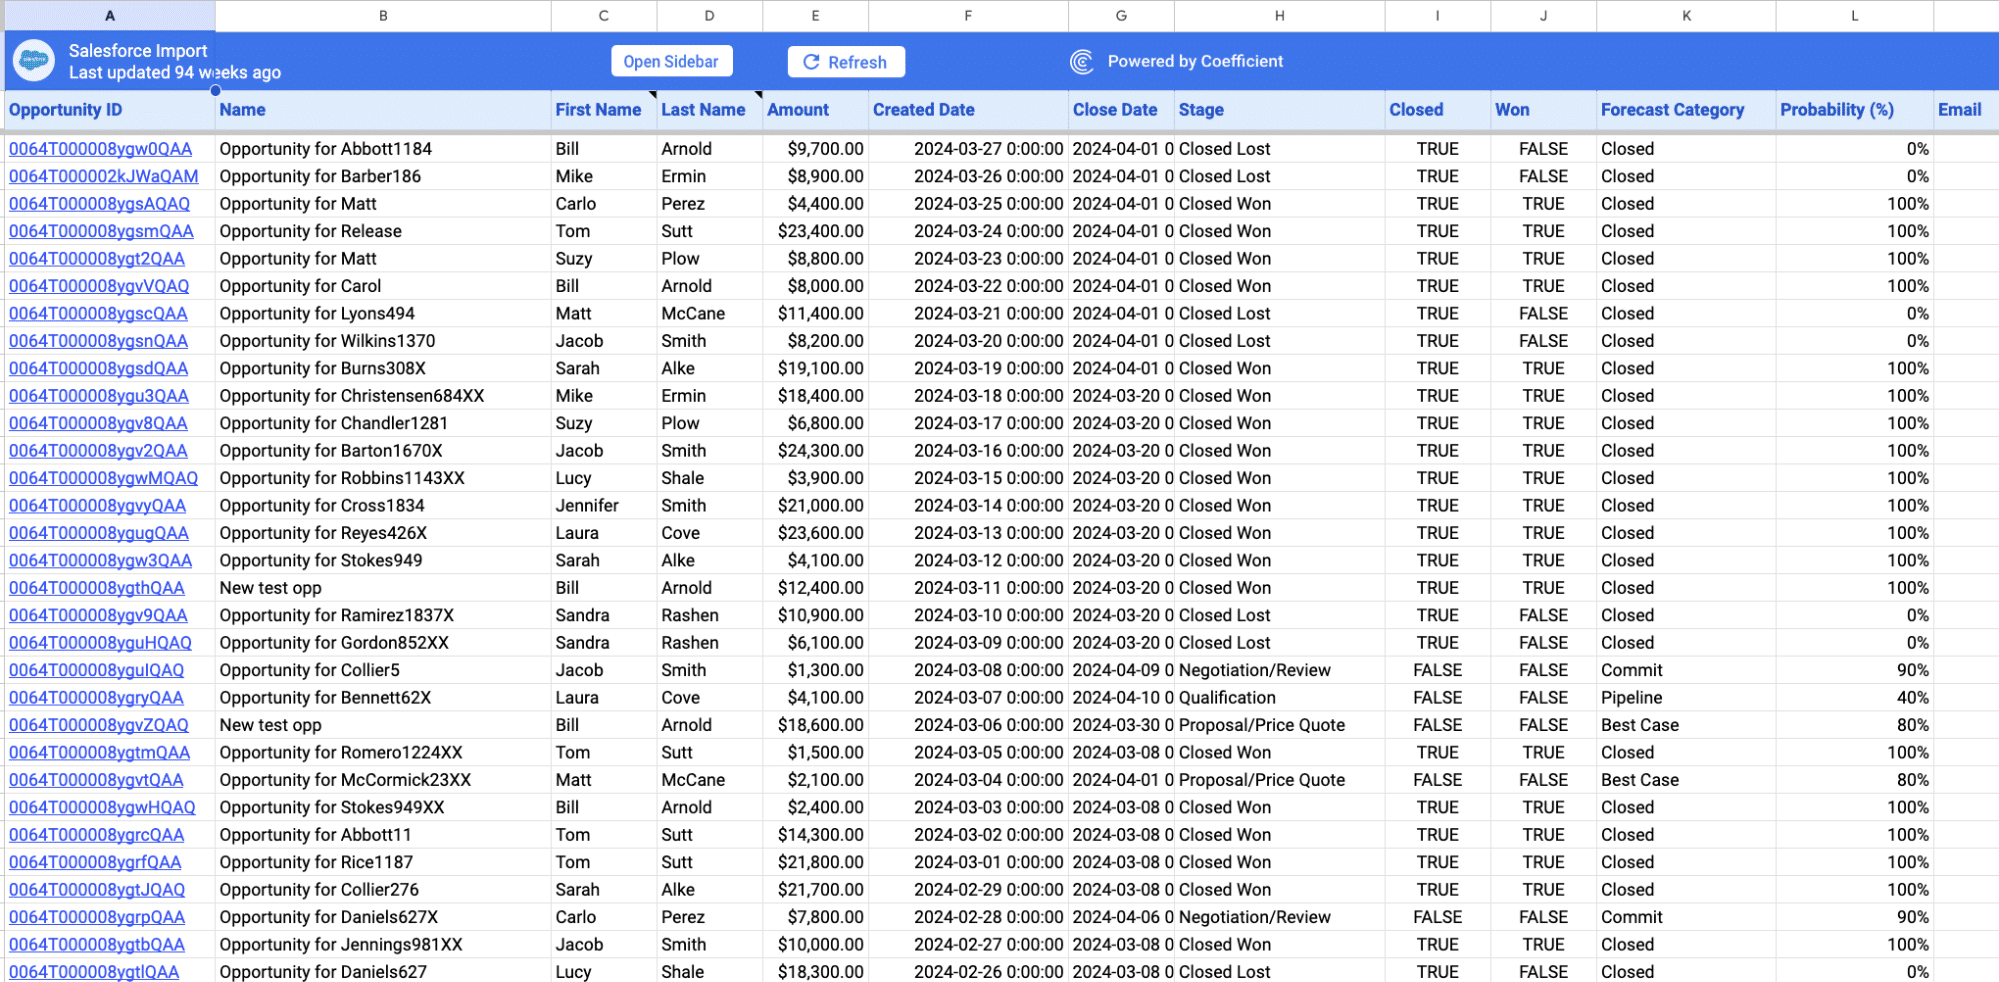
To update your data, navigate to the ‘Salesforce Import’ tab of your spreadsheet and click ‘Refresh.’

Using 'Refresh' feature in 'Salesforce Import' tab to update data in Coefficient.

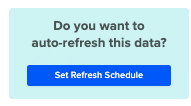
You can also auto-refresh your data by clicking ‘Set Refresh Schedule.’

Configuring a schedule for automatic data updates from Salesforce in Coefficient.

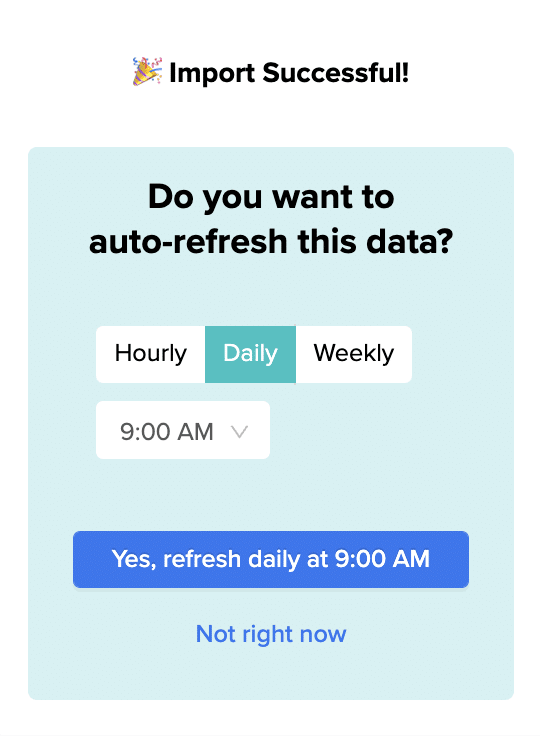
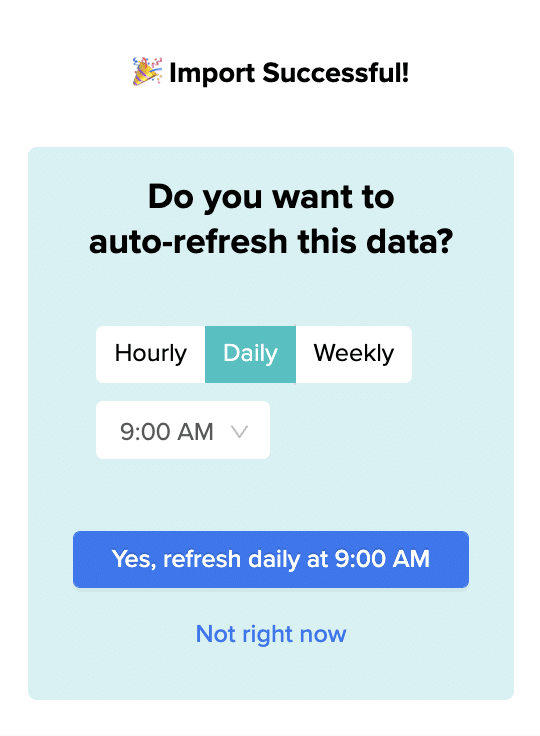
Set up an hourly, daily, or weekly auto-refresh schedule, and Coefficient will automatically update your data based on that time interval.

Setting refresh schedule

Set up an hourly, daily, or weekly auto-refresh schedule, and Coefficient will automatically update your data based on that time interval.

Step 3. Customize Your Dashboard

Tailor the template to your organization’s unique needs by navigating to the ‘Settings’ tab.

Tailoring the Coefficient template to organizational needs via the 'Settings' tab.

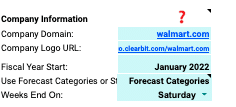
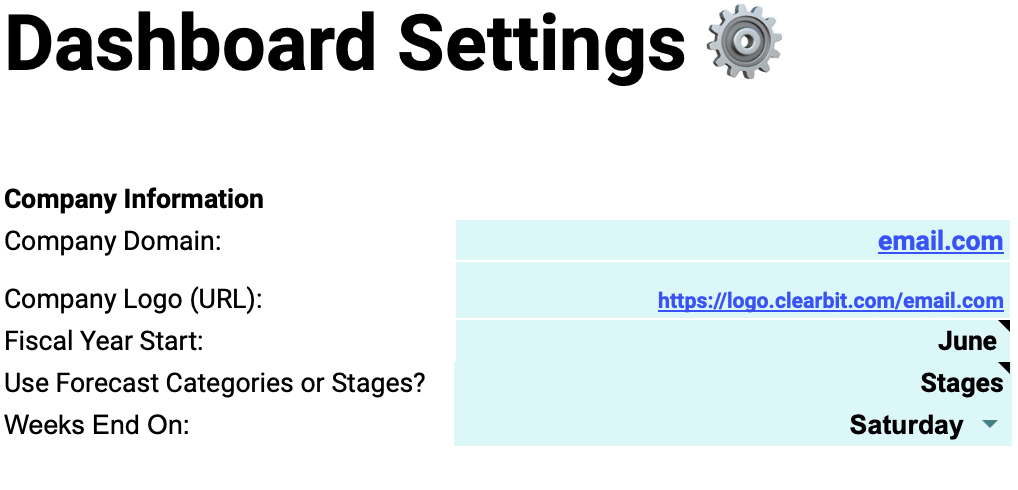
Company Information

Customize your dashboard by adding your company’s domain URL, logo, and fiscal year start date.

Adding company details like domain URL, logo, and fiscal year start to the dashboard.

This ensures that the data and insights are specific to your organization and aligned with your financial reporting periods.

Pipeline Coverage Ratios

Fine-tune your pipeline coverage ratios based on your historical win rates.

Modifying pipeline coverage ratios according to past win rates in Coefficient dashboard.

The pipeline coverage ratio is the total value of opportunities in your pipeline divided by your sales target for a given period. It helps you determine the number of opportunities needed in your pipeline to meet your sales goals.

Pipeline Stages

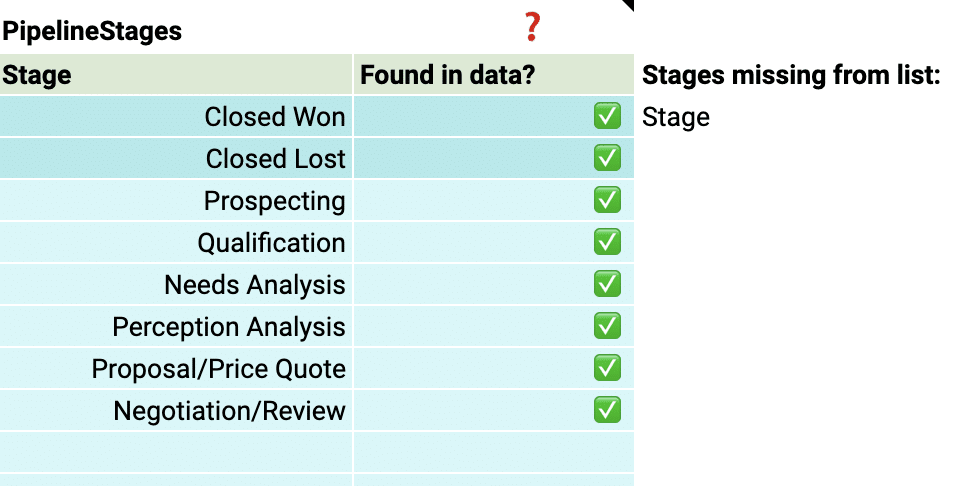
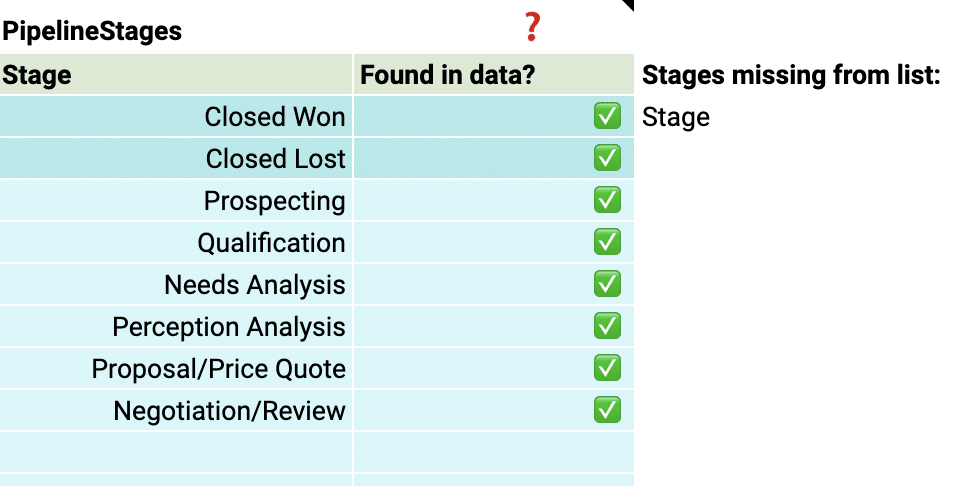
Tailor the pipeline stages in the template to mirror those in your Salesforce setup. This typically includes stages such as “Prospecting,” “Qualification,” “Proposal,” “Negotiation,” and “Closed Won” or “Closed Lost.

Configuring pipeline stages in the Coefficient template to reflect Salesforce setup.

By aligning the stages in the dashboard with your sales process, you can gain accurate insights into the performance and velocity of your pipeline at each stage, identifying any bottlenecks or areas for improvement.

Team members

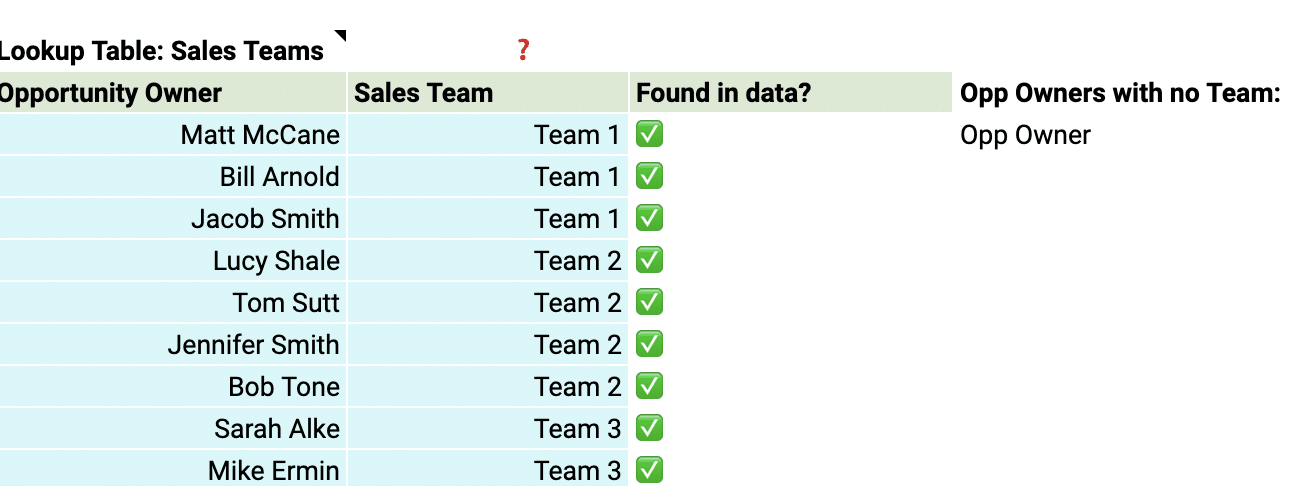
Add details about your sales team members to the dashboard for a more personalized analysis. Include information such as their names, roles, and any other relevant data.

Adding detailed information about sales team members for a tailored dashboard analysis.

This allows you to track individual performance, identify top performers, and pinpoint areas where team members may need additional support or coaching.

With just a few simple customizations, you can transform the Sales Performance Dashboard into a powerful tool tailored to your organization’s specific needs.

Deep Dive into the Sales Performance Dashboard

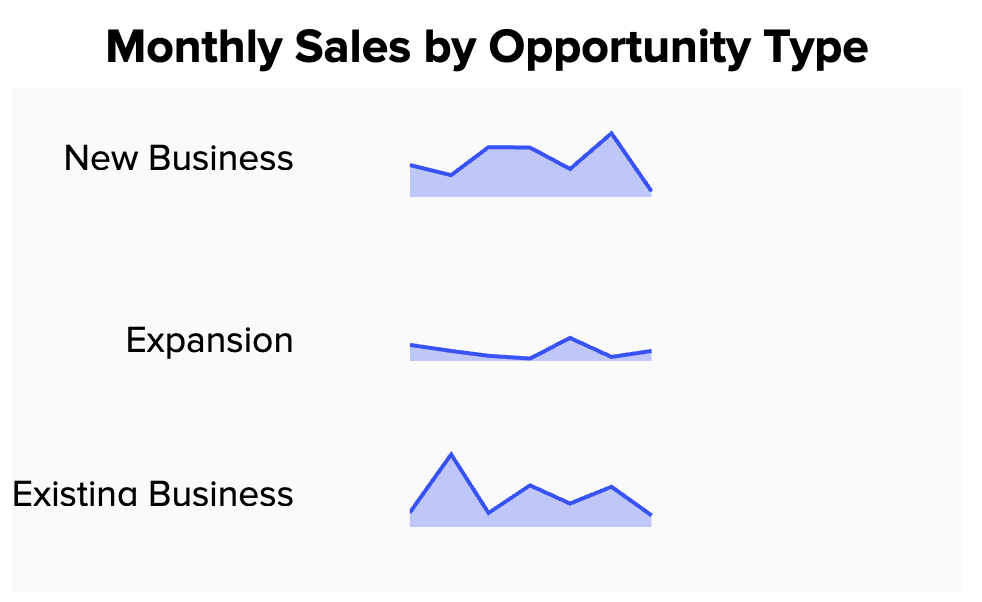
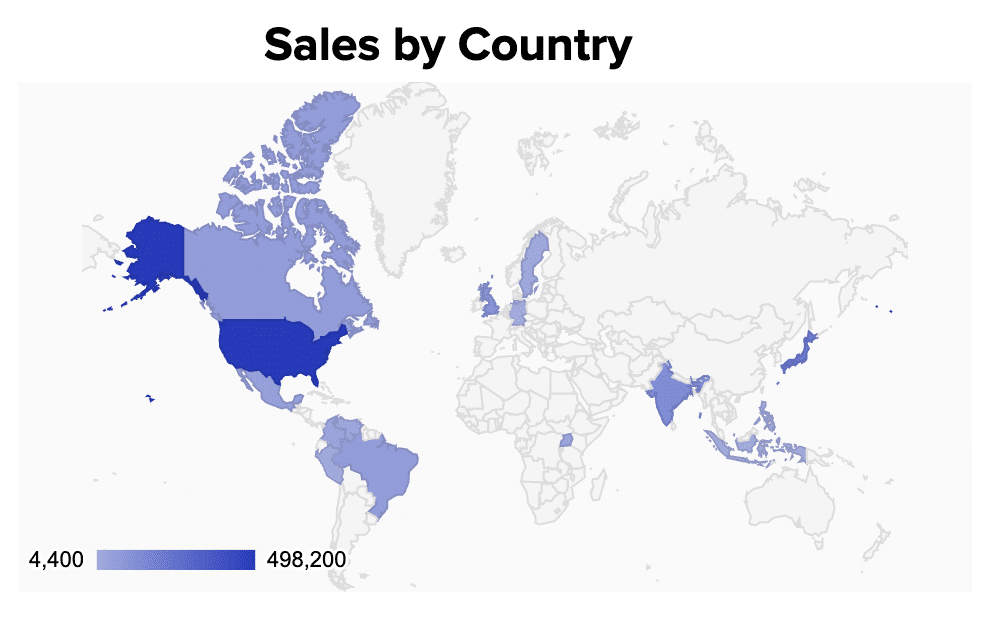
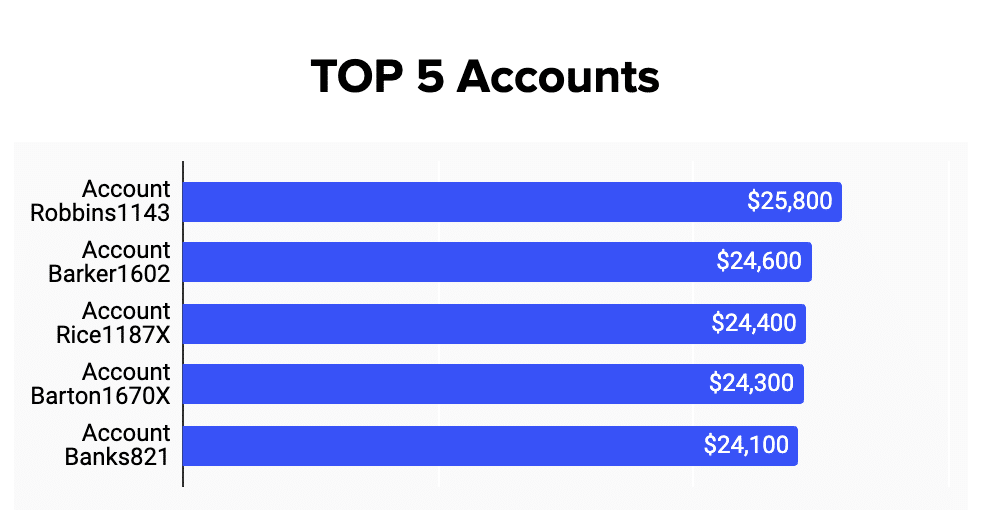
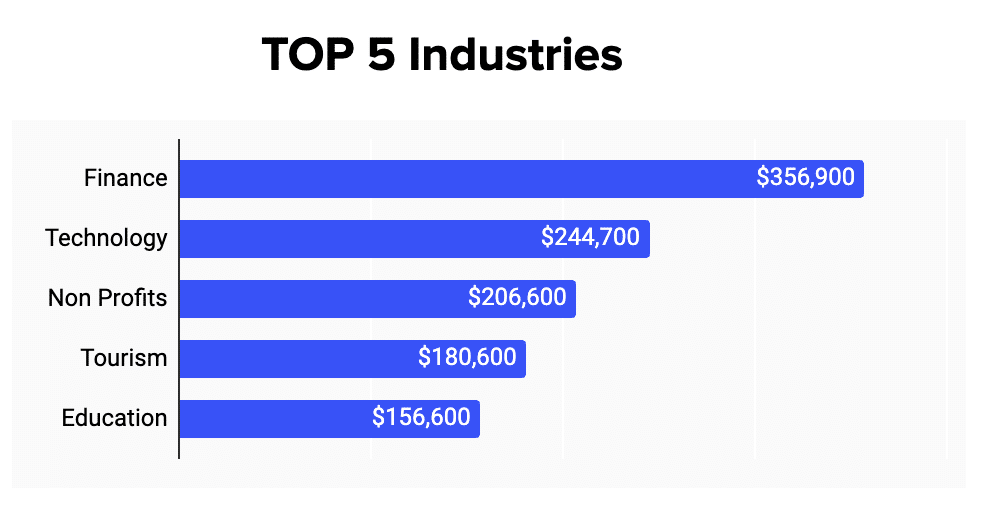
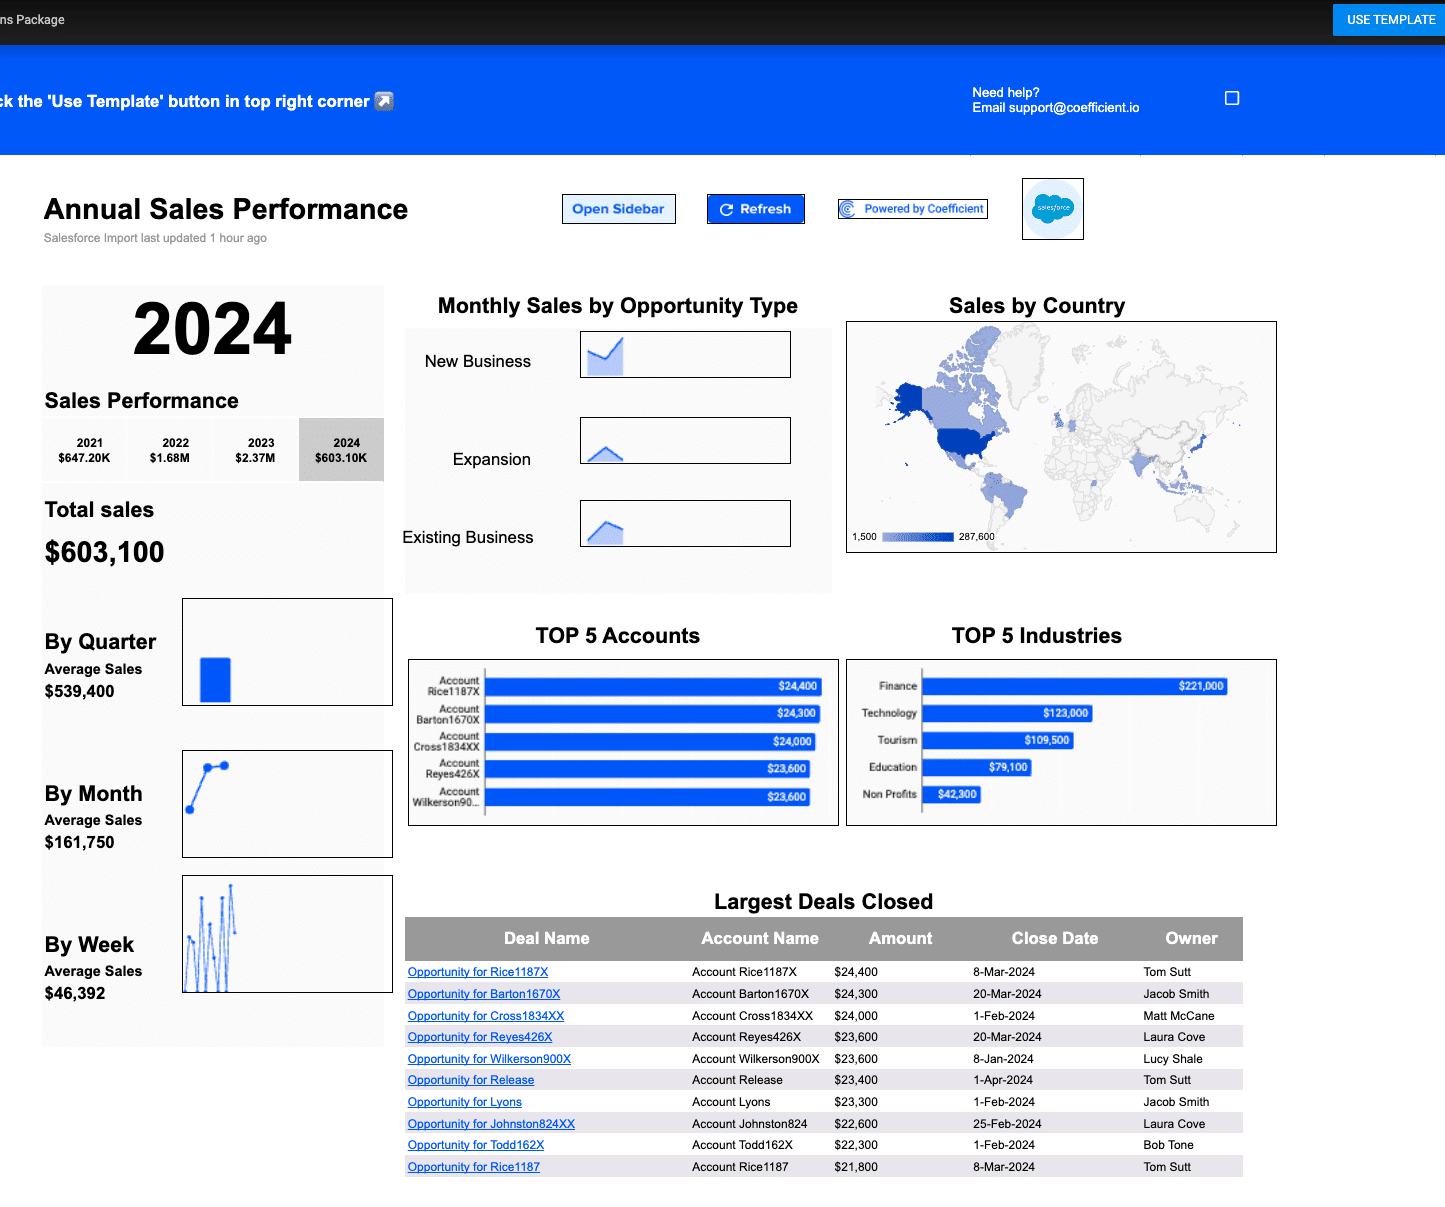
The Sales Performance Dashboard Template gives you a complete view of your sales team’s performance in one spreadsheet. Use the built-in charts and graphs to view sales performance by time period, opportunity type, and country, and filter data by year, team, opportunity, and geolocation.

Here’s an overview of the Sales Performance Dashboard’s key visualizations:

Easily visualize monthly sales by opportunity type new business, upsells, or renewals.

Displaying monthly sales data categorized by new business, upsells, or renewals.

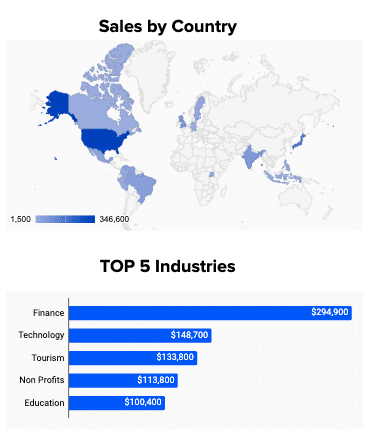
Breakdown your market by geography in the beautiful ‘Sales by Country.’

Analyzing sales metrics broken down by geography in 'Sales by Country' visualization.

Rapidly display your top five accounts.

Showcasing visual representation of the top five accounts in the sales dashboard.

Segment your clients by industries like ‘Finance,’ ‘Technology,’ ‘Non-Profit,’ ‘Tourism,’ ‘Education.’  

Segmenting clients into industries such as Finance, Technology, and Education for analysis.

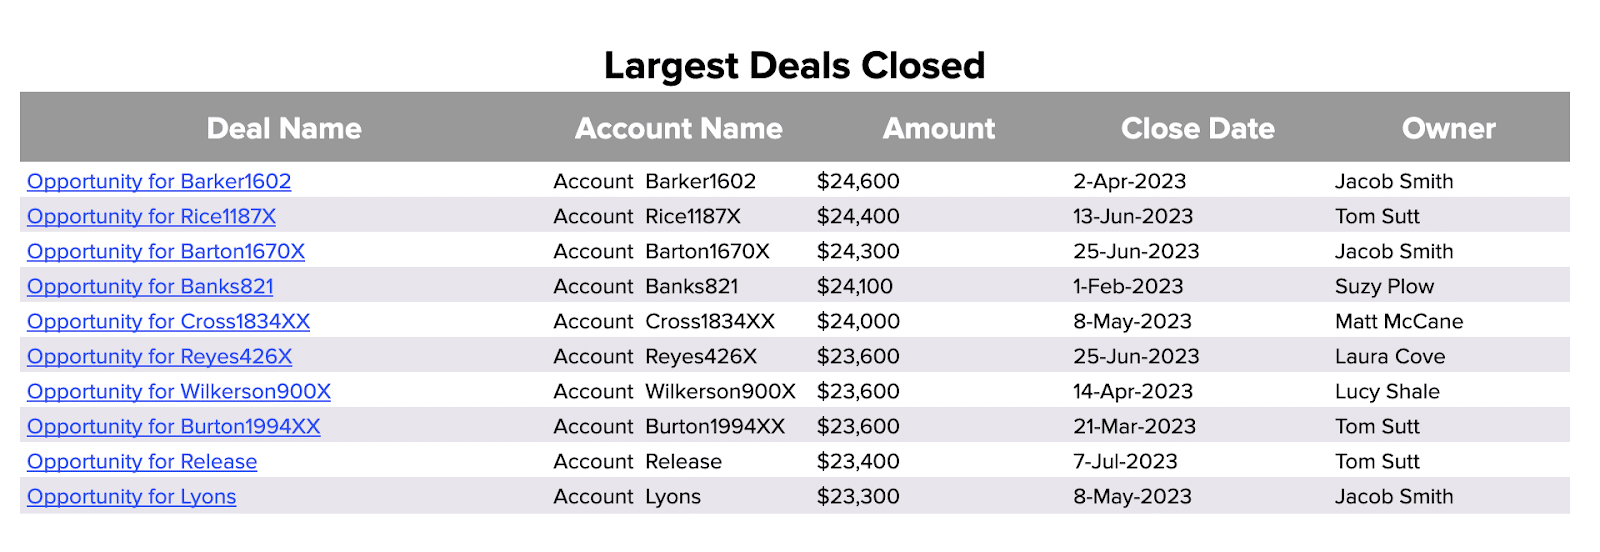
Review your largest deals categorized by ‘Deal Name,’ ‘Account Name,’ ‘Amount,’ ‘Close Date,’ and ‘Owner.’

Reviewing dashboard details of the largest deals including deal name and amount.

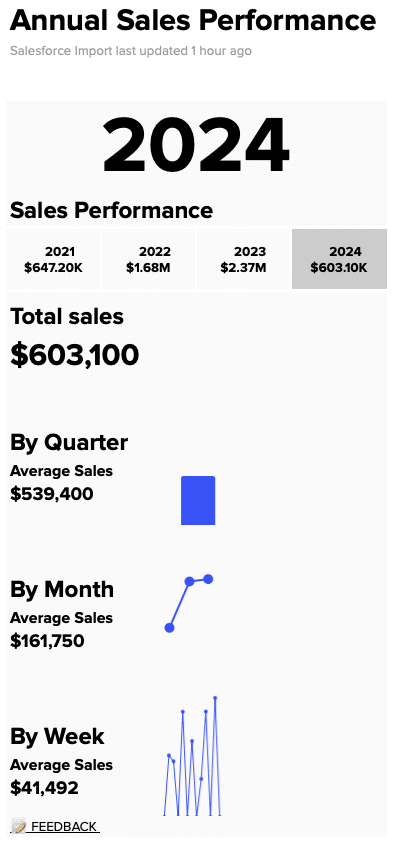
Granularly breakdown sales volume by the week, month, quarter, or year.  

Analyzing sales volume on a weekly, monthly, quarterly, or yearly basis in dashboard view.

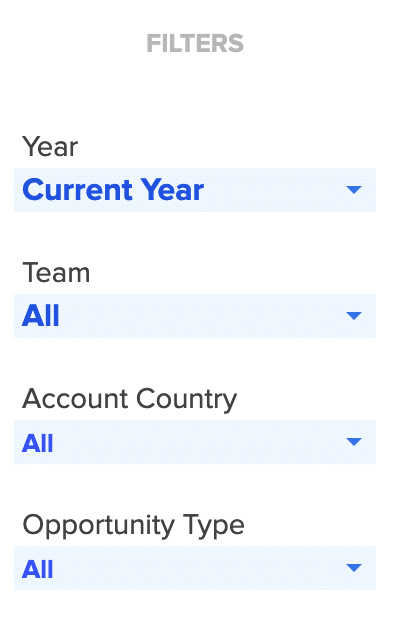
Filter performance by year, team, account category, or opportunity type.

Filtering sales performance by year, team, account category, or opportunity type.

The Coefficient dashboard template for the average deal size is your command center for data-driven decision-making. Key features include:

  • Customizable Views: Tailor the dashboard to focus on the data that matters most to your sales operations, whether it’s tracking performance over time or by product category.
  • Insightful Visualization: With a range of visualization options, the dashboard makes it easy to identify trends and patterns, providing a clearer understanding of how each deal contributes to overall sales goals.
  • Actionable Data: The dashboard empowers you to drill down into specifics, offering a granular view of what’s driving your average deal size and how it can be optimized.

By leveraging these features, sales operations leaders can gain deeper insights into their sales performance, identifying opportunities to enhance efficiency and drive revenue growth.

Actionable Insights from Average Deal Size Data

The average deal size metric gives you valuable information that can help guide your sales strategies.

Here’s how you can use these insights to boost growth:

  • Change your sales focus: If your average deal size is going up, think about putting more resources into big deals. If it’s going down, you might need to speed up your sales process or rethink your target market.
  • Find areas to improve: Look at the things that affect your average deal size to find areas where you can do better. This could mean improving your products, targeting different customers, or making your sales techniques better.
  • Tweak pricing and promotions: Use average deal size data to help decide on prices and promotions. If your average deal size is lower than you want, consider bundling products or offering limited-time discounts to attract bigger deals.

The Importance of Live Data

Coefficient’s dashboard templates use real-time data to help you:

  • Quickly adapt to market changes: With live data, you can spot trends and changes in your average deal size as they happen, so you can adjust your sales strategies right away.
  • Make informed decisions: Base your decisions on the most current information, so your strategies stay relevant and effective.
  • Customize your analysis: Tailor the dashboard to focus on the specific metrics, time periods, or customer groups that matter most to your business.
  • Work together effectively: Easily share insights across your organization, encouraging everyone to make decisions based on data and work towards common goals.

Easily Visualize and Optimize Your Average Deal Size

To optimize sales performance, understanding and leveraging your average deal size is essential. Coefficient’s dashboard templates give you the tools to refine your strategies with actionable insights.

Download the average deal size dashboard template or sign up for Coefficient to boost your sales operations with data-driven precision.

How You Can Measure and Optimize Pipeline Velocity

Accurate sales forecasting and process optimization rely on understanding your pipeline velocity or speed.

Coefficient’s Pipeline Analysis Dashboard for Google Sheets gives you live data insights to effectively manage your pipeline.

In this guide, we’ll explore pipeline velocity, how to calculate it, and how Coefficient can help you maximize its potential.

Understanding Pipeline Velocity

Pipeline velocity measures your sales team’s efficiency in converting opportunities into wins within a specific timeframe. It provides a clear picture of your team’s productivity and your organization’s revenue growth potential.

Pipeline velocity is influenced by several critical factors, including:

  1. Lead Quality and Qualification Process: Higher-quality leads that are properly qualified move through the pipeline faster, as they are more likely to convert into successful sales.
  2. Sales Team Skills and Training: Well-trained sales professionals who understand your products, target market, and sales process can more effectively navigate opportunities through the pipeline.
  3. Sales and Marketing Alignment: Strong alignment between sales and marketing teams, including seamless handoffs and effective communication, is essential for optimizing pipeline velocity.

How to Calculate Pipeline Velocity

To calculate pipeline velocity, use this formula:

Pipeline Velocity = (Number of Opportunities x Win Rate x Average Deal Size) / Length of Sales Cycle

  • Number of Opportunities: The total count of potential deals in your pipeline.
  • Win Rate: The percentage of opportunities that successfully convert into sales.
  • Average Deal Size: The average monetary value of each deal in your pipeline.
  • Length of Sales Cycle: The average duration it takes to close a deal, from the initial interaction to the final sale.

By quantifying how quickly opportunities convert into sales, pipeline velocity offers a direct lens into your team’s productivity and your organization’s revenue growth.

How to Quickly Visualize Pipeline Velocity with Coefficient

Coefficient’s Pipeline Analysis Dashboard for Google Sheets is your gateway to understanding and optimizing pipeline velocity.

Follow these steps to get started:

Step 1: Download the (Free) Pipeline Analysis Dashboard

To start, head to Coefficient.io. Enter your work email in the box and click ‘Get Free Template.’ 

A user entering their work email on Coefficient.io to download a free template.

You can save the template to your Google account by clicking the ‘Use Template’ button at the top right corner of your screen.

Clicking the 'Use Template' button to save the Pipeline Analysis Dashboard to a Google account.

Coefficient will open in a new spreadsheet.

Coefficient opens in a new Google Sheets spreadsheet after template selection.

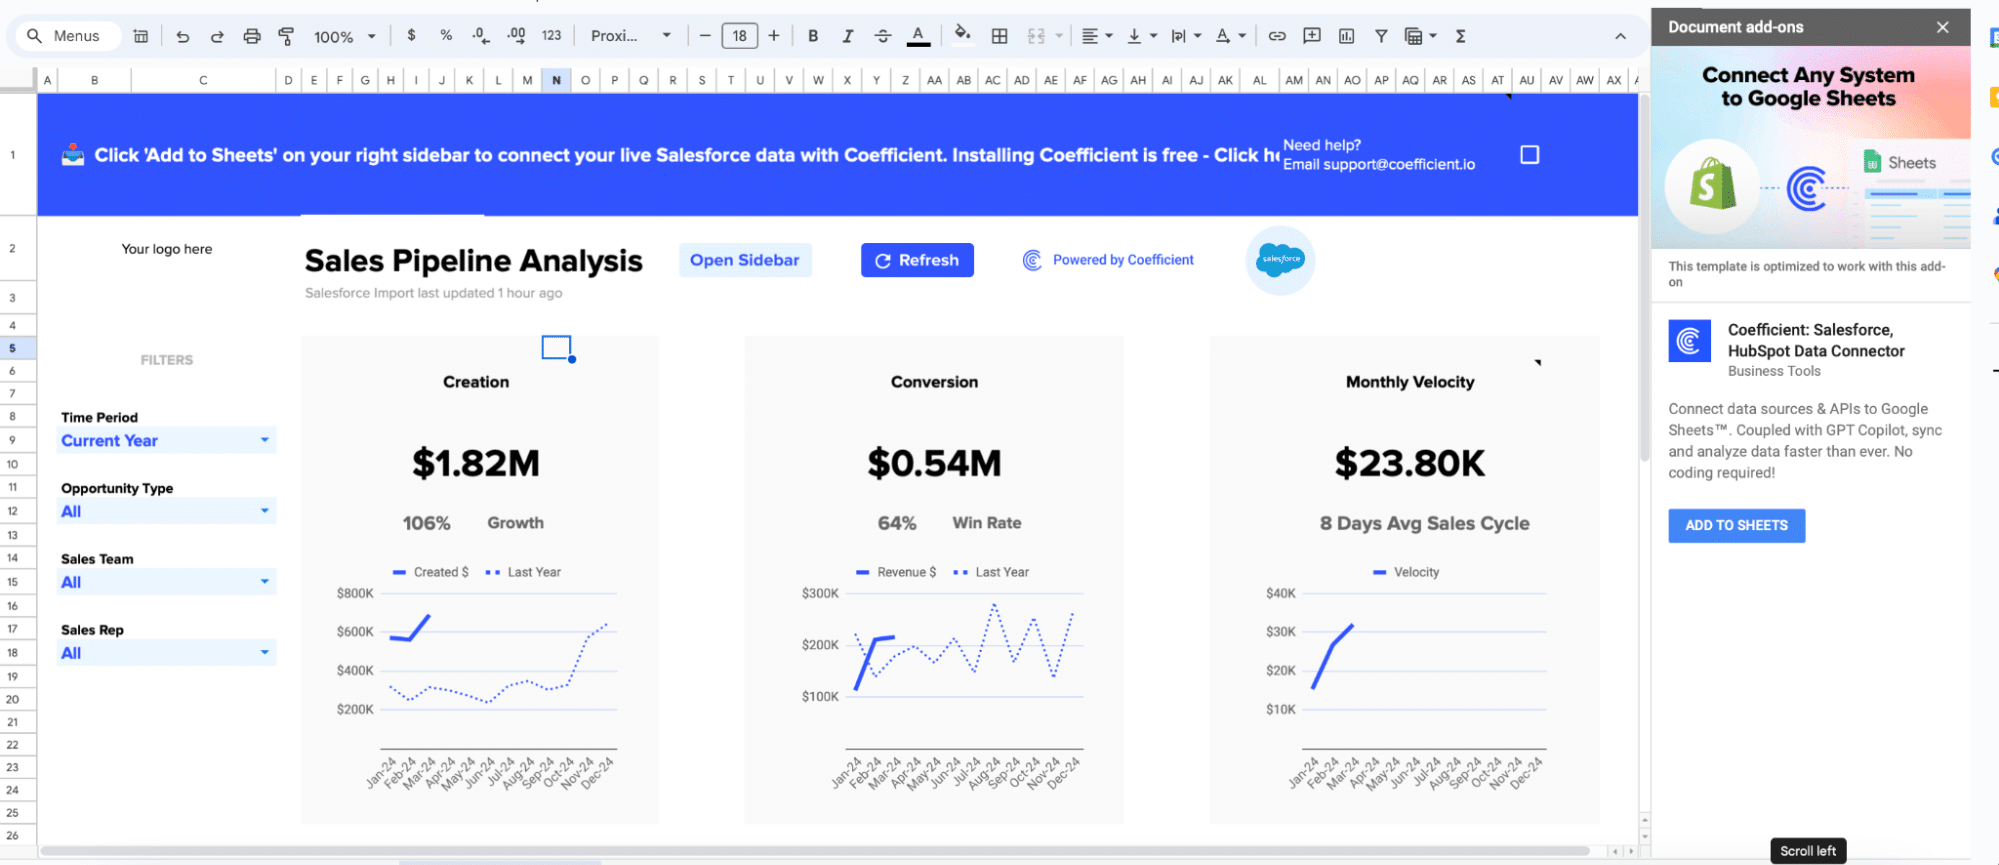
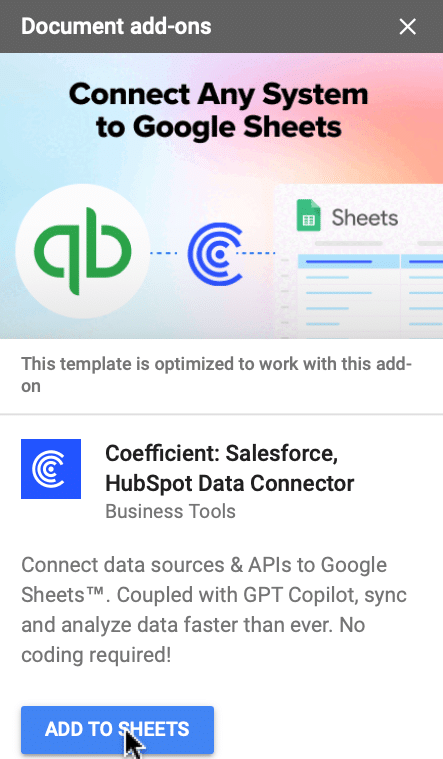
If this is your first time using Coefficient, you’ll need to add it as an add-on to Google Sheets.        

Click â€˜Add to Sheets’ to continue.

Initiating the addition of Coefficient to Google Sheets by clicking 'Add to Sheets'.

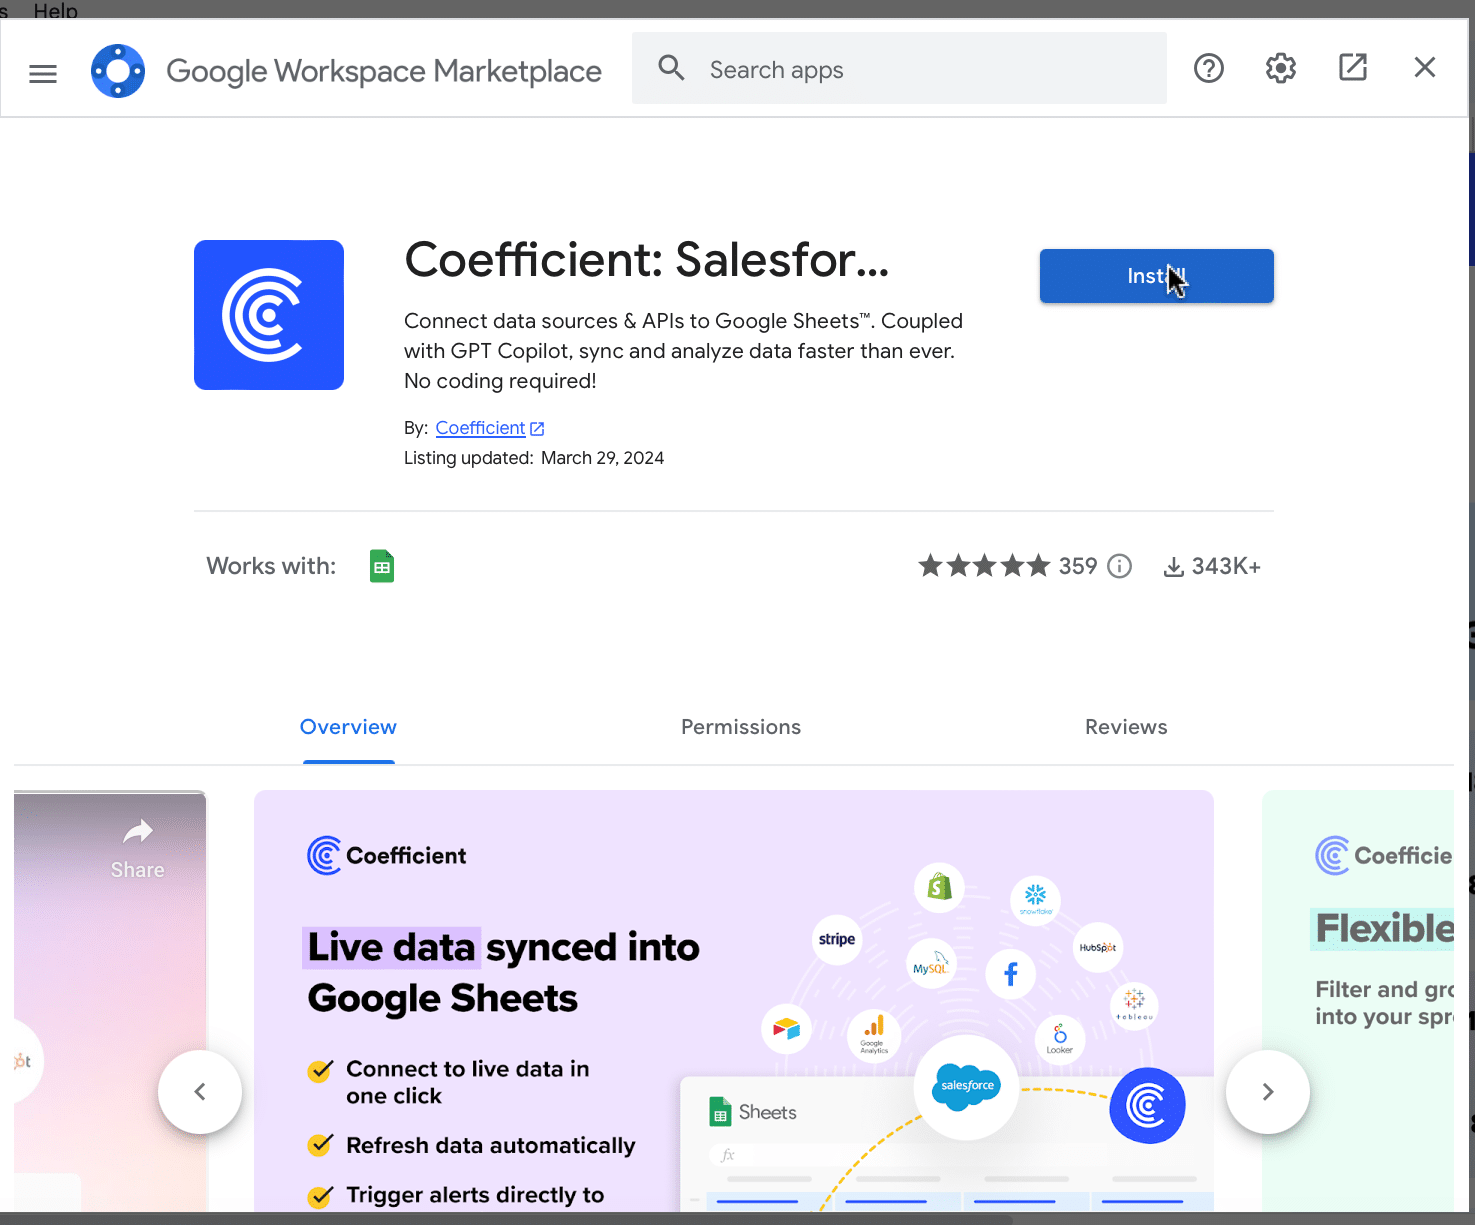
Hit the â€˜Install’ button and follow the prompts to complete the installation.

Installing Coefficient following prompts completion in Google Sheets.

Step 2: Connect Coefficient to Salesforce

After installation is complete, hit â€˜Done’ to return to your spreadsheet.

Clicking done to return to the spreadsheet

Click ‘Connect to Salesforce’ from the Coefficient menu on the right-hand side of your spreadsheet.

Returning to the spreadsheet and selecting 'Connect to Salesforce' from the Coefficient menu.

Follow the prompts to authorize Coefficient to your Salesforce account.

Following prompts for authorizing Coefficient access to a Salesforce account.

If successful, you’ll see the following notification at the top of your spreadsheet.

Notification displayed atop the spreadsheet signaling successful Coefficient to Salesforce connection.

To update your data, navigate to the ‘Salesforce Import’ tab of your spreadsheet and click ‘Refresh.’
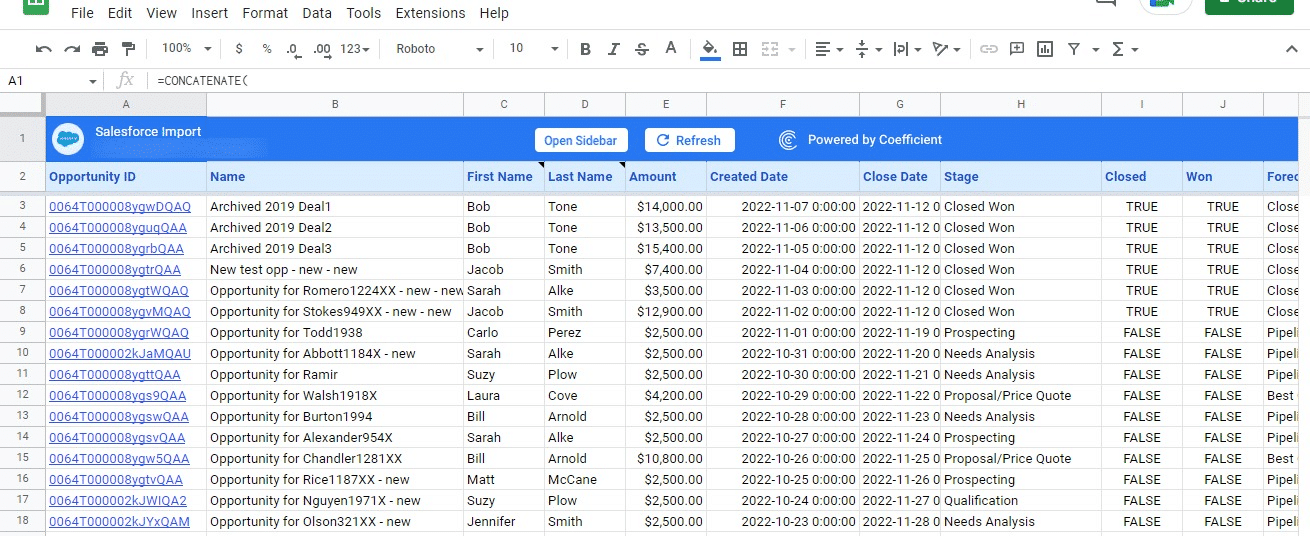
Navigating to 'Salesforce Import' tab and refreshing data in the spreadsheet.

You can also auto-refresh your data by clicking ‘Set Refresh Schedule.’
Setting an auto-refresh schedule for Salesforce data in Coefficient.

Set up an hourly, daily, or weekly auto-refresh schedule, and Coefficient will automatically update your data based on that time interval.
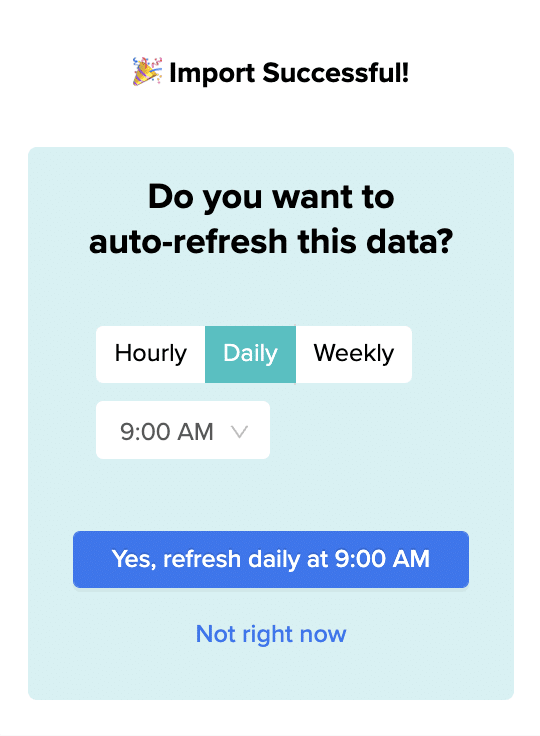
choosing auto-refresh cadence: hourly, daily, weekly

That means, going forward, Coefficient will automate your Salesforce data exports to Google Sheets for you.

Step 3. Customize Your Dashboard

Tailor the template to your organization’s unique needs by navigating to the ‘Settings’ tab.

Personalizing the pipeline analysis dashboard by customizing company information and pipeline details in 'Settings' tab.

Company Information

Customize your company information, pipeline coverage ratios, pipeline stages, and team member details for a more personalized analysis.

Adjusting pipeline coverage ratios based on historical win rates in dashboard settings.

Personalize your dashboard by including your company’s domain URL, logo, and the start of your fiscal year. This ensures that the data and insights are specific to your organization and aligned with your financial reporting periods.

Pipeline Coverage Ratios

Fine-tune your pipeline coverage ratios based on your historical win rates.

 Customizing pipeline stages to mirror Salesforce setup and adding sales team details in the dashboard.

These ratios help you determine the number of opportunities needed in your pipeline to meet your sales targets, ensuring that you have a sufficient volume of potential deals to achieve your goals.

Pipeline Stages

Customize the pipeline stages in the template to mirror those in your Salesforce setup.

Customize the pipeline stages in the template to mirror those in your Salesforce setup.

By aligning the stages in the dashboard with your sales process, you can gain accurate insights into the performance and velocity of your pipeline at each stage.

Team members

Add details about your sales team members to the dashboard for a more personalized analysis.

This allows you to track individual performance, identify top performers, and pinpoint areas where team members may need additional support.

Image19

With just a few simple customizations, you can transform the Pipeline Velocity Dashboard Template into a powerful tool tailored to your organization’s specific needs.

Deep Dive into the Pipeline Velocity Dashboard Template

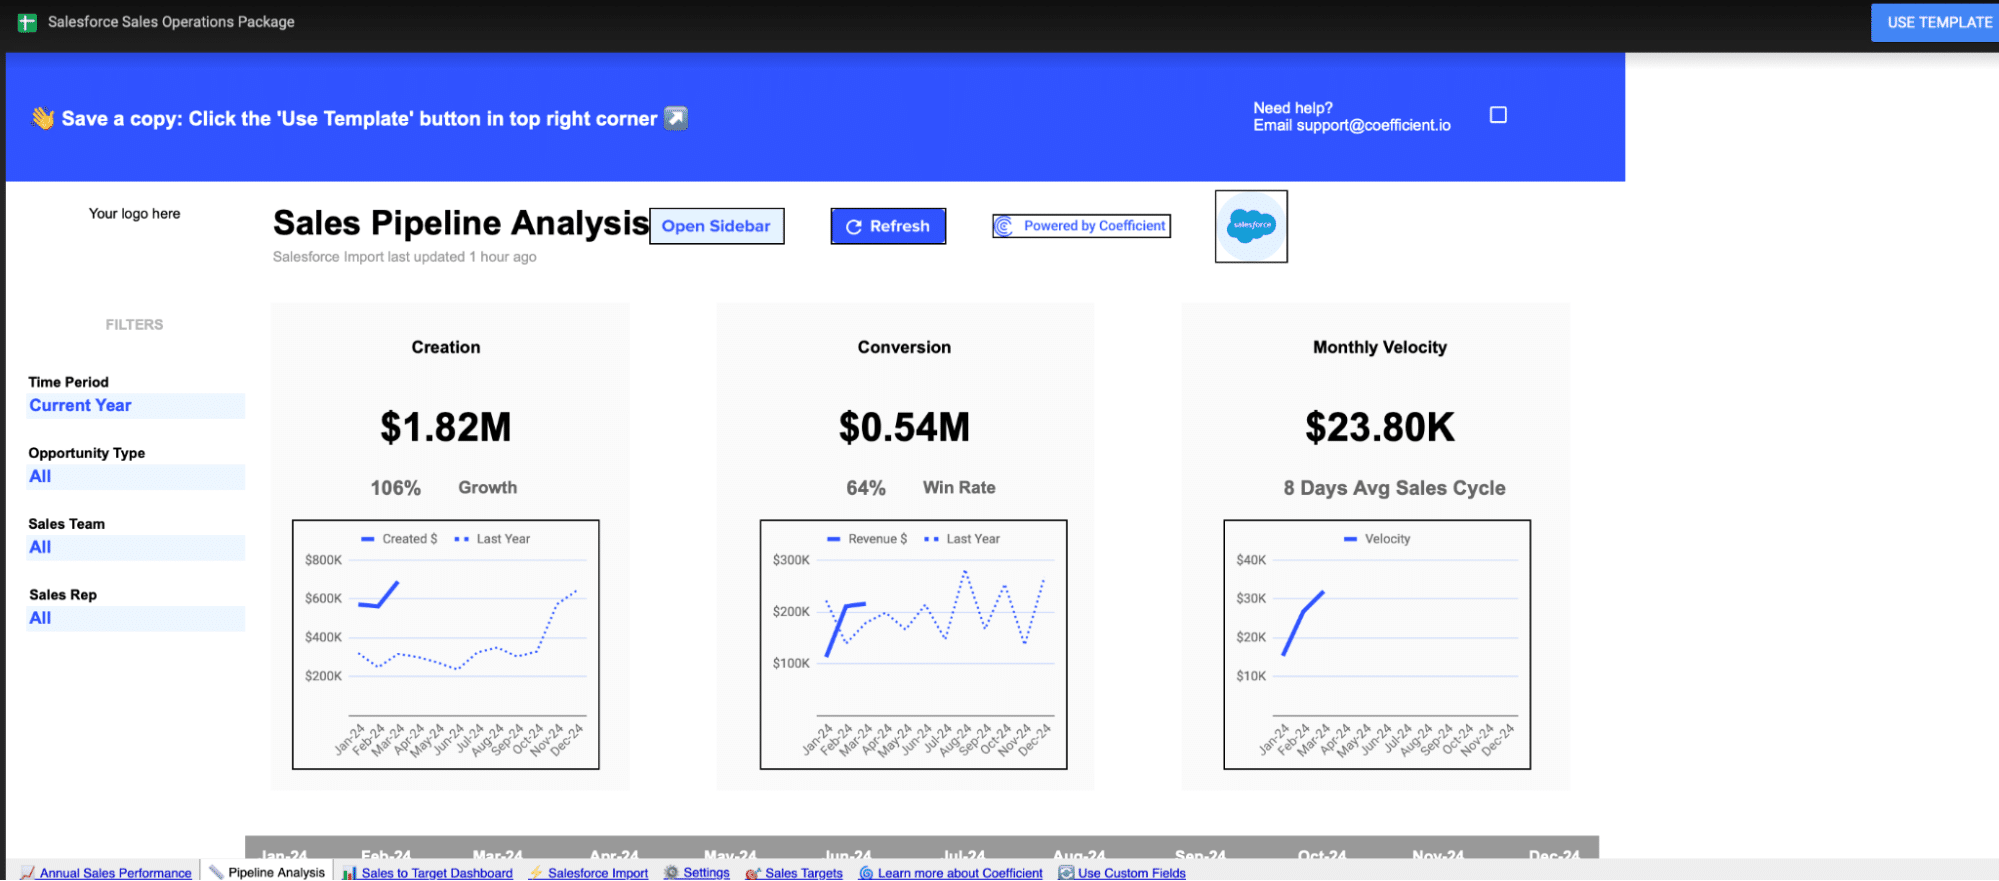
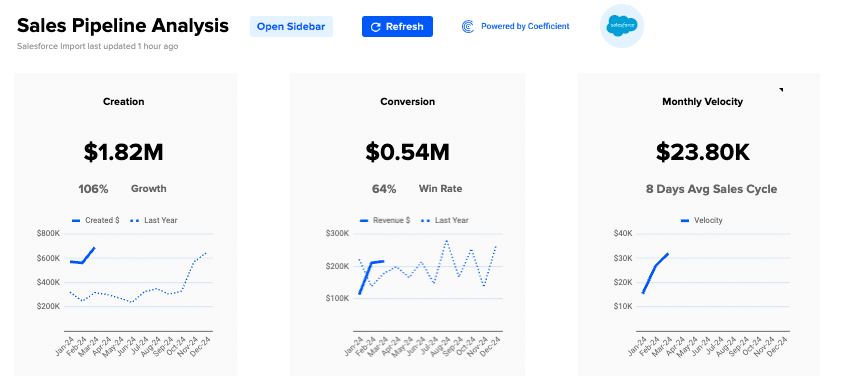
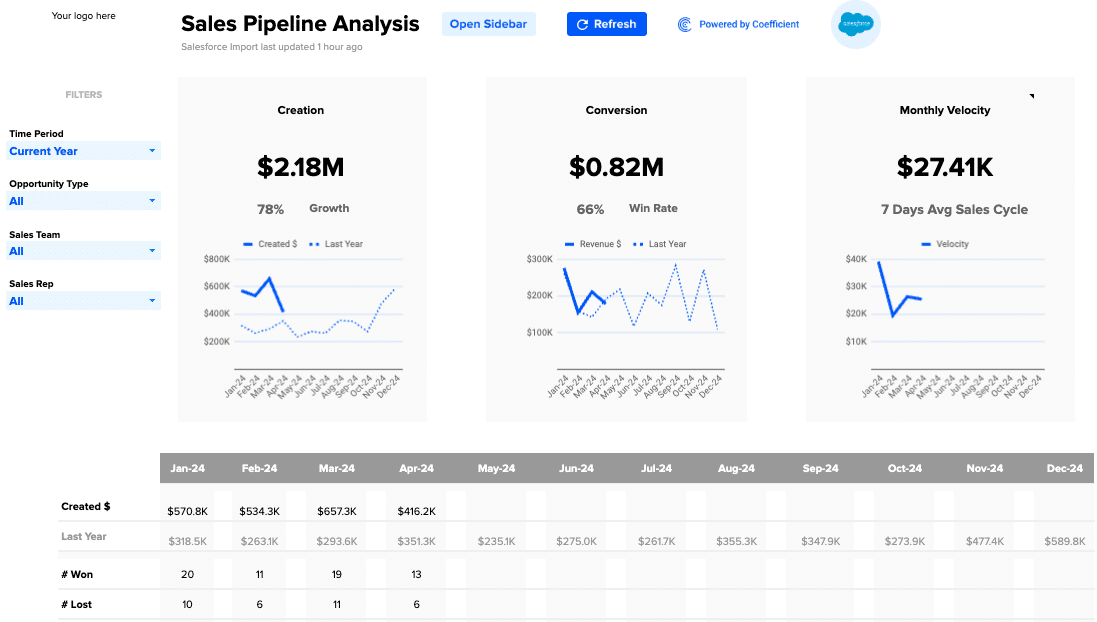
The Pipeline Velocity Dashboard Template offers a detailed view of your pipeline health through three key components:

  1. Pipeline Creation: Visualizes the growth in the number of opportunities and their potential value, compared year over year.
  2. Conversion Trends: Shows the percentage of opportunities that successfully turn into sales, also compared year over year.
  3. Monthly Velocity: Illustrates the average time it takes for opportunities to convert into sales, providing a monthly overview.
Viewing three key components of pipeline health: Pipeline Creation, Conversion Trends, Monthly Velocity in the dashboard template.

Use these insights to optimize your sales strategies, reallocate resources to the most profitable opportunities, and adjust pricing models in response to market changes.

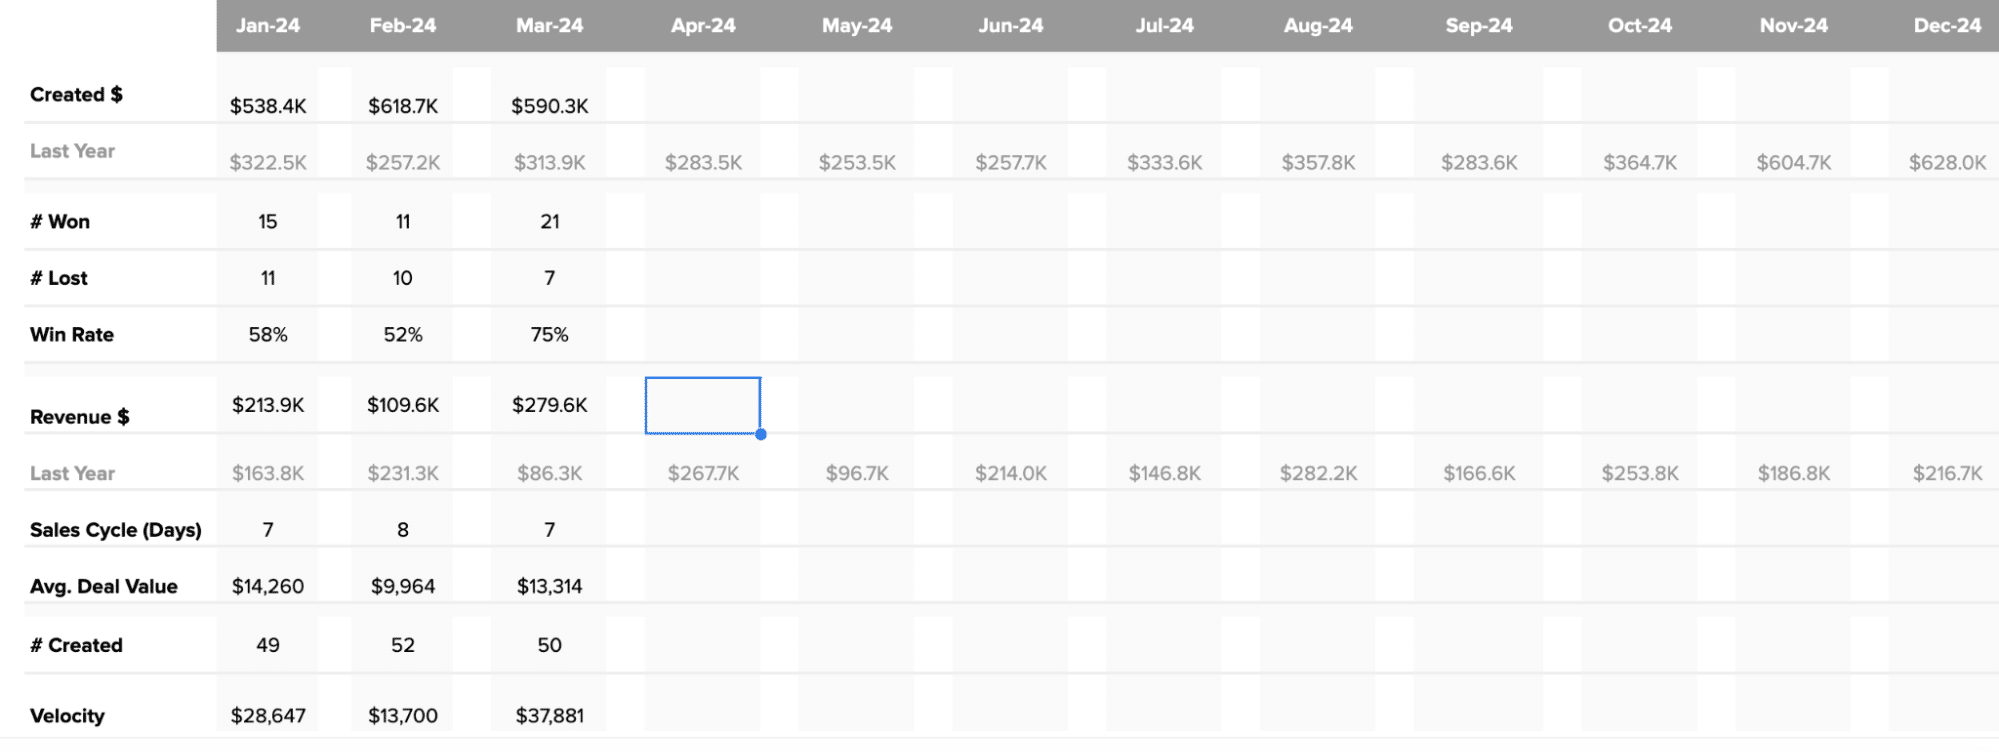
If you want to examine the data more closely, beneath the graphs offer a deeper dive into your pipeline metrics. It displays monthly figures for key indicators such as:

  • Number of opportunities created, won, and lost
  • Win rate percentage
  • Total revenue and comparison to the previous year
  • Length of the sales cycle
  • Average deal value
  • Number of new opportunities created
Analyzing detailed pipeline metrics beneath the graphs for an in-depth examination.

How to Action Insights into Your Pipeline Velocity

Coefficient’s Pipeline Analysis Template helps you make informed decisions by providing real-time data insights. Here’s how you can use these insights to drive growth:

  • Fine-tune sales strategies: Spot trends in pipeline creation and conversion rates to identify what’s working and what needs improvement. If win rates are low, consider tweaking your sales approach or providing more training for your team.
  • Put resources where they matter most: Use data on sales velocity and average deal size to focus on the most profitable opportunities or regions. This ensures you’re getting the best return on your investments.
  • Keep pricing competitive: Quickly adjust pricing based on real-time data about deal age and size. This helps you stay competitive and profitable as market conditions change.

Real-Time Data: Your Secret Weapon

Coefficient’s dashboard templates give you the power of real-time data, allowing you to:

  • Identify market trends early and take action quickly
  • Make decisions based on the latest information, keeping your strategies relevant
  • Customize the dashboard to focus on your specific priorities and needs
  • Share insights easily across your organization, promoting data-driven decision-making

Supercharge Your Sales Pipeline Velocity Today

Download Coefficient’s pipeline velocity dashboard template or start your journey to harness the full potential of your sales data.

How You Can Measure and Optimize Win Rate Today (2024 Guide)

Win rate is a crucial metric that reflects your sales team’s effectiveness in closing deals. It provides valuable insights into the health of your sales process and helps identify areas for improvement.

In this guide, we’ll dive deep into win rate, explore how to calculate it, and show you how Coefficient’s Win Loss Analysis Dashboard for HubSpot can help you optimize your sales performance.

Want a quick video walkthrough instead? Analytics expert, Frank Ferris, has you covered.

Understanding Win Rate

Win rate represents the percentage of sales opportunities that result in closed deals. It’s a key indicator of your sales team’s ability to convert leads into customers.

A high win rate suggests a strong sales process, effective lead qualification, and compelling product or service offerings. Conversely, a low win rate may signal issues in your sales approach, such as poor lead quality, ineffective messaging, or intense competition.

Factors that impact win rate:

  • Lead Quality: Higher-quality leads that align with your ideal customer profile are more likely to convert into won deals.
  • Sales Skills: A well-trained and experienced sales team can effectively communicate value, overcome objections, and close deals.
  • Competitive Landscape: Your win rate can be influenced by the strength of your competitors and their offerings.

How to Calculate Win Rate

To calculate win rate, use this formula:

Win Rate = (Number of Won Deals / Total Number of Deals) x 100

  • Number of Won Deals: The count of sales opportunities that resulted in closed-won deals within a given period.
  • Total Number of Deals: The total count of all sales opportunities pursued within the same period, including both won and lost deals.

Using a Pre-Built Pipeline Dashboard with Win Rate

Coefficient’s Win Loss Analysis Dashboard in Google Sheets built for HubSpot or Salesforce makes it easy to track and analyze your win rate.

Here’s a quick tutorial on how to use it:

Step 1: Download the (Free) Pipeline Analysis Dashboard

To start, head to Coefficient.io.

Enter your work email in the box and click ‘Get Free Template.’ 

Entering a work email to access the 'Get Free Template' offer on a website.

You can save the template to your Google account by clicking the ‘Use Template’ button at the top right corner of your screen.

Utilizing the 'Use Template' button to save a template in Google Sheets.

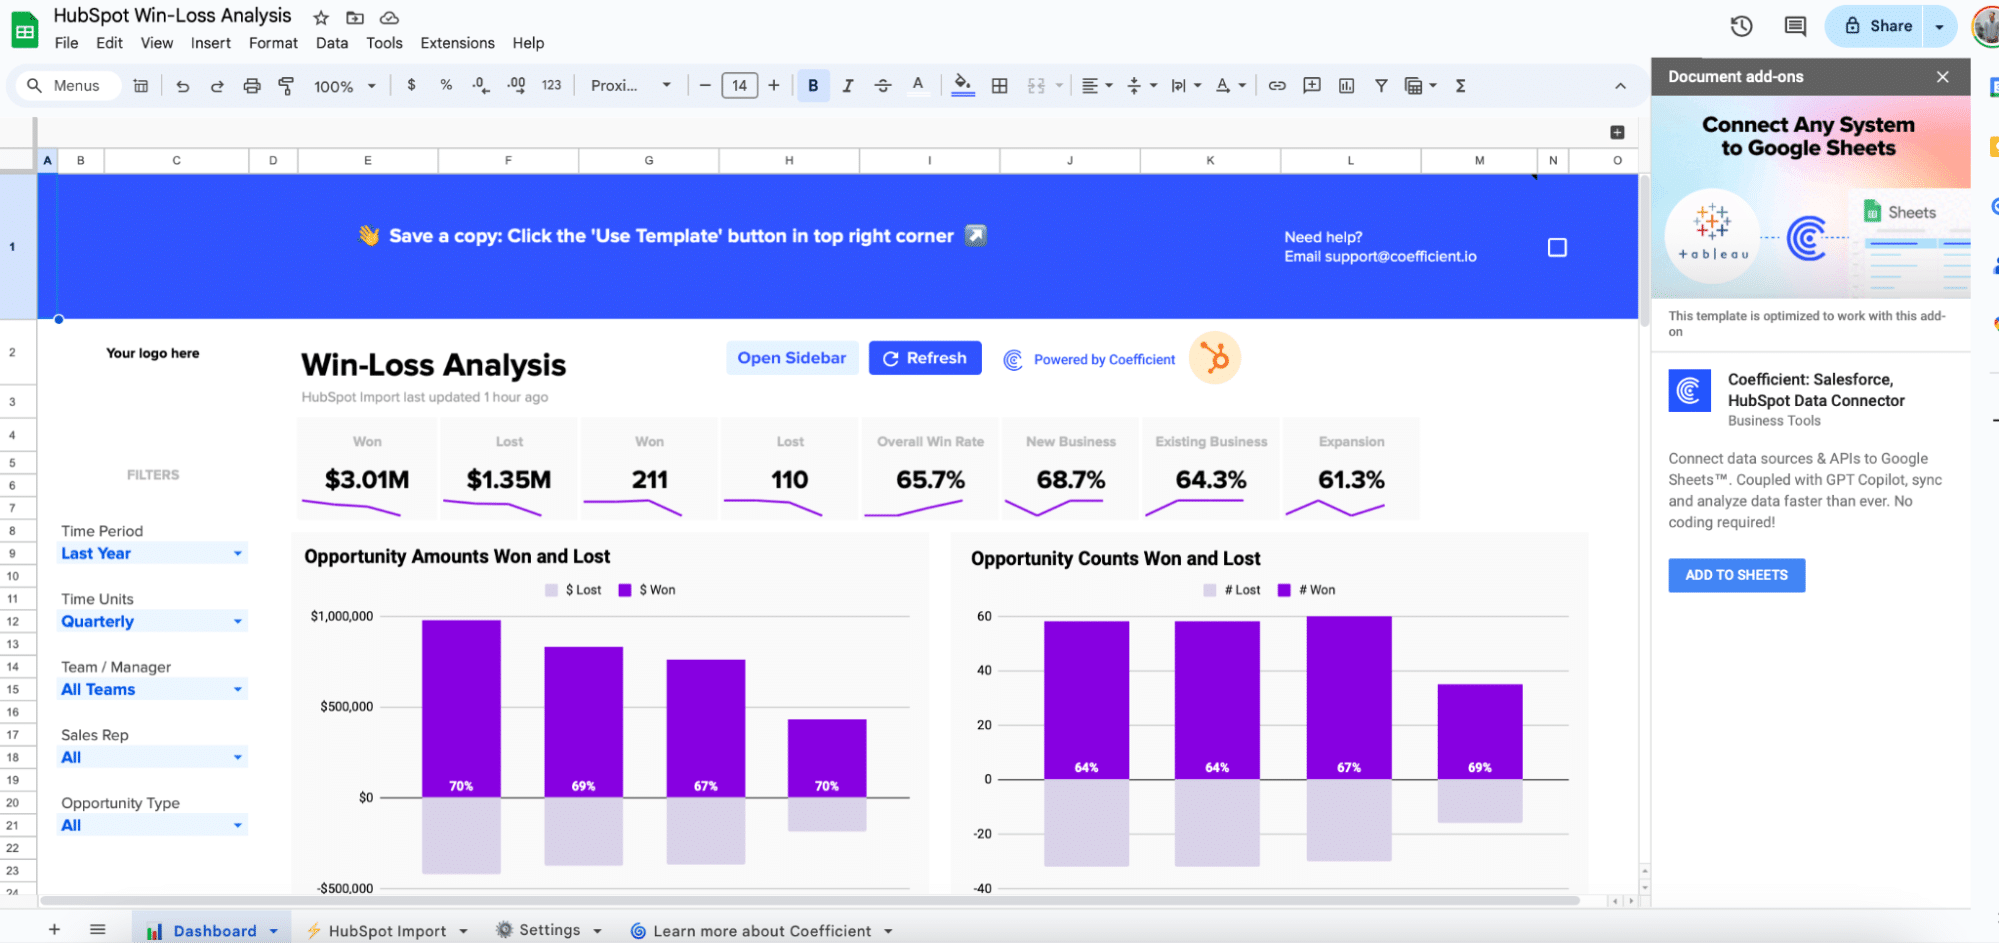
Coefficient will open in a new spreadsheet.

Opening a new spreadsheet in Google Sheets through the Coefficient interface.

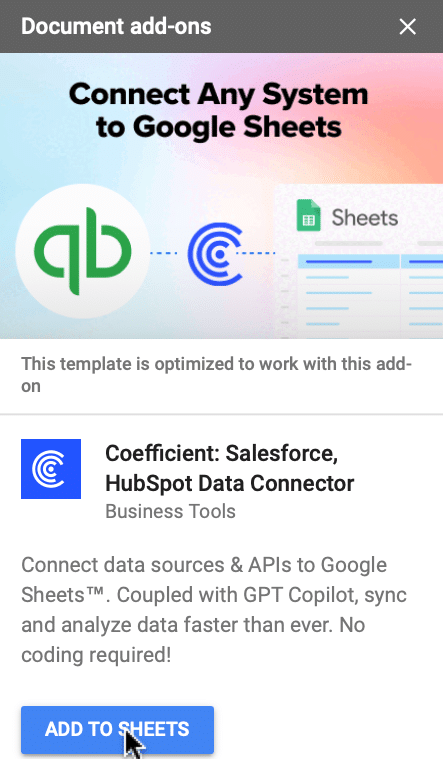
If this is your first time using Coefficient, you’ll need to add it as an add-on to Google Sheets. Click â€˜Add to Sheets’ to continue.

First-time process of adding Coefficient as an add-on in Google Sheets.

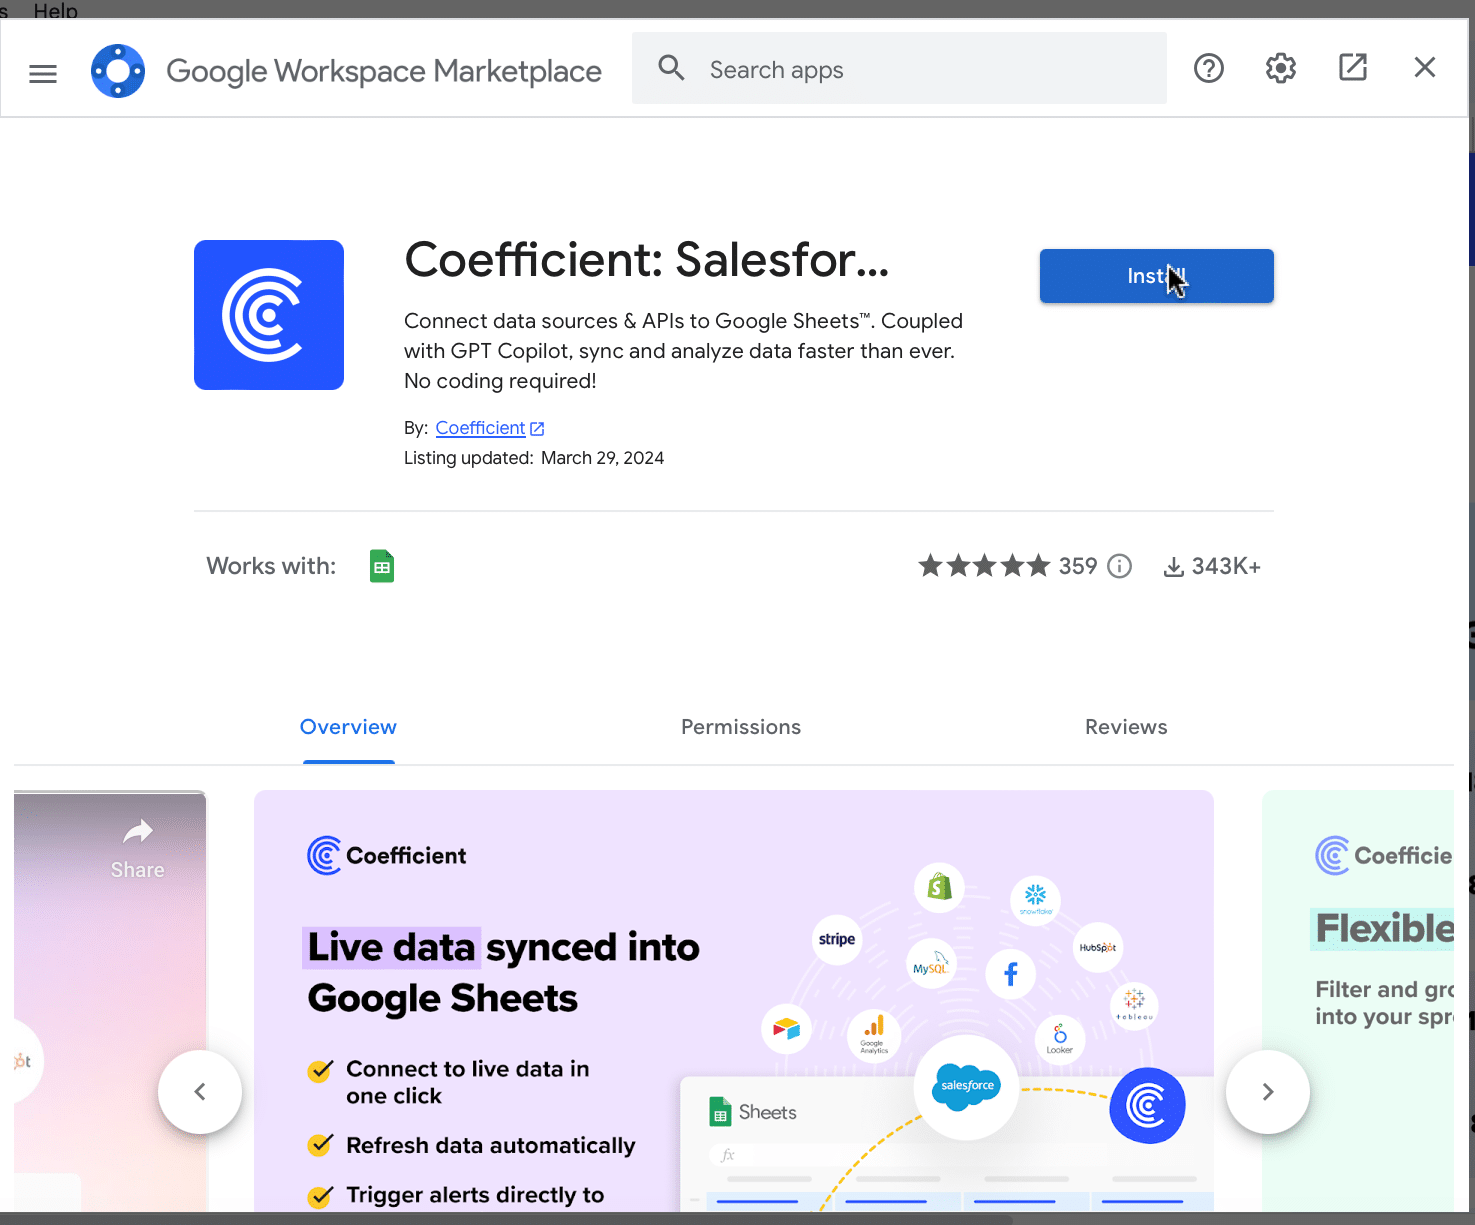
Hit the â€˜Install’ button and follow the prompts to complete the installation.

Completing the Coefficient add-on installation with the 'Install' button in Google Sheets.

Step 2: Connect Coefficient to HubSpot or Salesforce

After installation is complete, click â€˜Done’ to return to your spreadsheet.

Clicking 'Done' to return to the Google Sheets spreadsheet post-Coefficient installation.

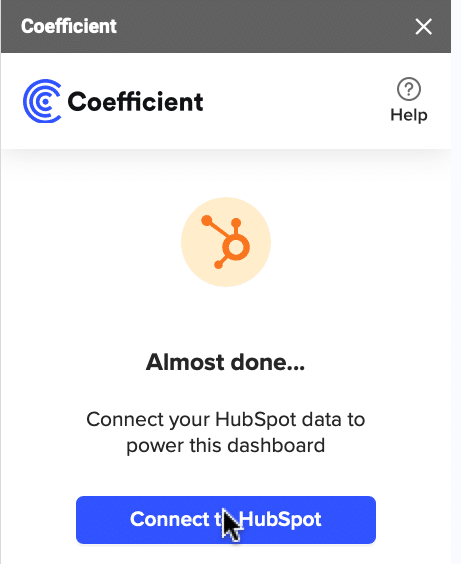
Click ‘Connect to HubSpot’ from the Coefficient menu on the right-hand side of your spreadsheet.

Initiating a connection to HubSpot via the Coefficient menu in Google Sheets.

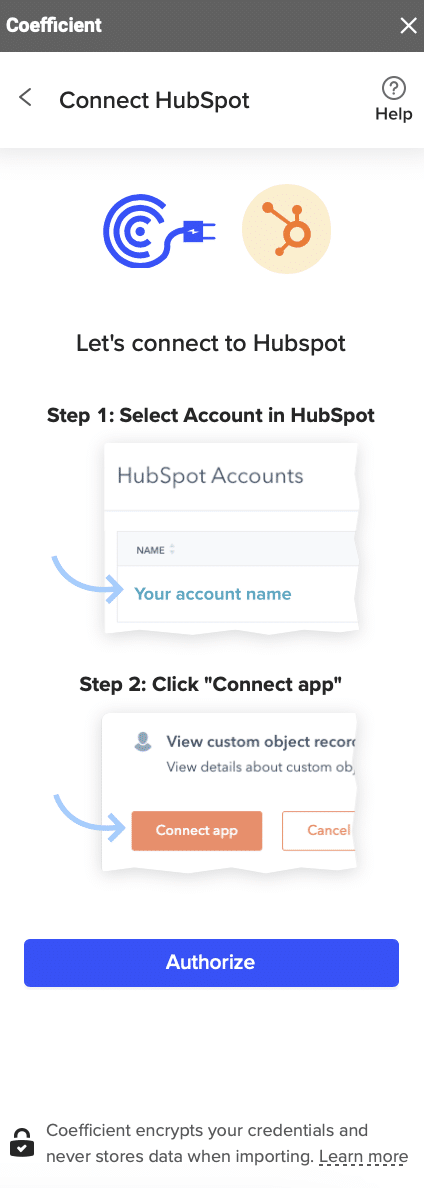
Follow the prompts to authorize Coefficient to your HubSpot account.

Following authorization prompts to connect Coefficient to a HubSpot account.

If successful, you’ll see the following notification at the top of your spreadsheet.

Displaying a success notification for HubSpot connection on Google Sheets.

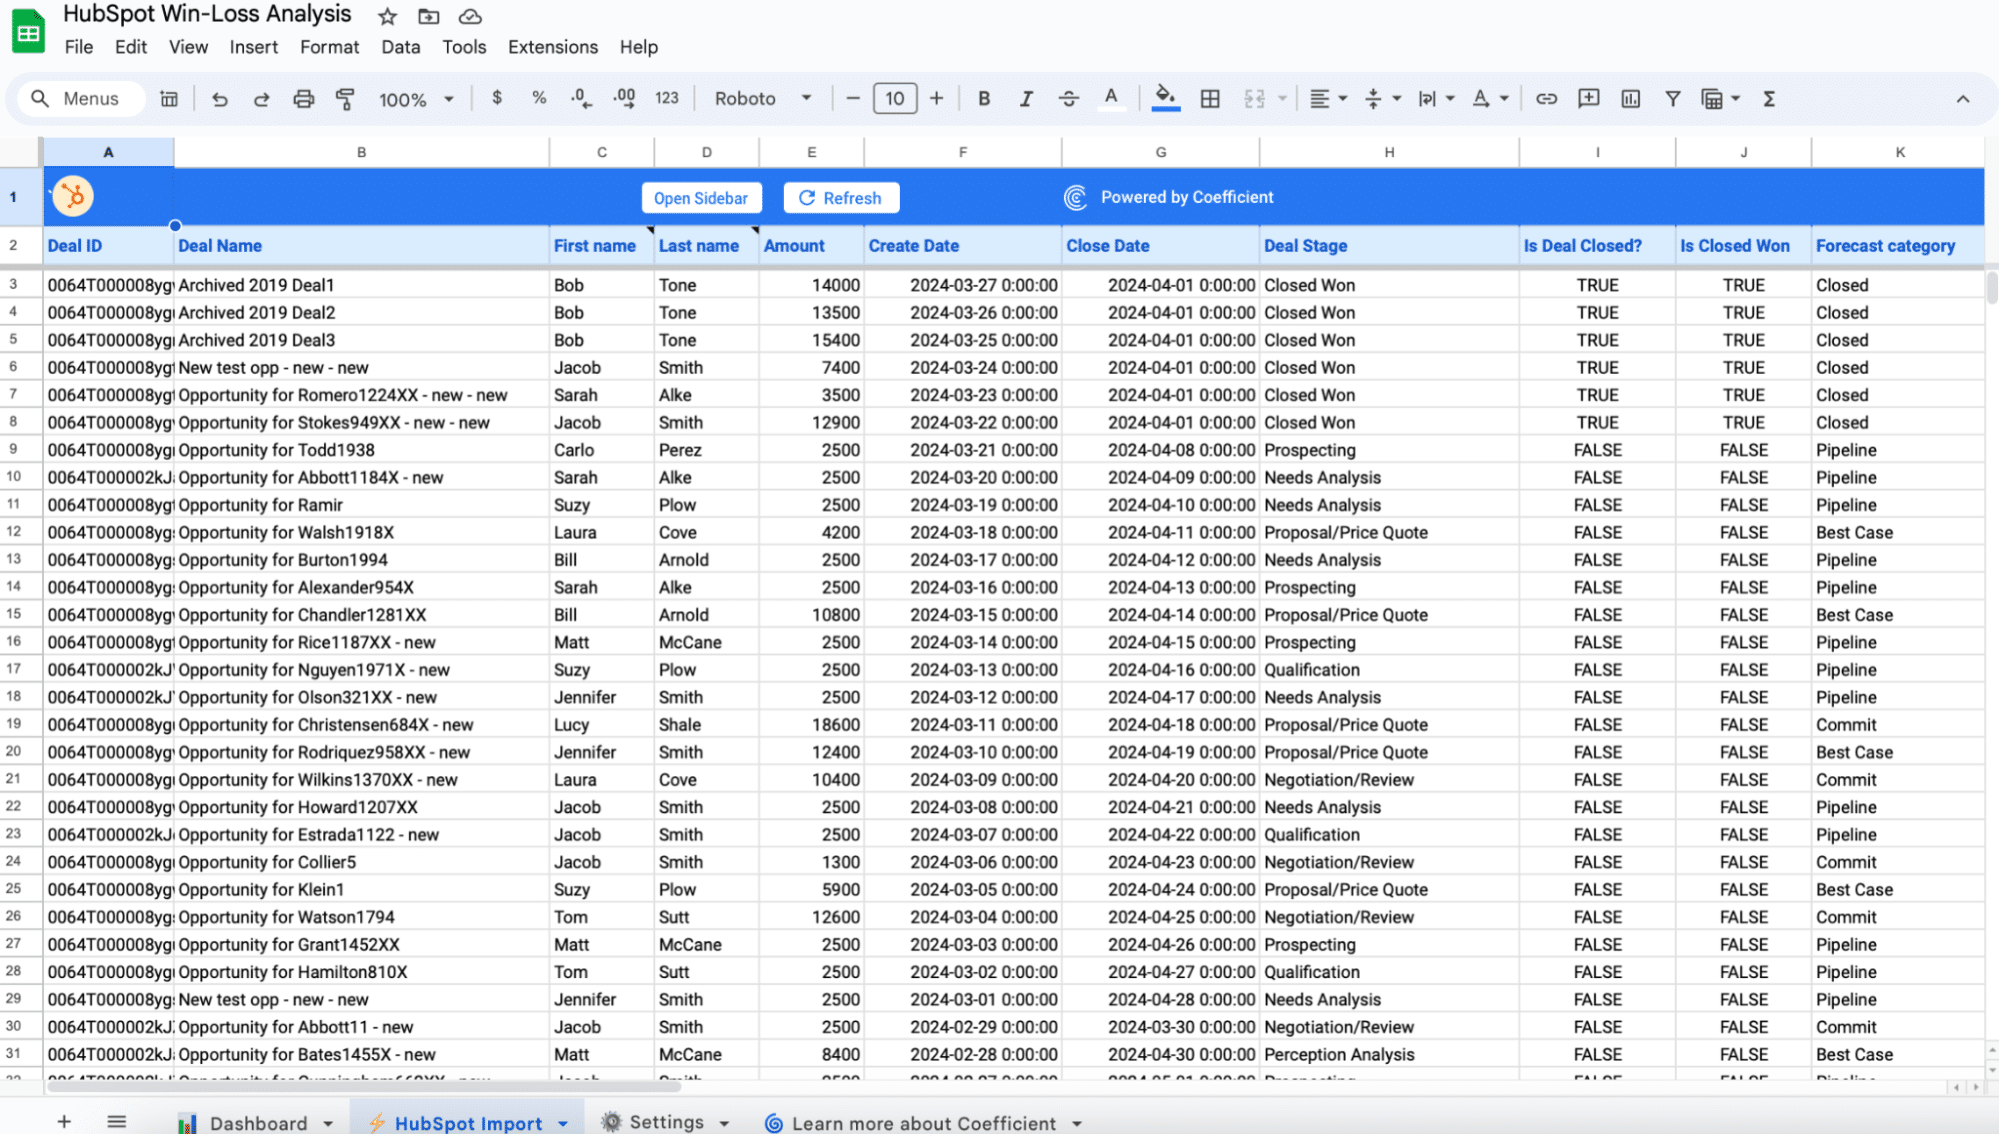
To update your data, navigate to the ‘HubSpot Import’ tab of your spreadsheet and click ‘Refresh.’

 Updating data by clicking 'Refresh' on the 'HubSpot Import' tab in Coefficient.

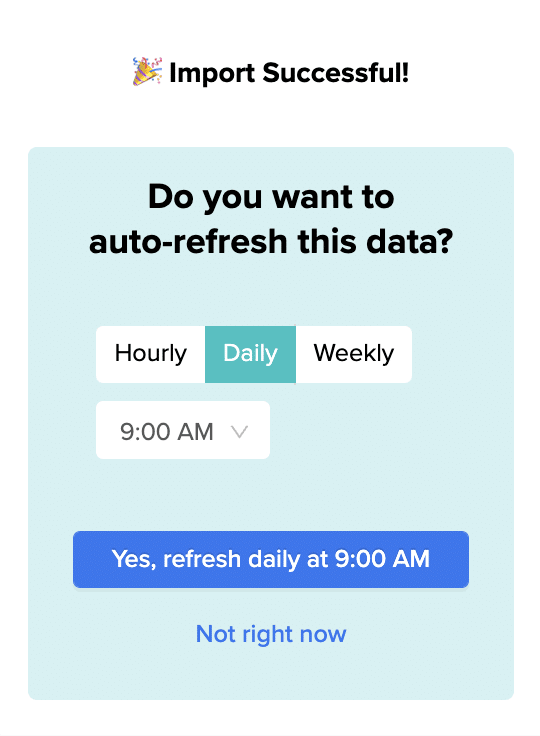
You can also auto-refresh your data by clicking ‘Set Refresh Schedule.’

Setting an auto-refresh schedule for data updates in Coefficient.

Set up an hourly, daily, or weekly auto-refresh schedule, and Coefficient will automatically update your data based on that time interval.

Customizing the template to match organizational needs in Coefficient's 'Settings' tab.

That means, going forward, Coefficient will automate your HubSpot data exports to Google Sheets for you.

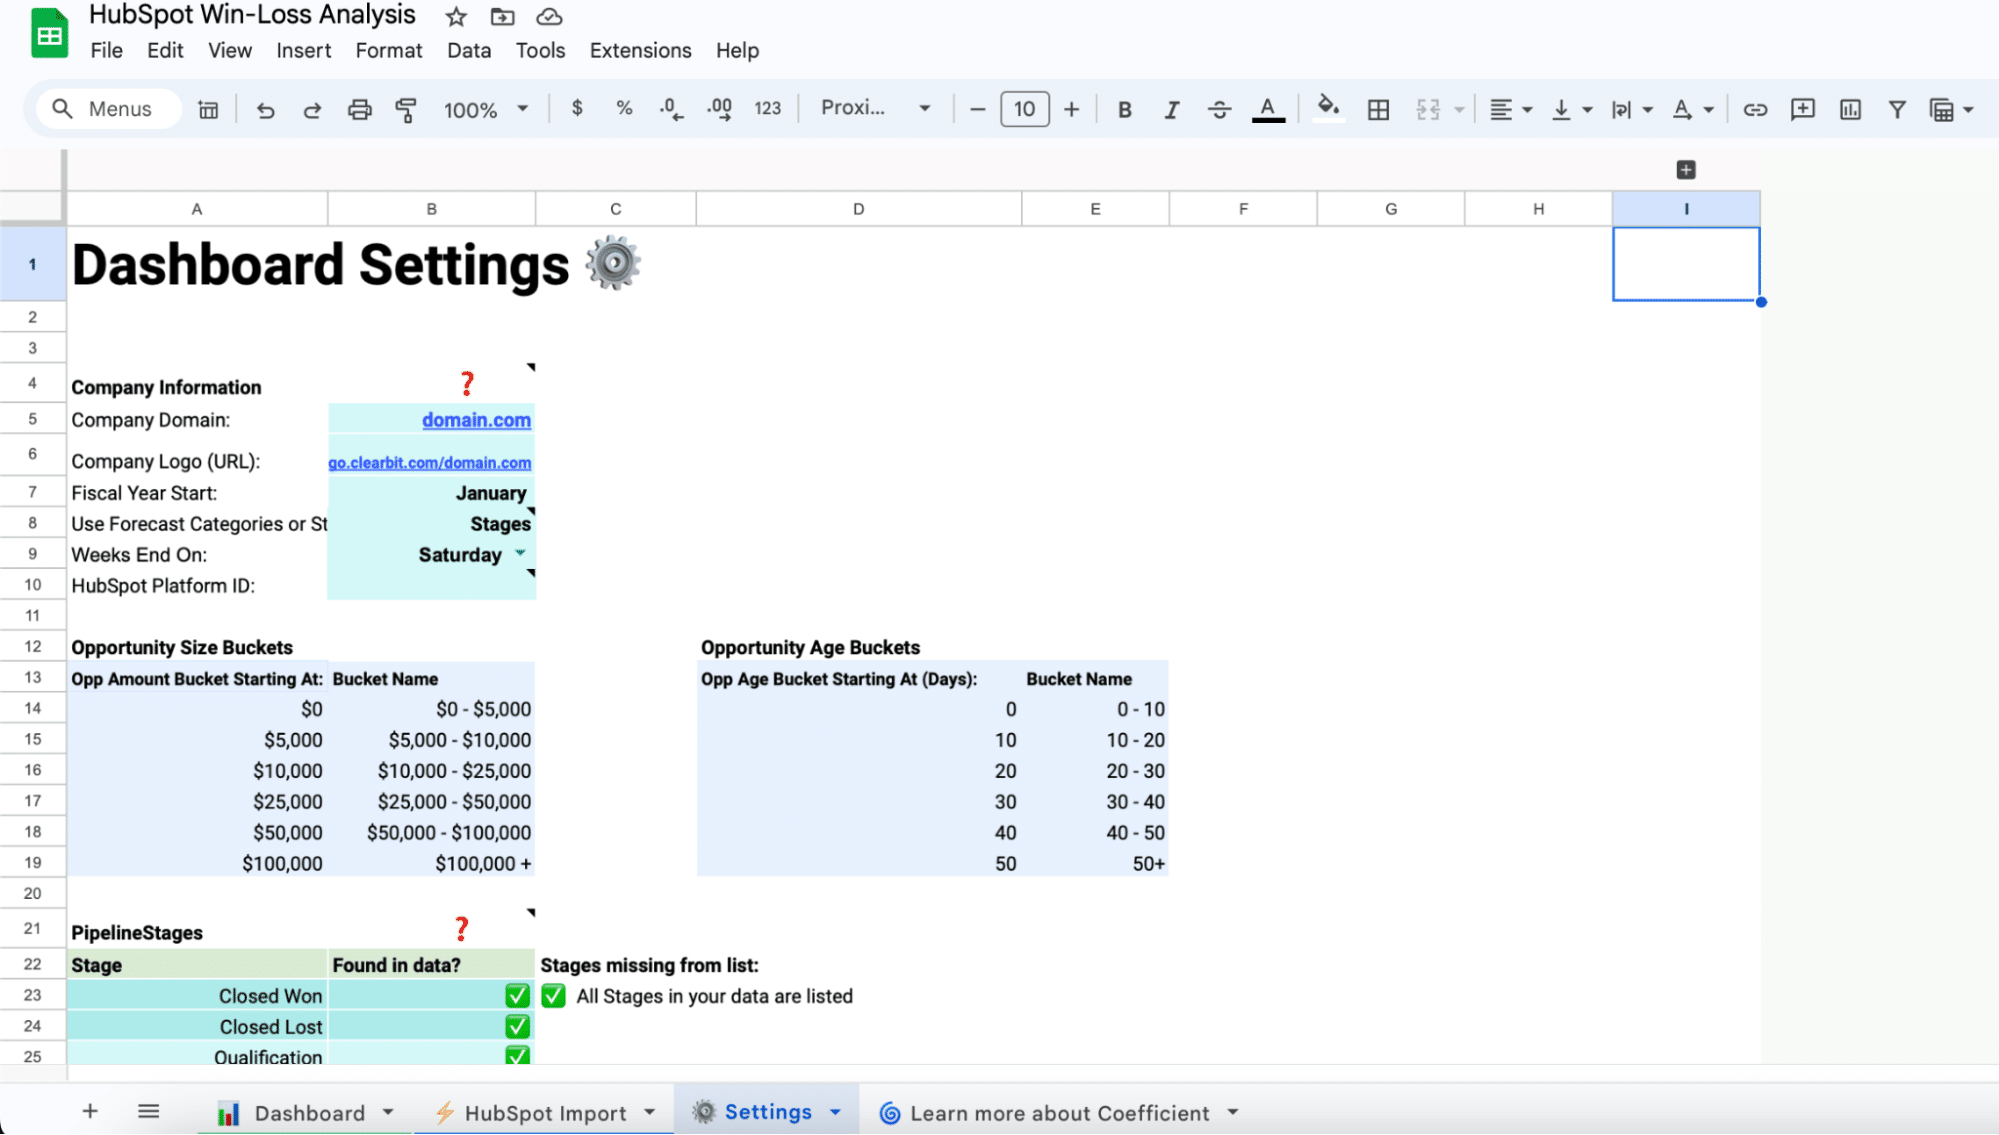
Step 3. Customize Your Dashboard

Tailor the template to your organization’s unique needs by navigating to the ‘Settings’ tab.

Setting deal size ranges for analysis in Coefficient settings.

You can customize by:

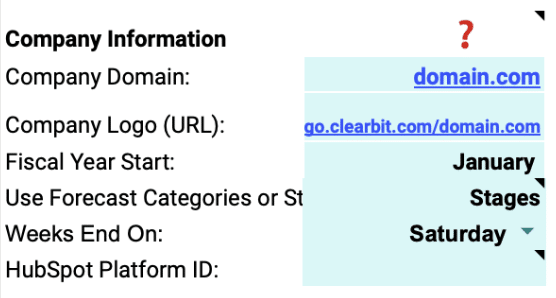
Company Information: Add your domain URL, logo, and fiscal year start date.
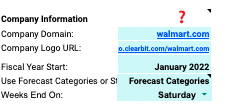
Configuring age ranges for tracking deal progression in Coefficient.

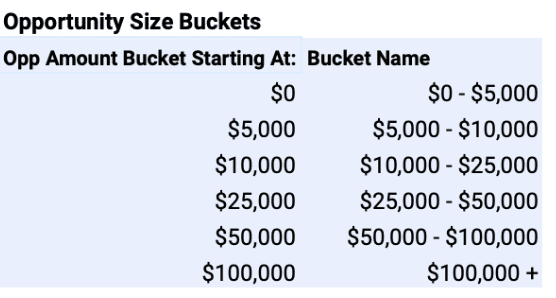
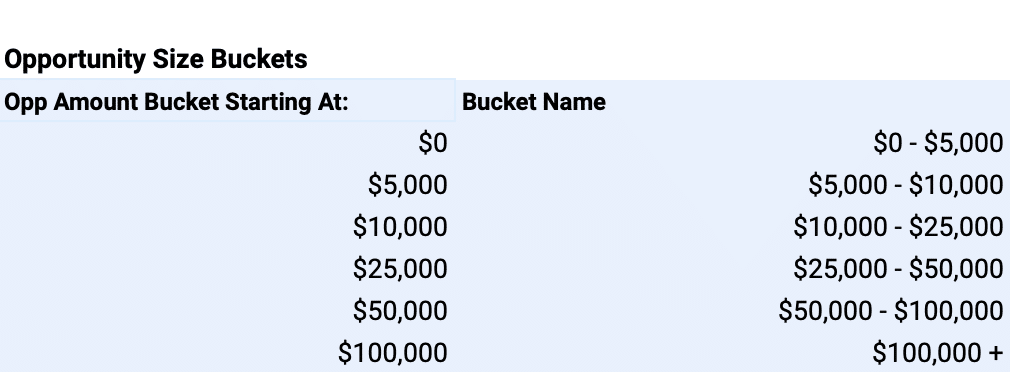
Opportunity Size Buckets: Define the deal size ranges for analysis.

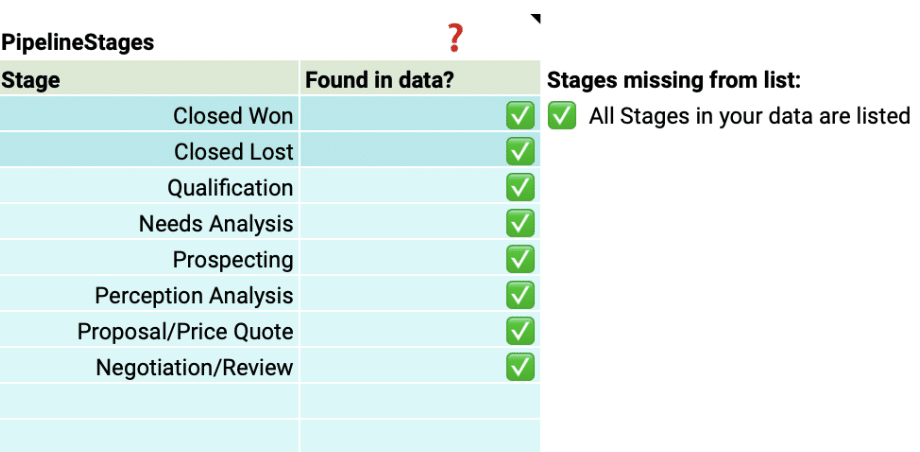
Adjusting Coefficient pipeline stages to align with HubSpot sales pipeline.

Opportunity Age Buckets: Set the age ranges for tracking deal progression.
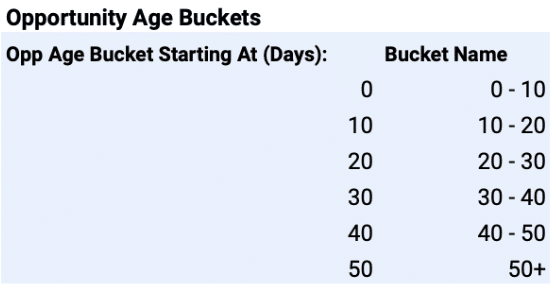
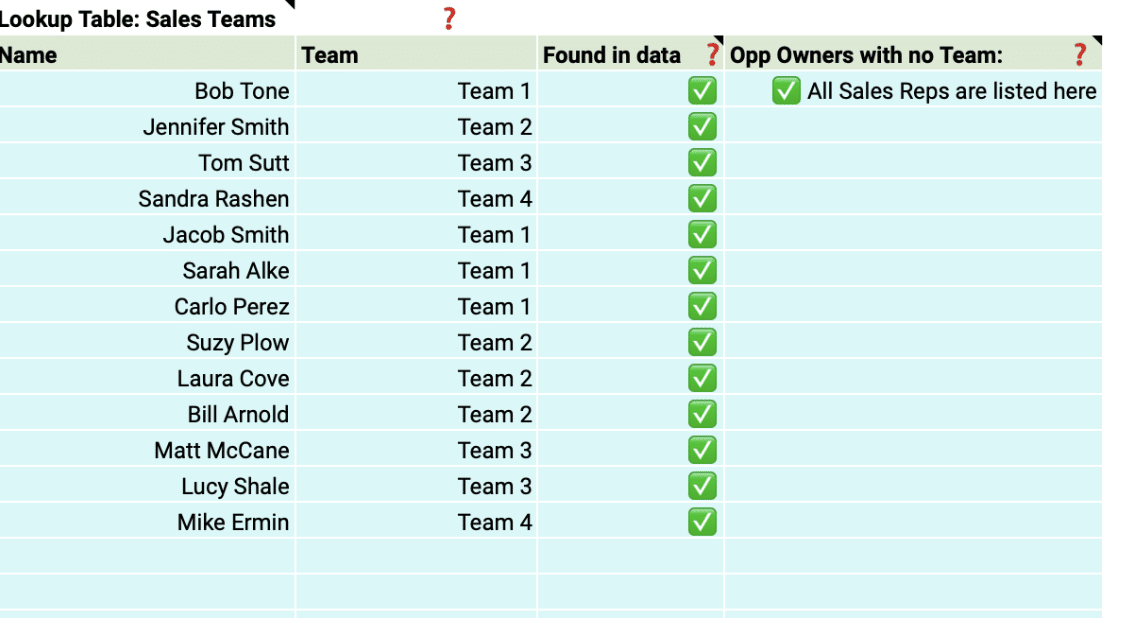
Adding sales team information in Coefficient for personalized dashboard insights.

Pipeline Stages: Match the stages to your HubSpot sales pipeline.

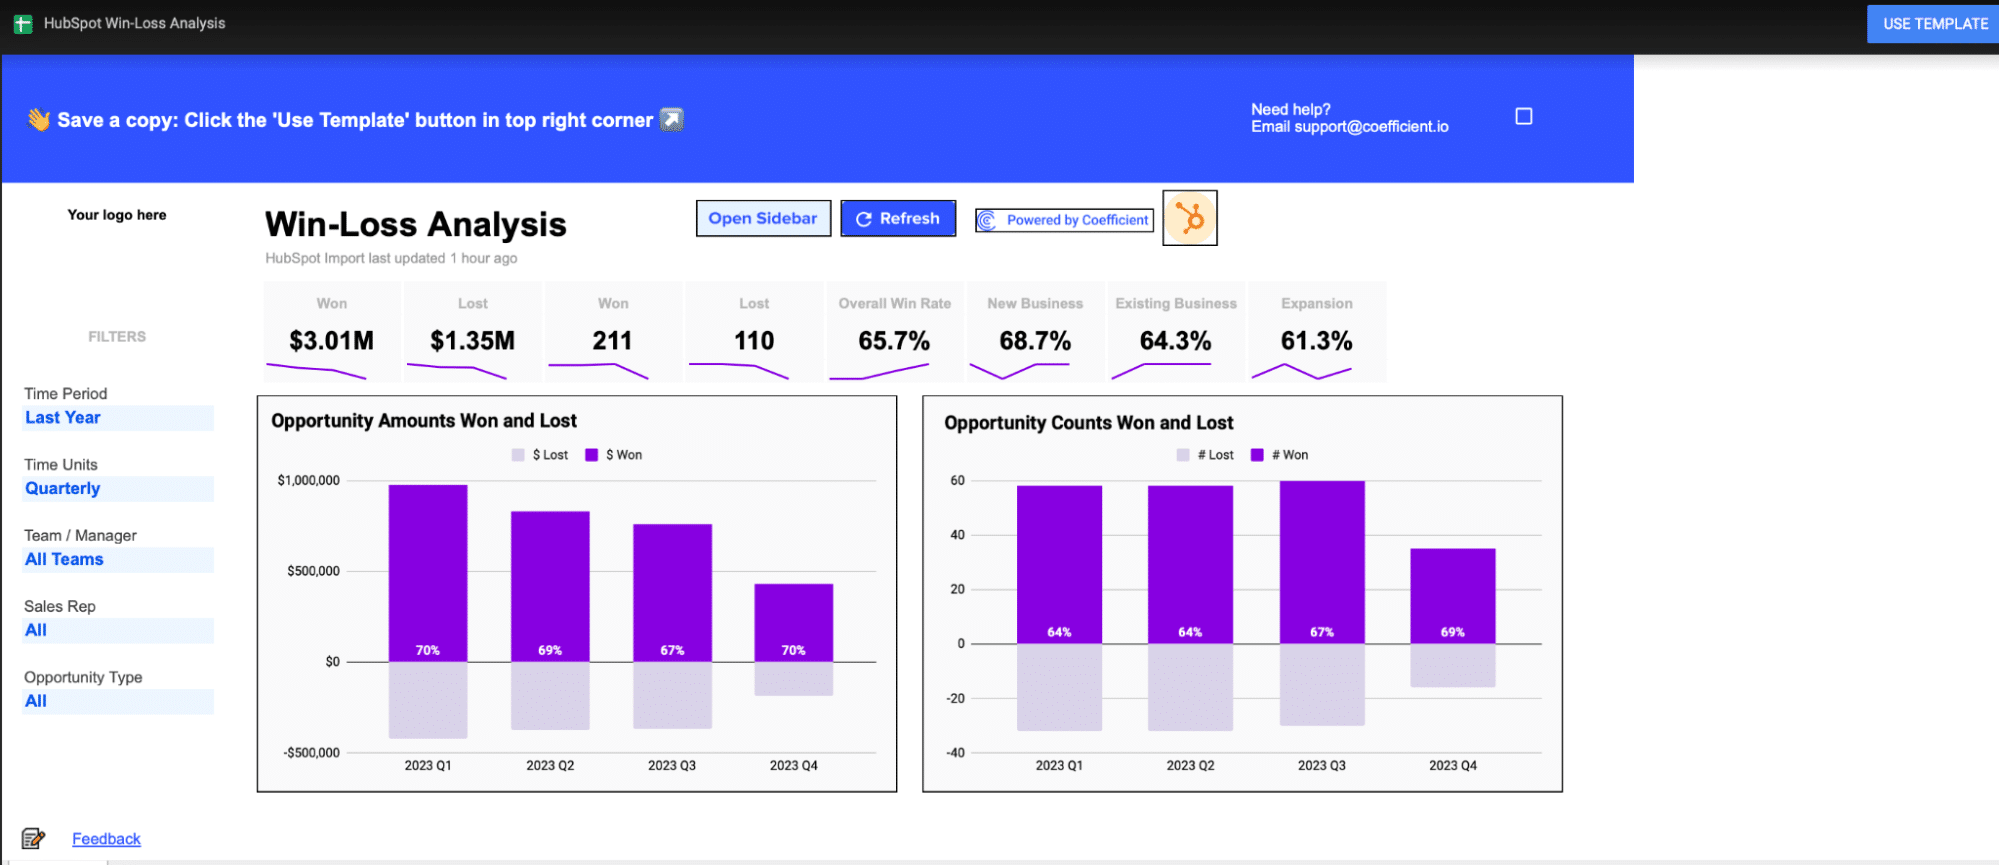
Analyzing win rate performance through key visualizations on the Win Loss Analysis Dashboard.

Team Members: Include details about your sales team for personalized insights.

Visual comparison of total value of won vs. lost deals in the dashboard.

With just a few simple customizations, you can transform the Win Loss Analysis Dashboard into a powerful tool tailored to your organization’s specific needs.

Deep Dive into the Win Rate Dashboard Template

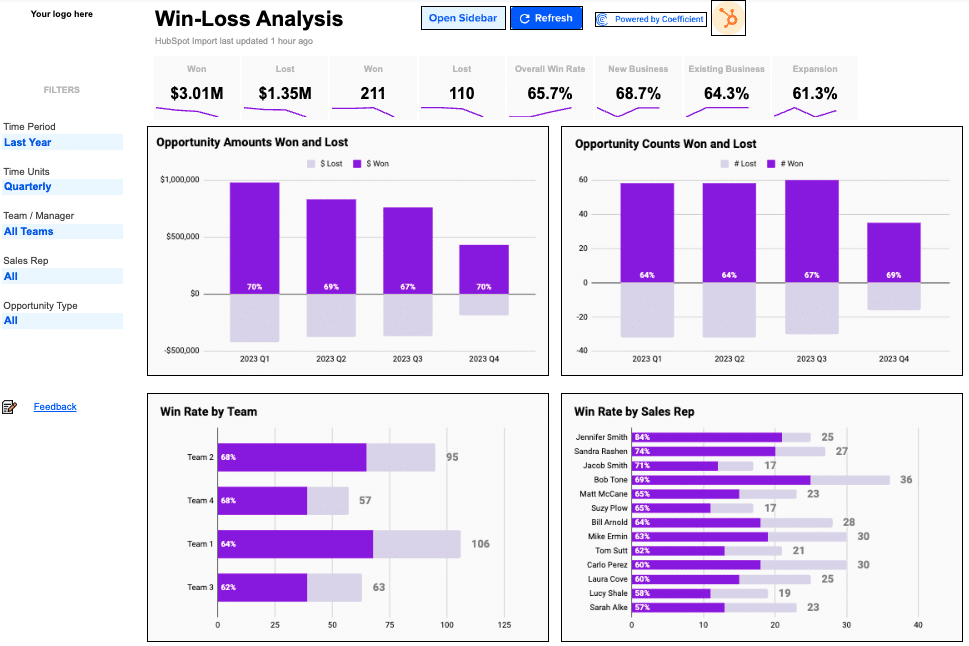
The Win Loss Analysis Dashboard provides a comprehensive view of your win rate performance. Key visualizations include:

 Breaking down performance metrics by team and sales representative.

Opportunity Amounts Won and Lost: Compare the total value of won and lost deals.

Displaying deals segmented by industry and lead source in the dashboard.

Opportunity Counts Won and Lost: See the number of deals won and lost over time.

There are also a wide range of graphs to help visualize Win Rate across a few dimensions to help identify performance patterns by:

Team and Sales Rep

Analyzing sales data by country and account source in the dashboard.

Industry and Lead

Dashboard view comparing deals by size bucket and age.

Country and Account Source

Examining details of recently lost deals to identify areas for improvement.

Opportunity Size Bucket and Opportunity Age

opportunity Size Bucket and Opportunity Age

Finally, the Win Rate dashboard allows you to review details of recently lost deals to identify improvement areas in a table beneath the graphs above.

viewing recently lost opportunities

Actionable Insights from Win Rate Analysis

Win rate data empowers you to make strategic decisions and optimize your sales approach:

  • Replicate successful strategies: If certain techniques, industries, or lead sources yield higher win rates, consider applying those approaches more broadly.
  • Adapt to market changes: Use real-time data to stay agile and responsive to market trends affecting your win rate.
  • Streamline sales processes: Identify bottlenecks or stages where deals often stall, and refine your sales process accordingly.

The Power of Live Data

Coefficient’s dashboard templates leverage real-time data, enabling you to:

  • Quickly spot and respond to changes in win rate trends
  • Make decisions based on the most current information
  • Tailor your analysis to your specific priorities and needs
  • Easily collaborate and share insights across your organization

Elevate Your Sales Performance

Mastering your win rate is essential for driving sales growth and improving overall performance.

Coefficient’s Win Loss Analysis Dashboard arms you with the tools and insights needed to make data-driven decisions and optimize your sales strategies.

Don’t wait – download the free Win Rate analysis dashboard template or sign up for Coefficient today and start boosting your sales performance!

Sales Velocity Tracking: How to Calculate and Track Overtime in Google Sheets

When looking at growing your sales, a couple of metrics jump out as obvious things that should be looked at: How many sales opportunities we’re generating, the size of those opportunities, how many opportunities we’re successfully closing, and how long it takes to close a deal.

All 4 of these metrics are pretty important on their own, but how do you measure them all in such a way that you can compare them directly? After all, any one of these metrics can be improved at the cost of the other, so how do we really show long-term progress?

Enter “Sales Velocity”, your dollar-per-day measure of performance, to help you optimize your sales lifecycle and strategy, and understand whether you’re really improving, or if you’re just sacrificing one metric for another!

What is sales velocity

At its core, Sales Velocity is a Dollar-per-Day measure of your sales lifecycle, and by dollar-per-day, I mean the final value is an estimate of the amount of money your business is bringing in based on:

  • The number of open opportunities
  • The average value of a won opportunity
  • The % of opportunities that are typically won
  • The average time to win

The basic formula for this looks something like

sales velocity calculation

Now it’s worth keeping in mind a couple of things:

First, the formula assumes that an opportunity is “Qualified”, meaning that it’s an opportunity that has been vetted and determined that it is a viable business opportunity.  Depending on how your company evaluates its business opportunities, this could be either any opportunity in Salesforce (if qualification happens before an opportunity is created) or from opportunities beyond a certain stage (if opportunities are qualified at a certain stage in the pipeline).

Second, outliers in your sales lifecycle like big spenders, or companies with smaller purses, could skew your results.  You may want to break these out into different categories so that one or two renewals for big clients don’t skew your data.

Third, the better your data, the more accurate your result.  So if your org has a bunch of old, qualified opportunities that are hanging out which no one intends to pursue, you’ll want to decide how to handle them.  If they’re stale, sales managers may have problems closing them, resulting in a lower win performance.  If they’re left open and ignored, you may expect a higher or lower $ per day.  You can also just close them, but you may lose out on a client who just needs some more warming up.

Fourth, changes in sales strategy can have significant impacts on the metric.  For example, correcting a loose qualification process may drastically change the number of “open opportunities”, and the launch of a new, killer product that begets reaching out mid-contract may drastically change the sales lifecycle, and thus the Sales Velocity.  For that reason, it’s important to understand important business events and filter our events in your data which may distract from any progress or shortfalls, at least until your business reaches a “new normal”.

Data needed to calculate sales velocity

So to build this report, we need a couple of things from Salesforce:

  1. The number of Open Opportunities – This one is pretty straightforward.  We just need all Opportunities where IsClosed is False.  We’ll just count those and then we’re done.  Just make sure to filter out any open, but stale opportunities
  2. Average Value of a Won Opportunity – This one is also pretty straightforward.  We just gather all open opportunities and average out the Amount field across all of them.  Just bear in mind that you may want to segment out your customers by size in order to ensure that big (or small) purchasers don’t throw off your results.
  3. % of Opportunities that are Won – We want to be careful with this one as well.  Changes in how opportunities are qualified could skew the percentage up or down.
  4. Average time to win is fairly easy to get.  For each won opportunity, we just want to see the number of days between the close date and then creation date.  Note: If you have a stage specifically for qualifying an opportunity, you may need a trigger or flow to record a date for when the opportunity is considered “qualified”, and use that date instead of the created date.

For our company, we’re going to look at the 3 months of data at a time, but we’ll review the data every month by utilizing reporting snapshots

Building your sales velocity tracker

First, let’s build our report.  You can either do that via a SOQL Lookup, an Existing Report, or by selecting objects and fields to import.  If you’re unsure how to proceed, you can review the documentation here for an example on how to set up a report: https://coefficient.io/salesforce-data-in-a-spreadsheet-without-exporting

I’ve already created a report for this in Salesforce for use in some dashboards, so let’s pull it down and see what we’ve got:

Now before you close that import window though, remember to do two things.  Set the refresh interval and the Snapshot interval:

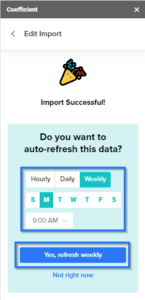
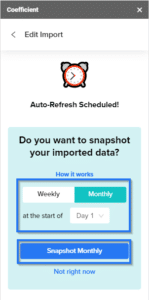
Daily or Weekly should be fine for the refresh interval, and we’ll snapshot our data on the first of every month (you can select any day)

If you make a mistake, or you need to go back and add snapshotting to an existing report, you can always open the Coefficient add-on on your workbook and click the edit button in the Refresh Schedule section

This will give us a snapshot of our data every month so we can see how our sales velocity changes.

To start with our current data, let’s look at our current sheet.  The first thing we needed was the number of open Opportunities.  Easy enough.

=COUNTIF(D3:D,“=0”)

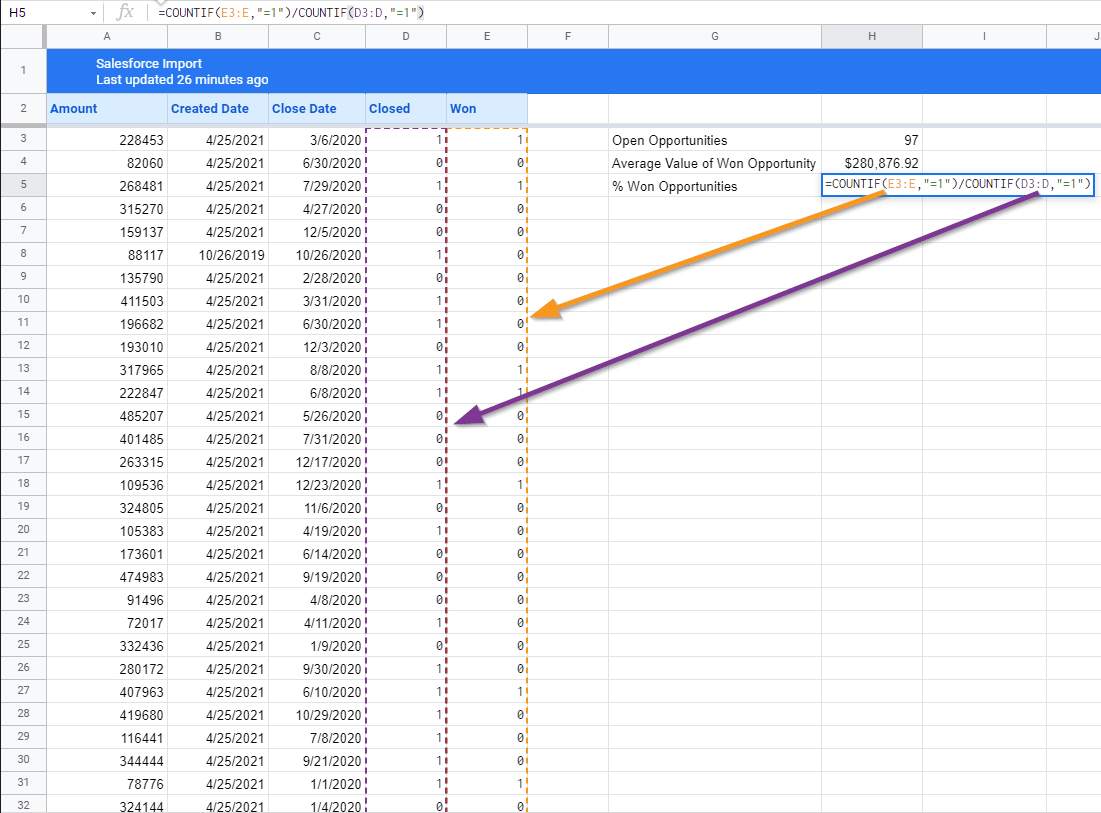
Coefficient is kind enough to not overwrite content next to the import on refresh, so we can just drop this code in an adjacent cell, such that this counts all open opportunities.  Since Booleans get brought over as 1 or 0, we can just exclude anything where Closed is equal to 0.  That means this count will also refresh when the data is refreshed from Salesforce!  Note as well that we’re using D3:D.  This starts at the 3rd cell in the D column and runs through the rest of the valid cells in the D column.  This makes it so that if the number of cells in the D column happens to change (eg. at a refresh we pull in a large number of new opportunities), we will still capture all of them in our calculation!

Next, we need Average Value of a Won Opportunity.  To do that, we can use a formula like this:

=AVERAGEIF(E3:E,“=1”,A3:A)

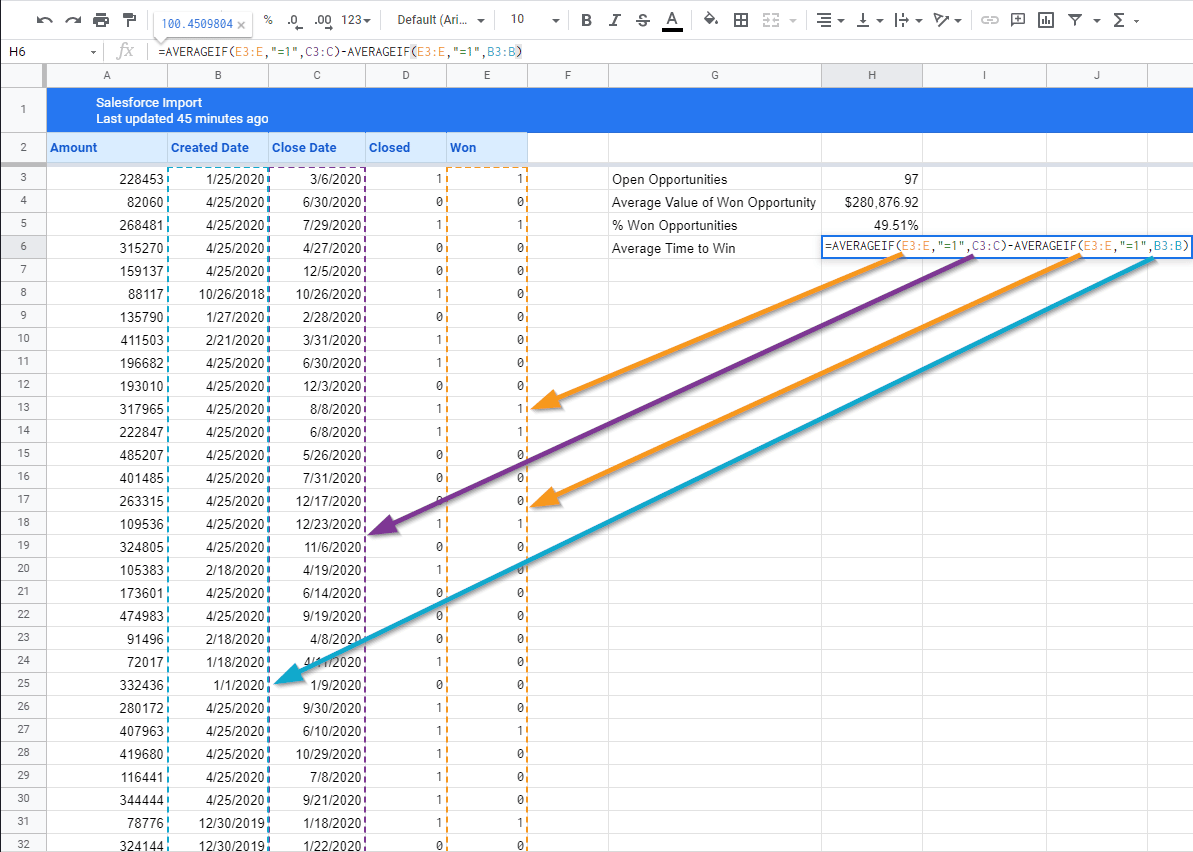
AVERAGEIF allows you to take an average of cells, but only those which meet certain criteria.  In this case, we’re only averaging those which are for won opportunities.  We do specify the range of cells under the Won column (using the same trick as last time), adding criteria requiring the cell to equal 1, and then specifying the purple range, which is the amount column for our imported opportunities.

For the percentage of won opportunities, we need something a little different.  Just kidding.  It’s more COUNTIFs.  You could technically do this by reusing the Open Opportunities value, but then you have to worry about parenthesis, and it just doesn’t look as clean (plus you would have dependent calculations which aren’t so ideal.

=COUNTIF(E3:E,“=1”)/COUNTIF(D3:D,“=1”)

Essentially we’re just counting the number of won opportunities and dividing that by the number of closed opportunities.  Make sure to reformat the field to a percentage to pretty things up!

The last metric we need for our sales velocity calculation is Average Time to Win.  Now a useful field here would be a Time to Close field which we can use to get the time an opportunity spent in-process.  Unfortunately, we don’t have one here, so we’re going to abuse how dates are stored, and get the average start date, the average close date, and subtract the two to get the same answer without having to create the new column in the spreadsheet or in the source report.  Be on the lookout for neat little tricks like this which you can use to make your spreadsheets require less maintenance!

=AVERAGEIF(E3:E,“=1”,C3:C)-AVERAGEIF(E3:E,“=1”,B3:B)

Since Dates are stored as numbers and then just presented in a date format, we can just average the start date and subtract it from the average close date.  We use AVERAGEIF to handle this in both cases, and just make sure we filter it down to only include Won opportunities.  AVERAGEIF works here because of the quality that dates are stored as numbers and that

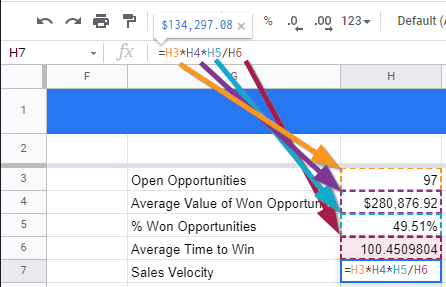
We’re in the home stretch!  Now we just need to calculate our Sales Velocity, using the formula from above:

Or in our Google Sheet, written as:

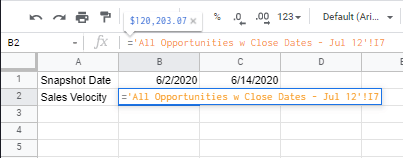
=H3*H4*H5/H6

calculating sales velocity in google sheets

Now that that’s done, we’ve got our Sales Velocity!  Let’s add just one more thing.  Since Coefficient now supports automatic snapshotting of our data, those formulas we added will actually carry through to the next snapshot… and the next one… and the next one, until we change or delete them!  So we can create a line graph showing the change of the data over time, and we can update it with minimal effort.

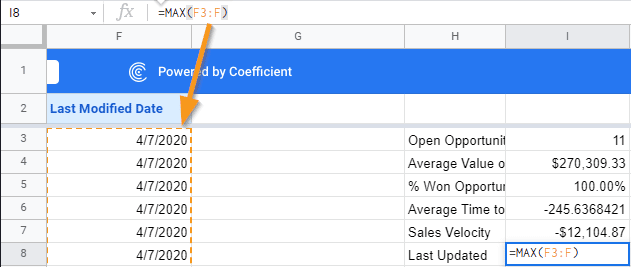
To automate the X-axis, we can add the Last Modified Date to our report and pull it into our Coefficient Report pull.  We’ll just use the Max function against our last modified Dates to get our X-Axis Value:

=MAX(F3:F)

Now the next time the report refreshes, the Last modified dates, and so will the Last Updated Date.  The Snapshots will also ensure that the Last Update date reflects the last updated date for the data in the snapshot.  So now we can begin building our next Dashboard with a line graph showing the progression of our new Sales Velocity!

Let’s add a tab to collect our data:

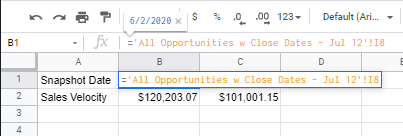
First, we’re going to pull in the snapshot dates.  Once for the import sheet, and one for each of the snapshots.  When we get a new snapshot, we’ll just add a column right before the import sheet and link the cell to it.

And again for the Sales Velocity Fields.  Feel free to do the same thing for any of the other metrics we generated if they’re useful in your reports!

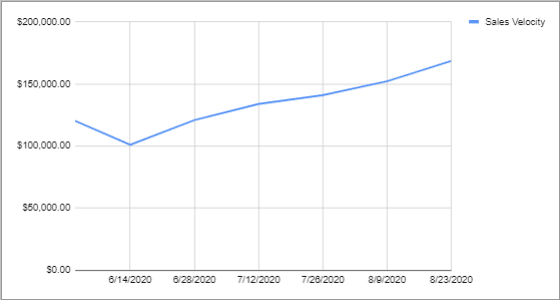
And after a couple of snapshots, you can generate a meaningful Sales Velocity graph for your teams!

sales velocity chart

Conclusion

Sales Velocity is a great metric to show how your team is pursuing impactful opportunities and pushing for greater efficiency.  As with all data points, however, you often need several different metrics to truly understand how your business is moving and to focus on the right things.  These metrics should cover the business as a whole, the impacts of important decisions, and individual performance to help each team member to find their own efficiencies. 

Try Coefficient for free today!

5 Sales Revenue Metrics to Measure Success in 2024 (With Templates)

Measuring the right metrics provides a clear view of your sales pipeline, identifies areas needing improvement, and helps forecast future performance.

According to a McKinsey study, companies that leverage sales analytics achieve sales growth rates 5-10% higher than those that don’t, highlighting the importance of data-driven decision-making in modern sales strategies.

In this post, we’ll share the 8 most critical sales revenue metrics to track, along with templates to help you get started.

Top 5 Sales Revenue Metrics for 2024

1. Sales vs Targets

Monitoring sales performance against predetermined targets is critical for ensuring that your team is on track to meet its goals. Regularly reviewing sales vs targets data can help you make proactive decisions to keep your team on track and achieve your goals.

 By tracking sales vs targets, you can:

  • Identify performance gaps and take corrective action
  • Adjust strategies based on real-time performance data
  • Celebrate successes and recognize top performers

How to Calculate

Sales vs targets is calculated by dividing the actual sales by the target sales for a given period.

How Coefficient’s Sales vs Targets Template Can Help

Coefficient’s Sales vs Targets Template makes it easy for sales managers to monitor team performance in real-time by:

  • Integrating live data from Salesforce, eliminating manual data entry
  • Visualizing performance against targets, enabling quick identification of gaps
  • Allowing you to set custom alerts for when teams or reps are falling behind or exceeding targets, ensuring timely action

Gain real-time visibility into your team’s performance with Coefficient’s Sales vs Targets template.

sales to target revenue

2. Opportunity History

Tracking the progression of opportunities through the sales funnel is essential for understanding the health of your pipeline. Analyzing opportunity history data can reveal valuable insights into the effectiveness of your sales processes and help you make improvements to drive better results.

By monitoring opportunity history, you can:

  • Identify bottlenecks and take corrective action
  • Forecast future sales performance more accurately
  • Optimize your sales processes based on data-driven insights

How to Calculate

Opportunity history is measured by tracking the number of opportunities that move from one stage to another over a given period.

How Coefficient’s Opportunity History Template Can Help

Coefficient’s Opportunity History Template streamlines the process of monitoring this critical metric for sales operations teams by:

  • Integrating live data from Salesforce, providing an always up-to-date view of the pipeline
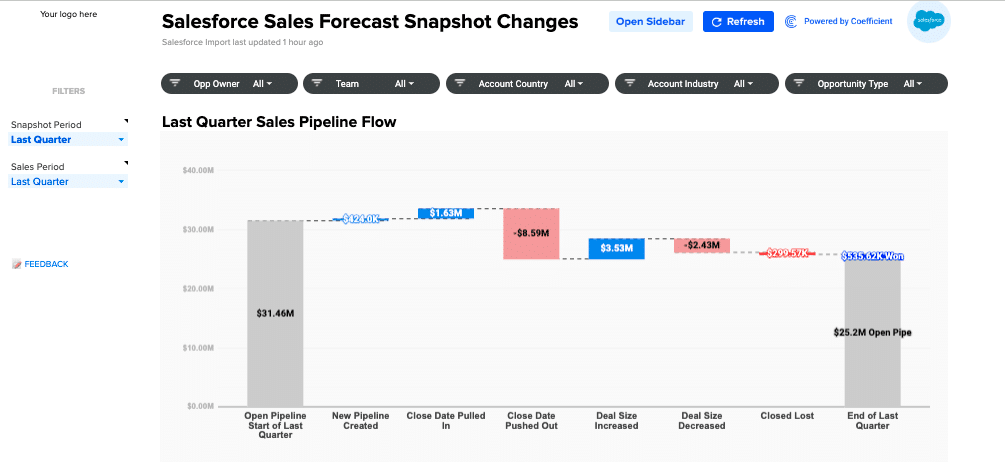
  • Visualizing the progression of opportunities through the funnel, highlighting key trends
  • Identifying stages where opportunities are progressing smoothly or getting stuck, enabling targeted process improvements

Optimize your sales funnel with Coefficient’s Opportunity History template.

sales opportunity history metrics

3. Lead Velocity

Lead velocity measures the growth of your qualified leads over time.

By tracking this metric, you can:

  • Assess the effectiveness of your lead generation strategies
  • Forecast future pipeline growth
  • Identify trends in lead volume and quality

How to Calculate

Lead velocity is calculated by comparing the number of qualified leads generated in a given period to the number generated in the previous period.

How Coefficient’s Lead Velocity Template Can Help

Coefficient’s Lead Velocity Template makes it easy for marketing teams to track and analyze this key metric by:

  • Providing a pre-built formula for calculating lead velocity, saving time and ensuring accuracy
  • Allowing you to input lead data directly into the template, centralizing your data
  • Visualizing lead velocity trends over time, enabling quick identification of issues or opportunities

Ensure a healthy pipeline with Coefficient’s Lead Velocity template.

sales lead velocity rate metric

4. Win-Loss Analysis

Conducting win-loss analysis helps you understand the factors that influence your sales outcomes and identify areas for improvement. Regularly conducting win-loss analysis provides valuable insights that sales enablement teams can use to refine messaging, train reps, and improve overall sales effectiveness.

By tracking this metric, you can:

  • Identify the strategies and tactics that lead to closed-won deals
  • Address the factors contributing to lost opportunities
  • Optimize your sales approach to increase win rates

How to Calculate

Win-loss analysis involves analyzing closed-won and closed-lost opportunities to identify the key factors that influenced each outcome.

How Coefficient’s Win-Loss Analysis Template Can Help

Coefficient’s Win-Loss Analysis Template simplifies the process of conducting this critical analysis for sales enablement teams by:

  • Integrating live data from HubSpot, eliminating manual data gathering
  • Categorizing won and lost deals based on key factors, revealing patterns and trends
  • Visualizing win-loss trends over time, enabling identification of improvement areas

Gain actionable insights with Coefficient’s Win-Loss Analysis template.

sales win loss metrics

5. Monthly Recurring Revenue (MRR) Growth Rate

MRR growth rate measures the month-over-month increase in recurring revenue.  Monitoring MRR growth rate is crucial for finance teams to ensure the long-term viability and success of the business.

By tracking this metric, you can:

  • Assess the health and growth of your subscription-based business
  • Forecast future revenue growth
  • Identify trends in customer acquisition and retention

How to Calculate

MRR growth rate is calculated by comparing the MRR at the end of the current month to the MRR at the end of the previous month.

How Coefficient’s MRR Growth Rate Template Can Help

Coefficient’s MRR Growth Rate Template streamlines the process of tracking and analyzing this key metric for finance teams by:

  • Providing a pre-built formula for calculating MRR growth rate, ensuring accuracy
  • Allowing you to input MRR data directly into the template, centralizing your financial data
  • Visualizing MRR growth trends over time, enabling quick identification of issues or opportunities

Track the health of your recurring revenue with Coefficient’s MRR Growth Rate template.

mrr growth rate metrics

Advantages of Integrating Live Data From Various Systems into a Single Dashboard

Integrating live data from various platforms into a single dashboard offers numerous advantages for sales teams:

  • Centralized data: Consolidate data from multiple sources, providing a single source of truth for sales performance.
  • Real-time insights: Access up-to-date information, enabling quick decision-making and agile strategizing.
  • Time savings: Automate data collection and analysis, freeing up time for more strategic initiatives.

Coefficient’s pre-built dashboard templates make it easy to integrate live data from various systems, with customization options to suit your unique needs.

How Jebbit Streamlined Sales and Revenue

Operations with Coefficient

By adopting Coefficient, Jebbit streamlined their sales commission process, eliminating hours of manual work and providing their sales team with real-time insights and a comprehensive view of their commissions. Coefficient’s support for historical Salesforce data also enabled Jebbit to craft more accurate sales forecasts and respond promptly to leadership requests.

“Coefficient saved us hours upon hours of work,” said Rachel Golden, VP of Finance at Jebbit. “There’s no manual back-and-forth with salespeople about commissions anymore. But we haven’t just saved tons of time. We’ve also been able to offer our team better data and more transparency.”

Read the full story to see how Jebbit used Coefficient to streamline their sales operations.

Start Tracking the Sales Revenue Metrics That Matter

In 2024, the most successful sales teams will be those that closely track their key revenue metrics.

By focusing on the 8 metrics we’ve covered and using Coefficient’s templates, you can gain the insights you need to make smart decisions and grow your business. Coefficient’s templates make it easy to track your most important sales metrics, with live data from your existing tools and customization options to fit your unique needs.

Ready to take your sales revenue tracking to the next level? Start using Coefficient for free today. 

Quota Attainment: How to Measure in 2024 (With Template)

Achieving and surpassing sales quotas is critical, but understanding and optimizing quota attainment can be complex. Sales operations and leadership teams often struggle with manual data consolidation and the need for real-time insights to drive strategies.

Coefficient’s Quota Attainment Dashboard streamlines the process of calculating this vital metric, giving you actionable insights to excel in your sales operations.

Understanding Quota Attainment

Quota attainment measures the percentage of sales quota achieved by a salesperson or team over a specific period. It provides insight into individual and team performance, highlighting who is overperforming or underperforming against their sales objectives.

High quota attainment rates indicate effective sales strategies and execution, while lower rates may signal misaligned quotas, market challenges, or areas where additional support is needed.

Why Quota Attainment Matters:

  1. Aligns performance and compensation, fostering accountability and motivation
  2. Guides strategic decisions on resource allocation, territories, and forecasting
  3. Reveals patterns and bottlenecks, helping streamline sales operations

Factors Affecting Quota Attainment:

  • Industry dynamics and varying sales cycles
  • Effectiveness of sales strategies (inbound, outbound, account-based)
  • Market conditions (economic trends, competition, demand shifts)
  • Organizational changes (restructuring, product launches, strategic shifts)

How to Calculate Quota Attainment

To calculate quota attainment, use this easy formula:

Quota attainment: (Actual Sales / Sales Quota) x 100

  • Actual Sales: The revenue a sales representative or team generates in a given period.
  • Quota: The target revenue set for that representative or team in the same period.

Using Coefficient to Calculate Quota Attainment

Coefficient’s Sales Opportunity Dashboard for Google Sheets makes it easy to track and analyze your team’s quota attainment.

Here’s a quick tutorial on how to use it:

Step 1: Download the (Free) Quota Attainment Dashboard

To start, head to Coefficient.io.

Enter your work email in the box and click ‘Get Free Template.’ 

Inputting a work email to download Quota Attainment Dashboard template.

You can save the template to your Google account by clicking the ‘Use Template’ button at the top right corner of your screen.

Saving the Quota Attainment Dashboard template to a Google account.

Coefficient will open in a new spreadsheet.

Viewing the Quota Attainment Dashboard in a new Coefficient spreadsheet.

If this is your first time using Coefficient, you’ll need to add it as an add-on to Google Sheets. Click â€˜Add to Sheets’ to continue.

Adding Coefficient to Google Sheets as an add-on for the first time.

Hit the â€˜Install’ button and follow the prompts to complete the installation.
Completing the installation of the Coefficient add-on in Google Sheets.

Step 2: Connect Coefficient to Salesforce

After installation is complete, click â€˜Done’ to return to your spreadsheet.

Returning to the spreadsheet after successfully installing Coefficient.

Click ‘Connect to Salesforce’ from the Coefficient menu on the right-hand side of your spreadsheet.

Initiating Salesforce connection from Coefficient's menu in Google Sheets.

Follow the prompts to authorize Coefficient to yoru Salesforce account.

Completing Salesforce account authorization via Coefficient.

If successful, you’ll see the following notification at the top of your spreadsheet.

Viewing Salesforce connection success notification in Google Sheets with Coefficient.

To update your data, navigate to the ‘Salesforce Import’ tab of your spreadsheet and click ‘Refresh.’

Updating Salesforce data in Coefficient by refreshing the 'Salesforce Import' tab.

You can also auto-refresh your data by clicking ‘Set Refresh Schedule.’

Setting an auto-refresh schedule for Salesforce data in Coefficient.

Set up an hourly, daily, or weekly auto-refresh schedule, and Coefficient will automatically update your data based on that time interval.

Automating Salesforce data exports to Google Sheets with Coefficient.

That means, going forward, Coefficient will automate your Salesforce data exports to Google Sheets for you.

Step 3. Customize Your Dashboard

Tailor the template to your organization’s unique needs by navigating to the ‘Settings’ tab.

You can customize by:

Company Information: Add your domain URL, logo, and fiscal year start date.

Tailoring the Coefficient dashboard to organizational needs in the 'Settings' tab.

Opportunity Size Buckets: Define the deal size ranges for analysis.

Setting deal sizes for analysis in Coefficient's Quota Attainment Dashboard.

Pipeline Stages: Match the stages to your HubSpot sales pipeline.

Adjusting the dashboard's pipeline stages to match HubSpot sales pipeline.

Team Members: Include details about your sales team for personalized insights.

Adding sales team information for personalized insights on the dashboard.

With just a few simple customizations, you can transform the Sales Opportunity Dashboard into a powerful tool tailored to your organization’s specific needs.

Deep Dive into the Quota Attainment Template

The Sales Opportunity Dashboard provides a comprehensive view of your quota attainment and so much more.

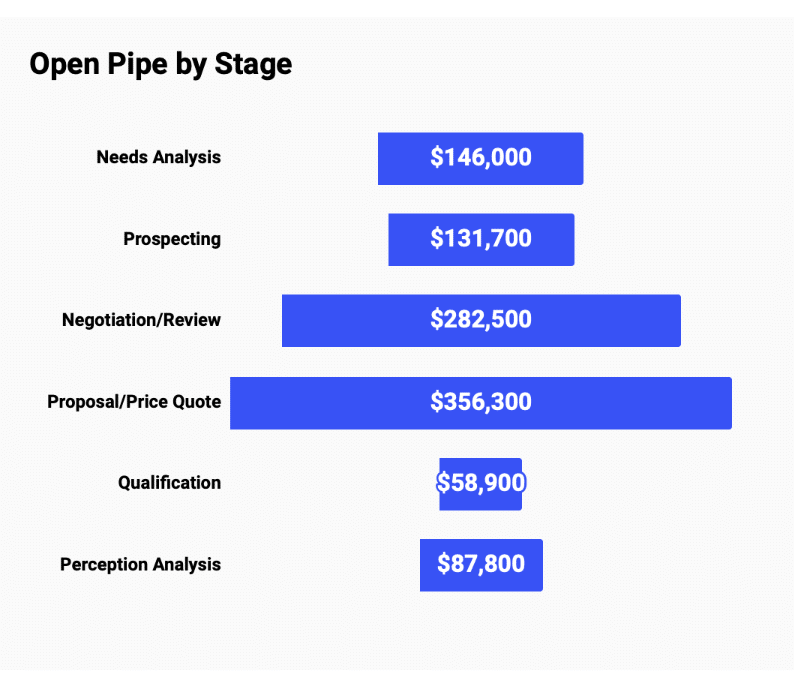
The Open Pipe by Stage chart breaks down the value of your open pipeline by each stage of your sales process. This allows you to quickly identify where the majority of your pipeline value lies and which stages may require more attention or resources to move deals forward.

Visualizing open pipeline distribution by sales stages on the dashboard.

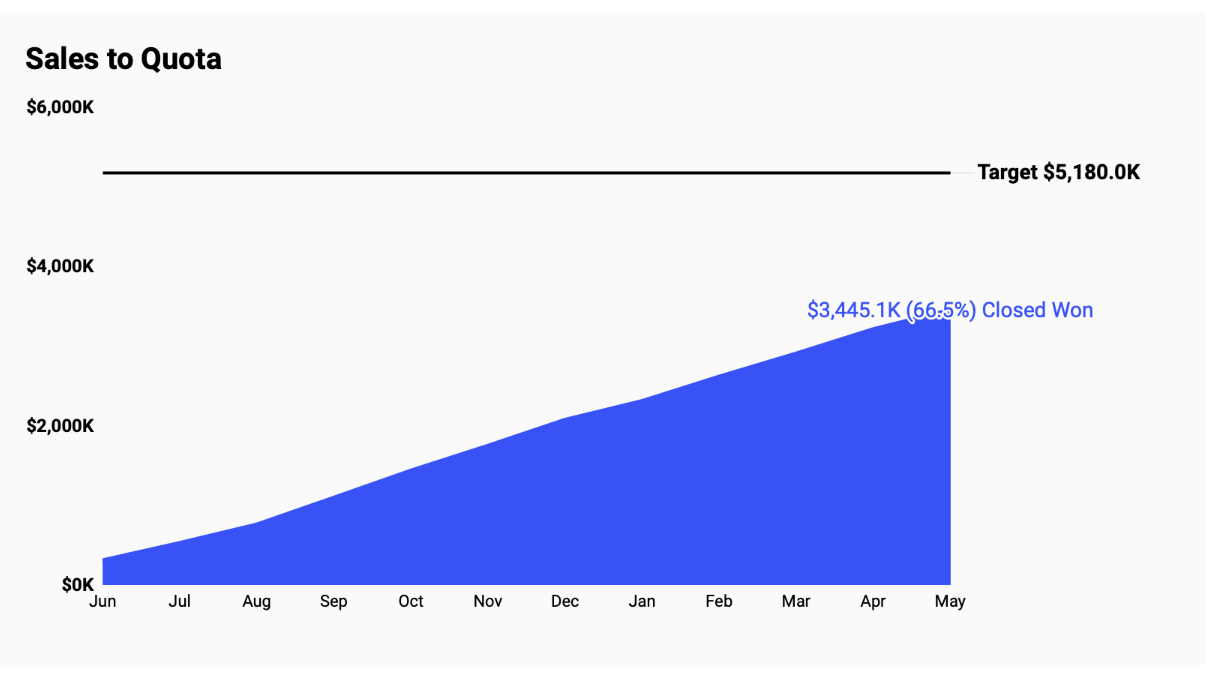
The Sales to Quota graph shows your actual sales performance against your quota over time. This visualization helps you track your progress towards hitting your sales targets, identify trends, and make data-driven decisions to optimize your sales strategies.

Graph showing sales performance compared to quotas over time on the dashboard.

The Key Metrics by Month table provides a detailed overview of your key sales metrics, such as quota, closed won, percentage to quota, and pipeline created, on a monthly basis. This granular data allows you to analyze your performance over time, spot trends, and identify areas for improvement.

Monthly breakdown of sales metrics including quota attainment in the dashboard table.

The Opportunity List table gives you a comprehensive view of all your opportunities, including key details such as stage, amount, close date, and next steps. This table enables you to dive into the specifics of each deal, prioritize your efforts, and ensure nothing falls through the cracks.

Comprehensive view of sales opportunities detailing stages, amounts, and dates on the dashboard.

Actionable Insights from Quota Attainment Analysis

Quota attainment data empowers you to make strategic decisions and optimize your sales performance:

  • Identify top performers: Recognize and learn from the strategies of reps consistently exceeding their quotas, and share their best practices with the team.
  • Provide targeted coaching: Offer personalized support and training to reps struggling to meet their quotas, addressing specific areas for improvement.
  • Align territories and quotas: Ensure that quotas are fair and achievable by analyzing historical performance data and making adjustments as needed.

The Power of Live Data

Coefficient’s dashboard templates leverage real-time data, enabling you to:

  • Quickly spot and respond to changes in quota attainment trends
  • Make decisions based on the most current information
  • Tailor your analysis to your specific priorities and needs
  • Easily collaborate and share insights across your organization

Elevate Your Sales Performance

Mastering your quota attainment is essential for driving sales growth and improving overall performance.

Coefficient’s Quota Attainment Dashboard arms you with the tools and insights needed to make data-driven decisions and optimize your sales strategies.

Don’t wait – download the free uota Attainment Dashboard Template or sign up for Coefficient today and start boosting your sales performance!

Chart Your Path to Quota Attainment Mastery

Embark on a journey towards strategic excellence in sales operations with the Quota Attainment Dashboard Template or sign up for Coefficient today .  

Top 10 Sales Metrics to Track in 2024

In the fast-paced world of sales, tracking the right metrics is crucial for making data-driven decisions and optimizing your team’s performance. However, with so much data scattered across various systems, it can be challenging to get a clear, real-time view of your key performance indicators (KPIs).

That’s where Coefficient comes in, offering pre-built spreadsheet dashboard templates that integrate live data from your CRM and other platforms.

 In this blog post, we’ll explore the top 10 sales metrics every company should track in 2024 and how Coefficient’s templates can help you streamline the process.

Top 10 Critical Sales Metrics to Track

#1 Opportunity History

Tracking the progression of opportunities through the sales funnel is essential for understanding the health of your pipeline. By monitoring opportunity history, you can:

  • Identify bottlenecks: Pinpoint stages where opportunities stall and take corrective action.
  • Forecast accurately: Use historical data to predict future sales performance.
  • Optimize sales processes: Continuously improve your sales approach based on data-driven insights.

How to Calculate: Measure the number of opportunities that move from one stage to another over a given period.

How Coefficient’s Opportunity History Template Can Help

Coefficient's Opportunity History template for sales teams

Coefficient templates offer a streamlined approach to monitoring opportunity history by integrating real-time data, enabling you to make informed adjustments promptly.

  • See What Works: Quickly identify stages where opportunities are progressing smoothly or getting stuck.
  • Make Better Decisions: Use opportunity history data to guide process improvements and resource allocation.
  • Customize Your Views: Create reports that make sense to you, so you can make smart decisions about your sales funnel.

Download the Opportunity History template and start optimizing your sales funnel today

#2 Revenue & Win Rates by Team and Rep

Measuring revenue and win rates at the team and individual levels helps you identify top performers and areas for improvement. This metric offers several benefits:

  • Performance benchmarking: Compare the performance of teams and reps against each other and industry standards.
  • Targeted coaching: Provide personalized training and support to help underperforming reps improve.
  • Resource allocation: Allocate resources and set quotas based on historical performance data.

How to Calculate: Revenue and win rates are calculated by dividing the total revenue or number of closed-won deals by the total number of opportunities for each team or rep.

How Coefficient’s Revenue & Win Rates by Team and Rep Template Can Help

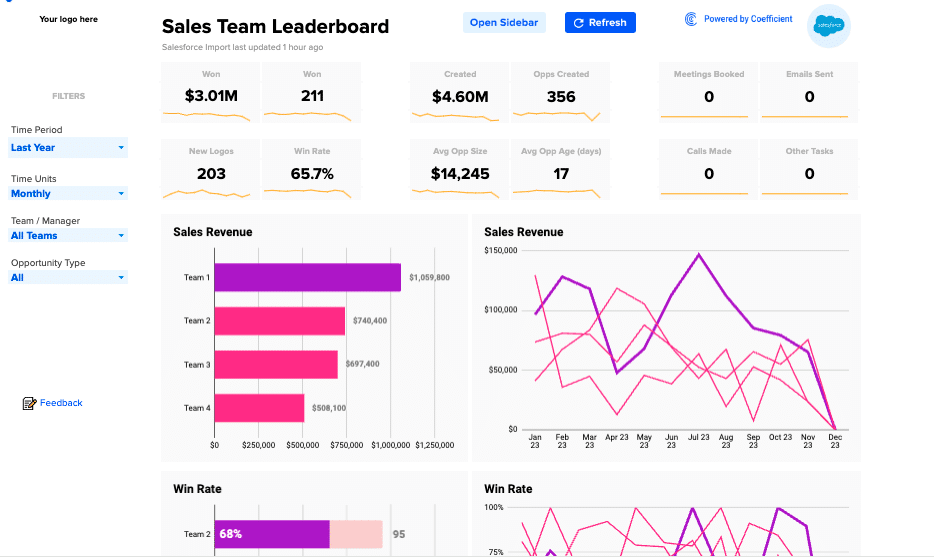
Coefficient's Revenue & Win Rates by Team and Rep template for sales teams

Coefficient facilitates easy analysis of revenue and win rate data for your sales metrics dashboard, allowing for swift comparison and strategic enhancements based on live performance insights.

  • Know What Converts: See clearly which teams and reps are driving the most revenue and closed-won deals.
  • Keep Getting Better: Use real data to identify top performers and share their best practices across the team.
  • See What’s Working: Identify the most effective sales strategies and tactics to focus your efforts.

Get started with the Revenue & Win Rates by Team and Rep template and unlock valuable insights.

#3 Sales to Target

Monitoring sales performance against predetermined targets is critical for ensuring that your team is on track to meet its goals. By tracking sales to target, you can:

  • Identify performance gaps: Quickly spot teams or reps who are falling behind and take corrective action.
  • Adjust strategies: Modify sales strategies and tactics based on real-time performance data.
  • Celebrate successes: Recognize and reward teams and reps who consistently meet or exceed their targets.

How to Calculate: Sales to target is calculated by dividing the actual sales by the target sales for a given period.

How Coefficient’s Sales to Target Template Can Help

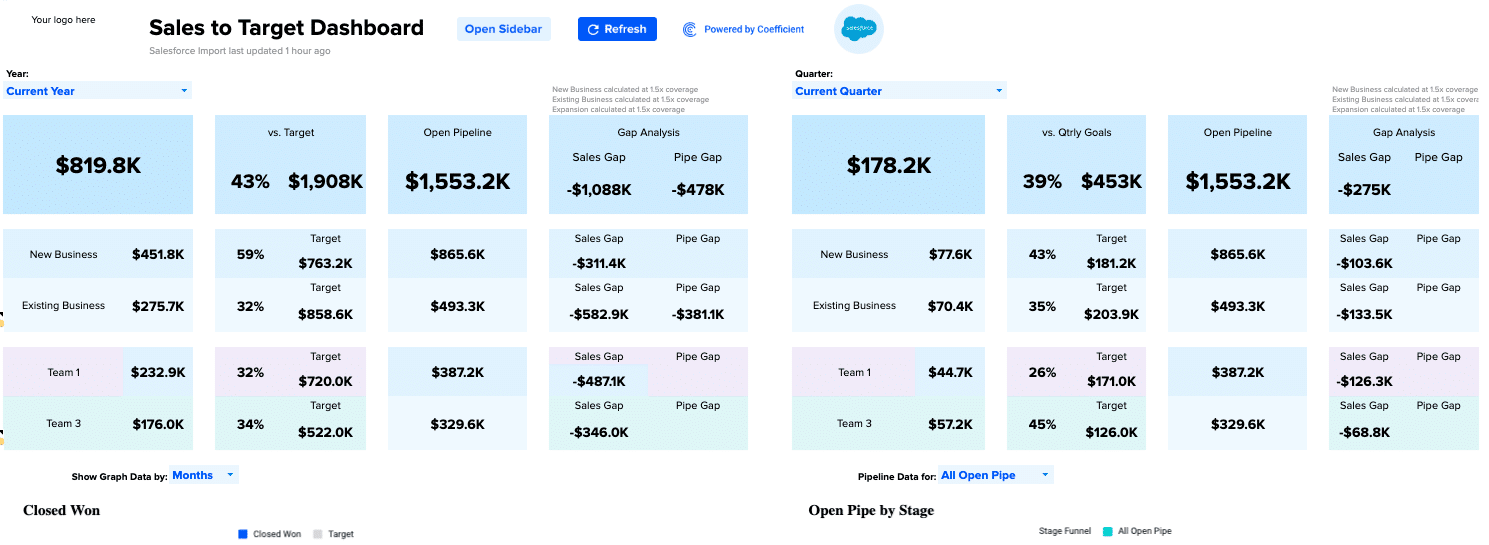
Coefficient's Sales to Target template for sales teams

Coefficient’s Sales to Target template makes it easy to monitor this metric, with live data integration and customizable dashboards.

  • Track Progress: See how your team is performing against targets in real-time.
  • Identify Trends: Analyze historical data to identify patterns and adjust strategies accordingly.
  • Customize Alerts: Set up custom alerts to notify you when teams or reps are falling behind or exceeding targets.

Start tracking your sales performance against targets with Coefficient’s Sales to Target template.

#4 Open Pipe

Open pipeline represents the total value of all open opportunities in your sales funnel. Monitoring this metric helps you:

  • Forecast revenue: Use open pipe data to predict future revenue and make informed business decisions.
  • Identify risk factors: Assess the health of your pipeline and identify potential risks, such as a lack of high-value opportunities.
  • Allocate resources: Ensure that your sales team is focusing on the most promising opportunities.

How to Calculate: Open pipe is calculated by summing the value of all open opportunities in your CRM.

How Coefficient’s Open Pipe Template Can Help

Coefficient's Open Pipe template for sales teams

Coefficient’s Open Pipe template simplifies this process, providing real-time visibility into your pipeline value.

  • Monitor Pipeline Health: Quickly assess the value and distribution of open opportunities in your funnel.
  • Forecast Accurately: Use historical open pipe data to predict future revenue and resource needs.
  • Identify Risks: Spot potential risks, such as a lack of high-value opportunities or an unbalanced pipeline.

Gain a clear view of your open pipeline with Coefficient’s Open Pipe template.

#5 Total Contract Value

Total Contract Value (TCV) represents the total revenue generated from a customer over the lifetime of their contract, one of the key sales metrics every team member should be aware of, even your reps. Tracking TCV helps you:

  • Identify high-value customers: Focus on acquiring and retaining customers with the highest lifetime value.
  • Optimize pricing strategies: Use TCV data to inform pricing decisions and maximize revenue.
  • Forecast long-term revenue: Project future revenue based on the expected lifetime value of your customer base.

How to Calculate: TCV is calculated by multiplying the average contract value by the average customer lifetime.

How Coefficient’s Total Contract Value Template Can Help

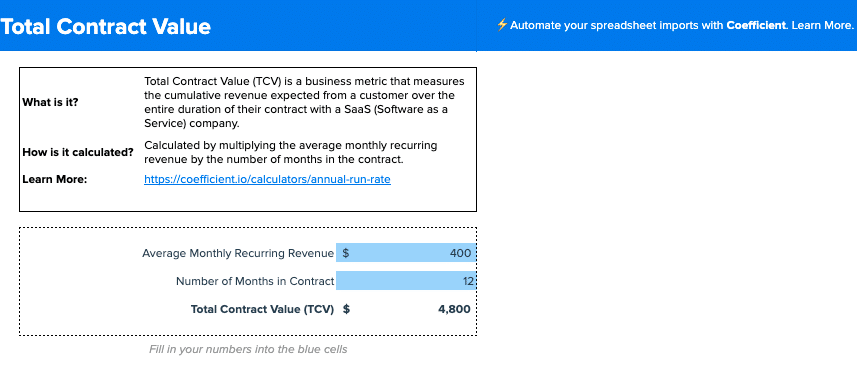
Coefficient's Total Contract Value template for sales teams

Coefficient’s Total Contract Value template makes it easy to track and analyze this critical metric.

  • Identify Top Customers: Quickly identify customers with the highest lifetime value and prioritize retention efforts.
  • Optimize Pricing: Use TCV data to inform pricing strategies and maximize revenue.
  • Forecast Long-Term: Project future revenue based on the expected lifetime value of your customer base.

Start measuring Total Contract Value and optimizing your revenue streams with Coefficient’s template.

#6 Sales by Country & Industry

Analyzing sales performance by country and industry helps you identify growth opportunities and tailor your strategies to specific markets. This metric enables you to:

  • Identify high-performing markets: Focus resources on countries and industries with the highest revenue potential.
  • Adapt strategies: Customize sales approaches based on the unique needs and preferences of each market.
  • Allocate resources: Optimize resource allocation by prioritizing markets with the greatest growth potential.

How to Calculate: Segment sales data by country and industry, and calculate the total revenue and growth rates for each segment.

How Coefficient’s Sales by Country & Industry Template Can Help

Coefficient's Sales by Country & Industry template for sales teams

Coefficient’s Sales by Country & Industry template simplifies the process of analyzing this metric, with real-time data integration and customizable views.

  • Identify Top Markets: Quickly identify the countries and industries driving the most revenue.
  • Spot Growth Opportunities: Use historical data to identify markets with the highest growth potential.
  • Customize Reports: Create reports tailored to your specific needs, so you can make informed decisions about resource allocation.
Start analyzing your sales performance by country and industry with Coefficient’s template.

#7 Win / Loss Analysis

Conducting win/loss analysis helps you understand the factors that influence your sales outcomes and identify areas for improvement. This metric offers several benefits:

  • Identify success factors: Pinpoint the strategies, tactics, and behaviors that lead to closed-won deals.
  • Address weaknesses: Identify and address the factors contributing to lost opportunities.
  • Improve sales processes: Use insights from win/loss analysis to optimize your sales approach and increase win rates.

How to Calculate: Analyze closed-won and closed-lost opportunities, and identify the key factors that influenced each outcome.

How Coefficient’s Win / Loss Analysis Template Can Help

Coefficient's Win / Loss Analysis template for sales teams

Coefficient’s Win / Loss Analysis template makes it easy to conduct this critical analysis, with live data integration and customizable reports.

  • Identify Key Factors: Quickly identify the factors that contribute to won and lost deals.
  • Spot Trends: Use historical data to identify patterns and trends in your win/loss outcomes.
  • Customize Analysis: Create reports tailored to your specific needs, so you can focus on the most relevant factors.

Gain valuable insights into your sales outcomes with Coefficient’s Win / Loss Analysis template.

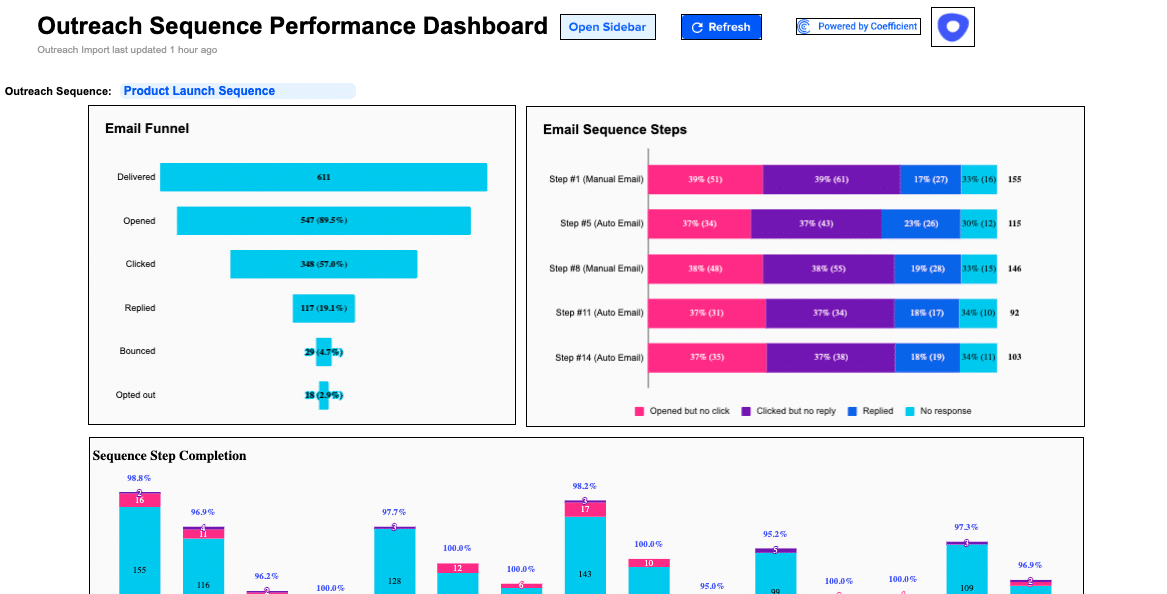
#8 Outreach Sequence Performance

Monitoring the performance of your outreach sequences helps you optimize your sales communication and improve response rates. By tracking this metric, you can:

  • Identify top-performing sequences: Pinpoint the sequences that generate the highest response rates and revenue.
  • Optimize content and timing: Use performance data to refine your messaging and timing for maximum impact.
  • Allocate resources: Focus your efforts on the most effective outreach sequences to maximize ROI.

How to Calculate: Measure the response rates, conversion rates, and revenue generated by each outreach sequence.

How Coefficient’s Outreach Sequence Performance Template Can Help

Coefficient's Outreach Sequence Performance template for sales teams

Coefficient’s Outreach Sequence Performance template simplifies the process of tracking and analyzing this metric, with live data integration and customizable dashboards.

  • Identify Top Sequences: Quickly identify the outreach sequences driving the best results.
  • Optimize Performance: Use real-time data to refine your messaging, timing, and targeting for maximum impact.
  • Customize Reports: Create dashboards tailored to your specific needs, so you can focus on the most relevant metrics.

Start optimizing your outreach sequences with Coefficient’s Outreach Sequence Performance template.

#9 MOM Growth

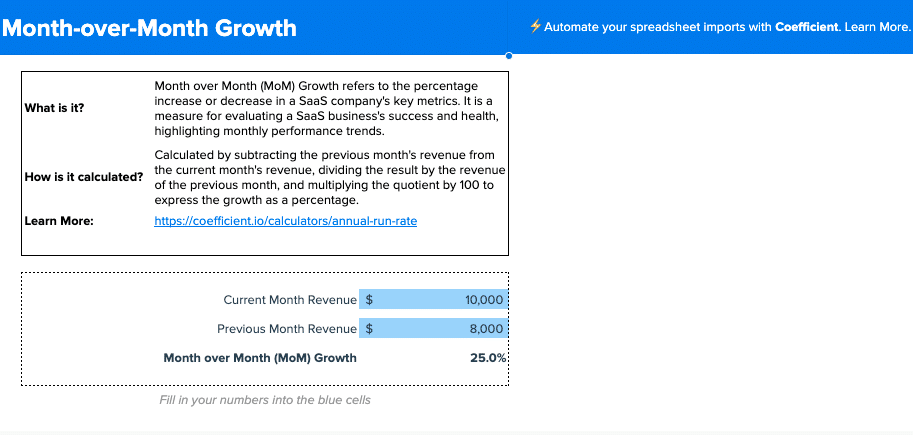
Month-over-Month (MOM) growth measures the change in your key sales metrics from one month to the next. Tracking this metric helps you:

  • Identify trends: Spot positive or negative trends in your sales performance over time.
  • Adjust strategies: Make data-driven adjustments to your sales approach based on monthly performance.
  • Set realistic goals: Use historical MOM growth data to set achievable targets for future months.

How to Calculate: MOM growth is calculated by comparing the value of a metric in the current month to the value in the previous month.

How Coefficient’s MOM Growth Template Can Help

 Coefficient's MOM Growth template for sales teams

Coefficient’s MOM Growth template makes it easy to track and analyze this essential metric, with live data integration and customizable reports.

  • Monitor Performance: Quickly assess your month-over-month growth across key sales metrics.
  • Identify Trends: Use historical data to spot positive or negative trends in your sales performance.
  • Set Realistic Goals: Leverage MOM growth data to set achievable targets for future months.

Start tracking your month-over-month growth with Coefficient’s MOM Growth template.

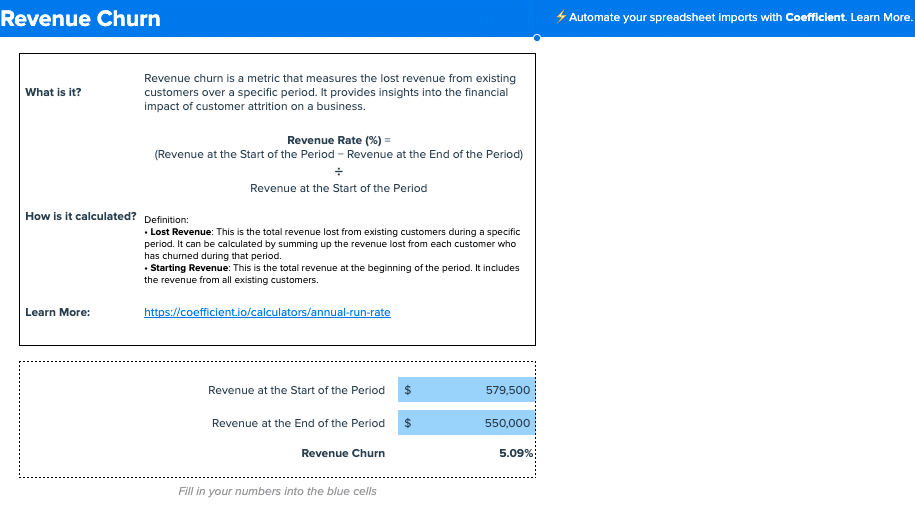
#10 Revenue Churn

Revenue churn measures the percentage of revenue lost due to customer attrition over a given period. Monitoring this metric helps you:

  • Assess customer retention: Identify the rate at which customers are leaving and the impact on your revenue.
  • Identify risk factors: Pinpoint the factors contributing to customer churn and take corrective action.
  • Optimize retention strategies: Use churn data to refine your customer retention approach and minimize revenue loss.

How to Calculate: Revenue churn is calculated by dividing the revenue lost due to customer attrition by the total revenue at the beginning of the period.

How Coefficient’s Revenue Churn Template Can Help

Coefficient's Revenue Churn template for sales teams

Coefficient’s Revenue Churn template simplifies the process of tracking and analyzing this critical metric, with live data integration and customizable dashboards.

  • Monitor Churn Rate: Quickly assess your revenue churn rate and its impact on your business.
  • Identify Risk Factors: Use historical data to pinpoint the factors contributing to customer churn.
  • Optimize Retention: Leverage churn data to refine your customer retention strategies and minimize revenue loss.

Advantages of Integrating Live Data From Various Systems into a Single Dashboard

Integrating live data from various platforms into a single dashboard offers numerous advantages for sales teams:

  •  Centralized data: Consolidate data from multiple sources, providing a single source of truth for sales performance.
  • Real-time insights: Access up-to-date information, enabling quick decision-making and agile strategizing.
  • Time savings: Automate data collection and analysis, freeing up time for more strategic initiatives.

Coefficient’s pre-built dashboard templates make it easy to integrate live data from various systems, with customization options to suit your unique needs.

Success Story: How Jebbit Streamlined Sales and Revenue Operations with Coefficient

Jebbit, a pioneering platform in the zero-party data industry, faced challenges with its CRM software and manual sales commission tracking. They needed an automated solution that could provide real-time data insights.

By adopting Coefficient, Jebbit streamlined their sales commission process, eliminating hours of manual work and providing their sales team with real-time insights and a comprehensive view of their commissions. Coefficient’s support for historical Salesforce data also enabled Jebbit to craft more accurate sales forecasts and respond promptly to leadership requests.

“Coefficient saved us hours upon hours of work,” said Rachel Golden, VP of Finance at Jebbit. “There’s no manual back-and-forth with salespeople about commissions anymore. But we haven’t just saved tons of time. We’ve also been able to offer our team better data and more transparency.”

Read the full story to learn how Jebbit leveraged Coefficient to streamline their sales and revenue operations.  

Conclusion

Tracking the right sales metrics is essential for the success of any company. By focusing on the top 10 metrics outlined in this blog post and leveraging Coefficient’s pre-built templates, you can gain valuable insights into your sales performance, make data-driven decisions, and optimize your strategies for growth.

Coefficient’s customizable templates make it easy to track and analyze critical sales metrics, from opportunity history and win rates to open pipe and total contract value. With real-time data integration and collaborative features, Coefficient empowers sales teams to work more efficiently and effectively.

Transform your sales performance tracking with Coefficient. Get started today for free! 

How to Analyze Sales Rep Performance in Google Sheets

Analyzing sales rep performance is crucial for understanding the effectiveness of your team’s productivity in the field. Metrics like average deal size and win rate are valuable indicators of how each rep is contributing to the bottom line.

But accurately assessing performance is often a manual, time-consuming process. Thankfully, you can easily track sales rep performance in Google Sheets using Coefficient’s AI Copilot.

This step-by-step guide will walk you through how to analyze sales performance by each rep in Google Sheets using Coefficient’s powerful GPTX functions.

Let’s dive in!

Step-by-Step Walkthrough: Analyze Sales Rep Performance in Your Spreadsheet

1. Install Coefficient

Coefficient is a free Google Sheets add-on that allows you to connect your business systems to Google Sheets and pull real-time data into your spreadsheet.

Coefficient also comes with several powerful AI features that make sales rep analysis much simpler.

First, let’s install Coefficient. Open Google Sheets. Click Extensions on the menu bar and select ‘Add-ons’ -> ‘Get add-ons.’

google sheets addon coefficient

This will launch Google Workspace Marketplace. In the search bar at the top, search for “Coefficient” and select the Coefficient app.

coefficient data connector

Coefficient will now ask you for permission to access your Google account. Press ‘Allow’ to complete the installation.

coefficient permissions

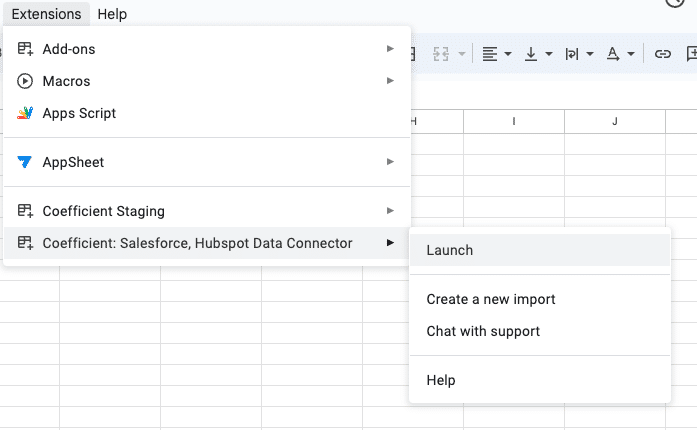
Once completed, return to your Google Sheets menu and click on Extensions -> Coefficient -> Launch.

google sheets addon

Coefficient will now appear on the sidebar of your Google Sheet.

2. Import Live Salesforce Data

Now you must import your live Salesforce CRM data into Google Sheets.

This data will provide the foundation for your analysis, giving you insights into deal sizes, win rates, and revenue generated by each sales rep.

Click ‘Import from…’ on the Coefficient sidebar menu.

import live data google sheets

Select Salesforce as your data source.

salesforce data imports google sheets

Click ‘From Objects & Fields.’

objects and fields salesforce

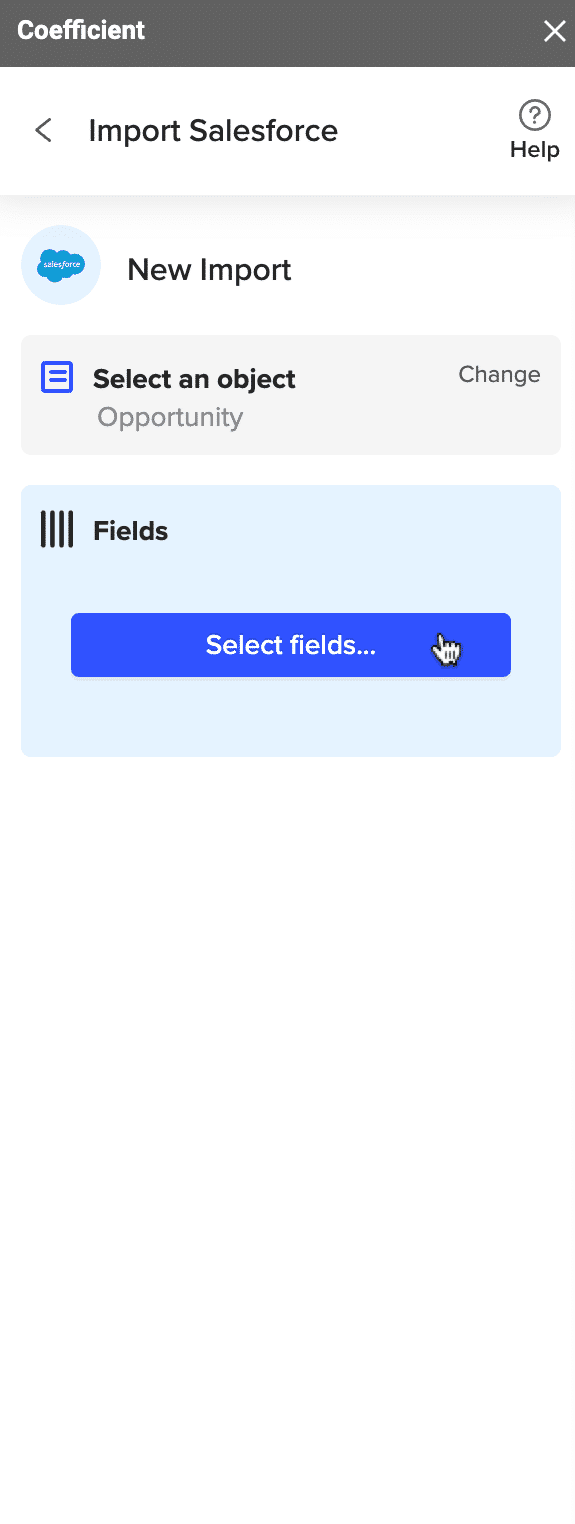
Under ‘New Import,’ choose the ‘Opportunity’ object.

salesforce opportunity google sheets

Click ‘Select fields…’

Select Salesforce object

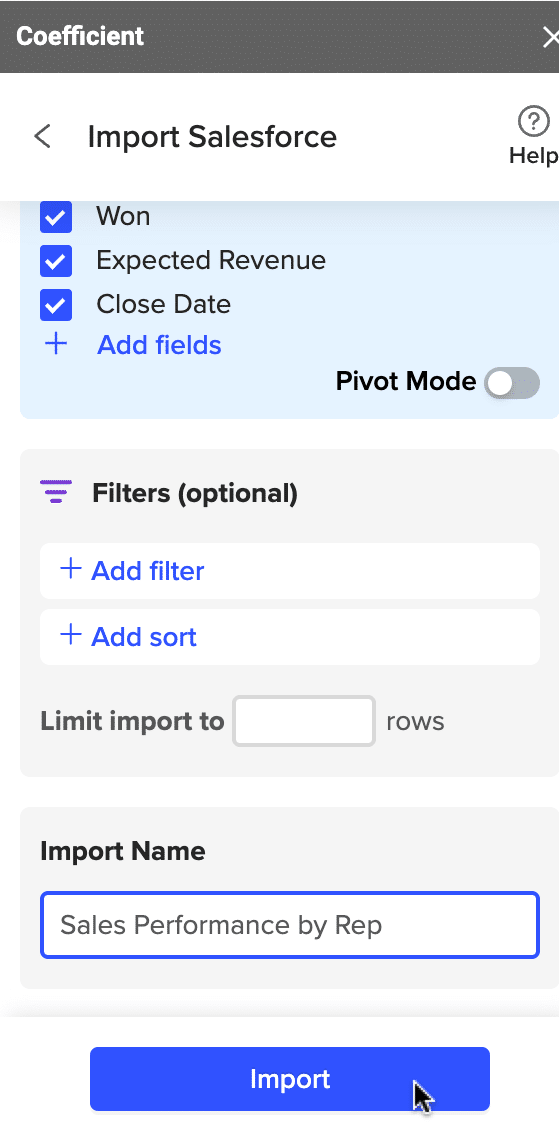
Then select the following fields: ‘Name,’ ‘Full Name,’ ‘Closed,’ ‘Won,’ ‘Expected Revenue,’ and ‘Close Data.’

salesforce fields google sheets

Once all the fields are selected, name your import and click ‘Import’ to send your data to Google Sheets.

sales performance by rep

3. Analyze Sales Rep Performance

Now let’s calculate each sales rep’s average deal size and win rate by creating custom formulas with Coefficient’s GPTX functions.

Go back to Coefficient’s main menu and click ‘GPT Copilot.’

gpt copilot google sheets

Select â€˜Pivot Builder.’

pivot builder google sheets

Use your cursor to select your data range. For this example, the range is Opportunity!A2:F102.

expected revenue google sheets

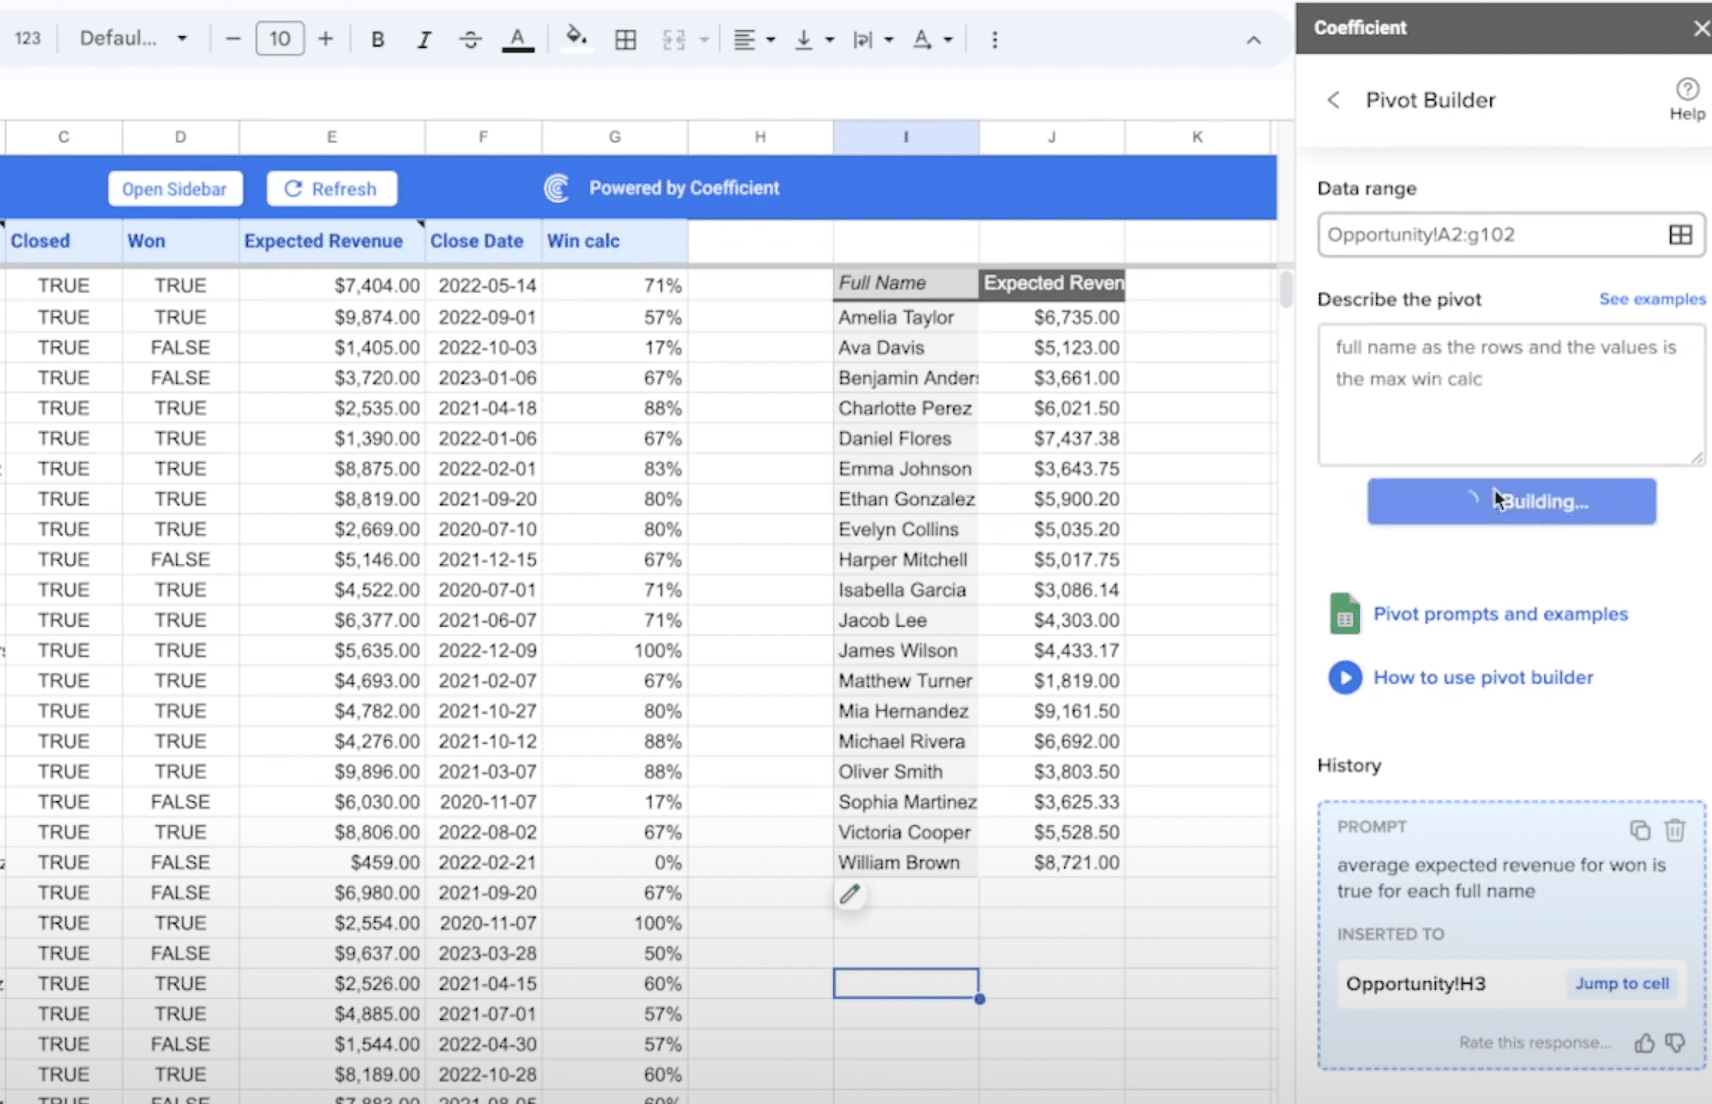
Next, describe the pivot you wish to build in the text box. In this example, the prompt we’ll use is: “average expected revenue for won is true for each full name”.

Now click ‘Build’ and insert your pivot table in an empty cell on your spreadsheet.

pivot builder google sheets

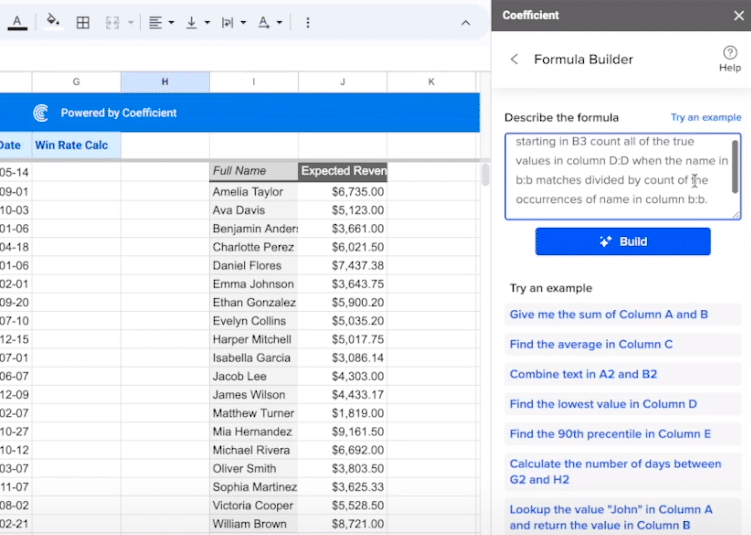
Next, we’ll create a custom formula with the Formula Builder to calculate individual rep win rate.

formula builder google sheets

Describe the formula you wish to build.

For this example, our prompt is: “starting in B3 count all of the true values in column D:D when the name in b:b matches divided by count of the occurrences of name in column b:b”.

formula builder prompt

Create a new column called ‘Win Rate Calc,’ and copy and paste the formula builder’s output into the cell below it. For this example, the formula is:

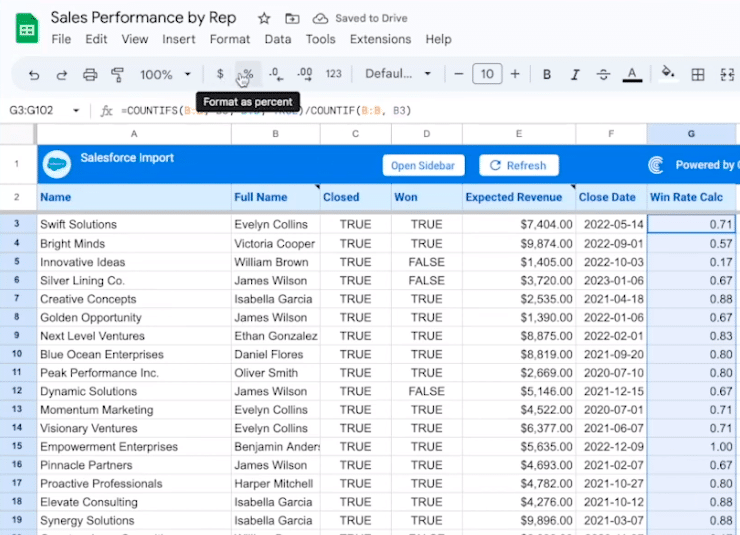
=COUNTIFS(B:B,B3, D:D, TRUE)/countif(B:B, B3)

formula builder google sheets prompt

Drag the formula down for all your sales reps. Now format the row by percentage. Click the % icon on the toolbar.

win rate google sheets calculation

And finally, remove a decimal to make the data easier to read. Click the .0 icon on the toolbar.  

win rate calculation

Next, we’ll build a pivot table to track sales rep sales performance over time. Return to the GPT Copilot menu and select ‘Pivot Builder.’

pivot builder gpt copilot

Use your cursor to select the data range and describe the pivot you wish to create.

In this example, the prompt is: “full name as the rows and the values is the max win calc”.

pivot builder prompt

Insert the formula into your spreadsheet.

pivot table spreadsheet sales data

Next, we’ll group by salesperson and pivot by month and year.

Select the data range. Enter this prompt in the text box: “group by expected revenue by full name where won is true, pivot by close data year and close date month”.

win rate sales rep google sheets

Select ‘Build’. Now insert the formula into an empty cell.

insert pivot table google spreadsheet

As a last step, let’s calculate the number of deals won and revenue generated per rep.

Use your cursor to select the data range. Then describe the table you want to build in Pivot Builder.

In this example, the prompt is: “Sum number of deals won, and sum total revenue generated when won is true for each full name”.

calculate expected revenue google sheets

Select ‘Build’. Insert the formula into a cell to generate the calculation.

how to use pivot builder

And there you have it! Now you can analyze the performance of your individual sales reps directly inside Google Sheets.

Sales Rep Performance Analysis with Live Data in Google Sheets

Coefficient combines the power of AI, live data, and Google Sheets, allowing you to perform sales rep analysis, sales forecasting, and other critical sales calculations in a fraction of the time.

Get started with Coefficient for free to bring enhanced sales analysis to Google Sheets with the power of AI.