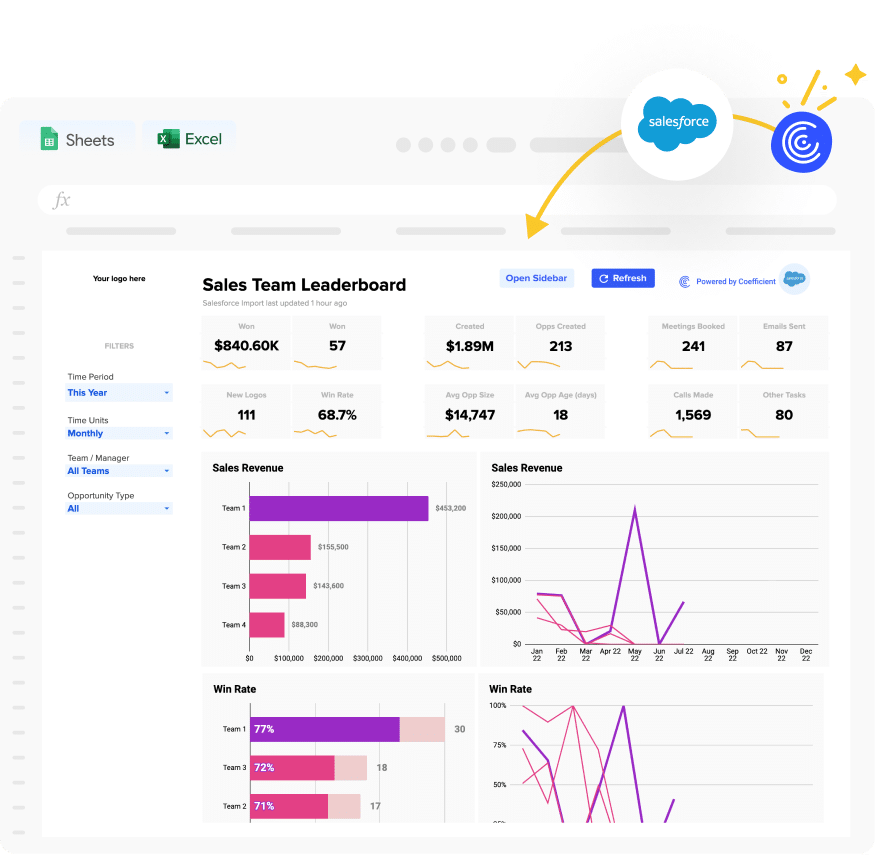

Sales Team Leaderboard for Google Sheets
Our free Sales Team Leaderboard for Google Sheets combines all the elements of our favorite leaderboard dashboards. You can launch our leaderboard dashboard in seconds Boost sales by encouraging friendly competition among your sales reps and teams with a free Google Sheets sales leaderboard template. Powered by YOUR live data.
Our free Sales Team Leaderboard for Google Sheets combines all the elements of our favorite leaderboard dashboards. You can launch our leaderboard dashboard in seconds and connect to your Salesforce CRM data in one click.
Yes, it’s that simple.
With our Sales Team Leaderboard, you can track the sales performance of your company, teams, and individuals with pre-built leaderboard dashboards in Google Sheets.
How to connect your Salesforce data
Getting started takes minutes. Download the template. Connect your Salesforce account. Watch your leaderboard populate with live data instantly.
The template automatically pulls revenue, deals won, win rates, and pipeline metrics. No manual data entry needed. Your team sees real-time performance rankings immediately.
Dashboard Filters
Our Sales Team Leaderboard allows you to easily filter all its charts and reports by time period, time units, team, sales rep, and opportunity type. This allows you to quickly ascertain the performance of individual reps, sales campaigns, and other segments with a simple dropdown menu.

Team Leaderboard Summary

The Sales Team Leaderboard summarizes key metrics at the top of the Google spreadsheet. This allows you to rapidly obtain critical leaderboard metrics for a sales team or individual sales rep, such as:
- Revenue won
- Deals won
- New logos
- Win rate
- Pipeline created
- Opps created
- Average opp size
- Average opp age
- Meetings booked
- Emails sent
- Calls made
- Other tasks
This high-level summary gives you an overview of all the most important leaderboard metrics in one place.
Sales Team Leaderboard
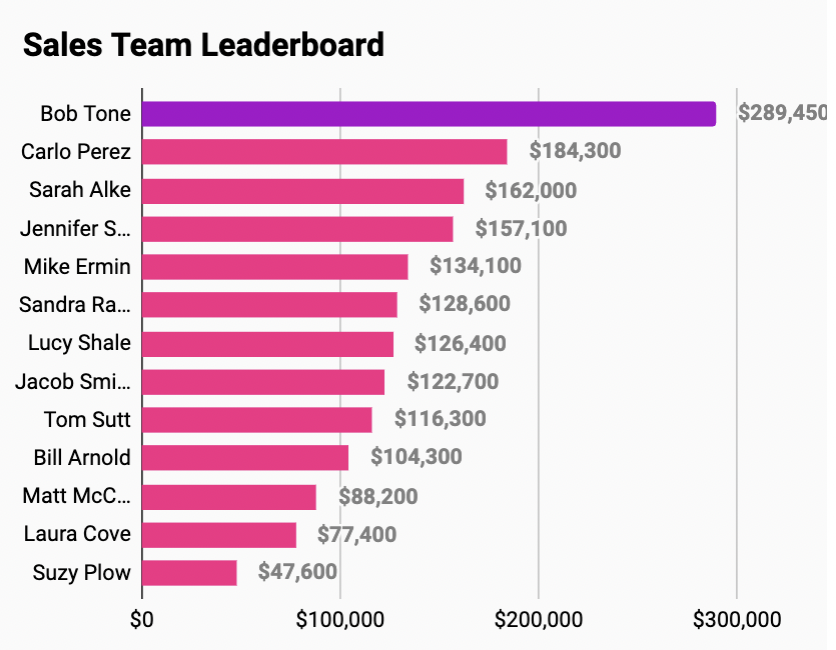
The template contains a classic Sales Team Leaderboard that compares, side-by-side, revenue won by each sales rep. Filter the template to see how each rep performed in a given time period.
Sales Team Leaderboard (Over Time)

The template also contains a Sales Team Leaderboard graphed over time. See who the lead sellers are for any time period. You can also filter by time period to change the time sequence on the graph.
Win Rate Dashboard
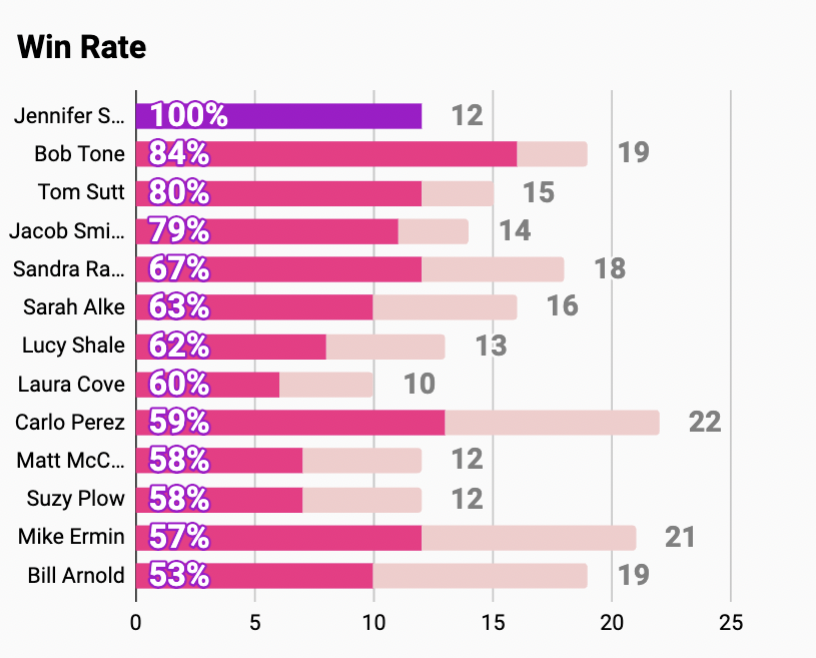
Our Sales Team Leaderboard comes with a pre-built win rate Dashboard. The dashboard ranks reps and teams by win rate percentage, alongside the total number of deals closed. This helps sales leaders hone in on the teams and reps that may need to adjust their selling tactics.
Win Rate Dashboard (Over Time)

This dashboard enables you to see win rates for teams and reps over a given time unit (daily, weekly, monthly, quarterly, yearly). Track performance over time periods and see who needs to adjust selling techniques.
New Logos Won Dashboard
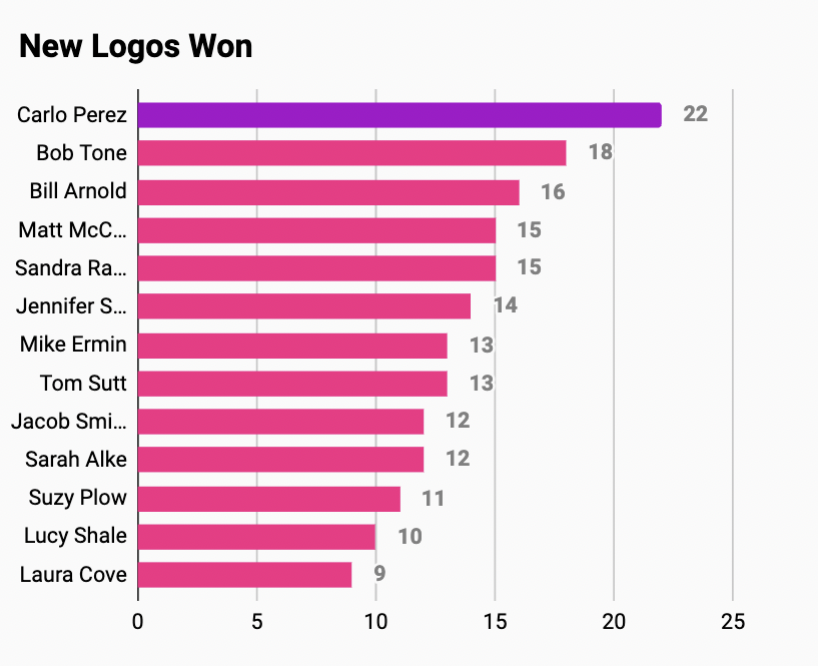
With the New Logos Won Dashboard, you can understand who’s bringing in the most new business in a simple-to-follow logo leaderboard. Now you can see who’s contributing significantly to bringing in new revenue.
New Logos Won Dashboard (Over Time)

This dashboard allows you to quickly learn how sales reps and teams are bringing in new logos over a given time period. This will give you a bird’s eye view of who is contributing the most to new business over time.
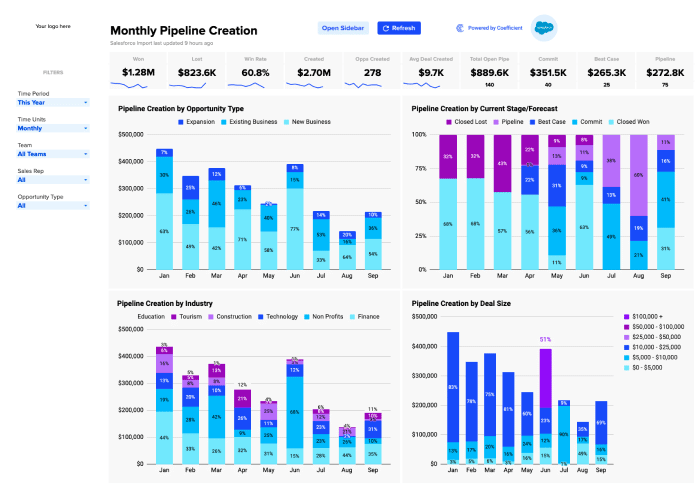
Pipeline Creation Dashboard

Find out what team or sales rep is contributing the most to pipeline creation with this clean, simple dashboard. See who needs to up their game in terms of prospecting and pipe generation.
Pipeline Creation Dashboard (Over Time)

View pipeline creation over time for your sales reps and teams. Learn who the most productive players are, and have them help those in the back of the pack by replicating their successful practices.
Average Opp Size Dashboard

Track average opp size to discover who is bringing in the most profitable deals — and how you can leverage their tactics to lift up other team members.
Average Opp Size Dashboard (Over Time)
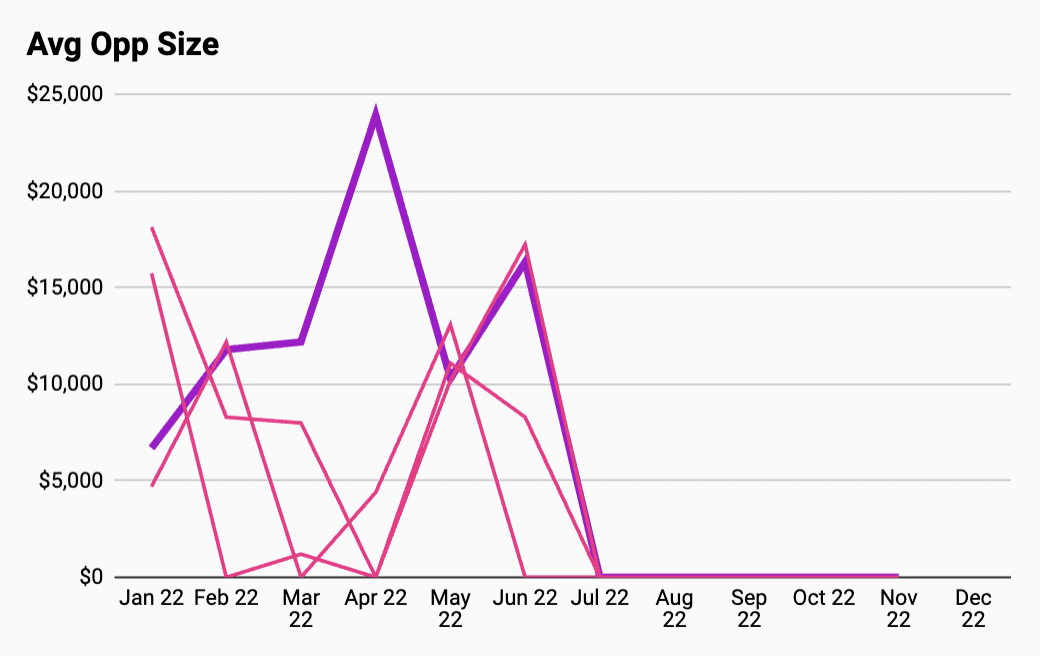
This dashboard enables you to see who’s bringing in the biggest deals over time, so you can get a more concrete sense of who’s contributing to the bottom line.
Average Opp Age Dashboard
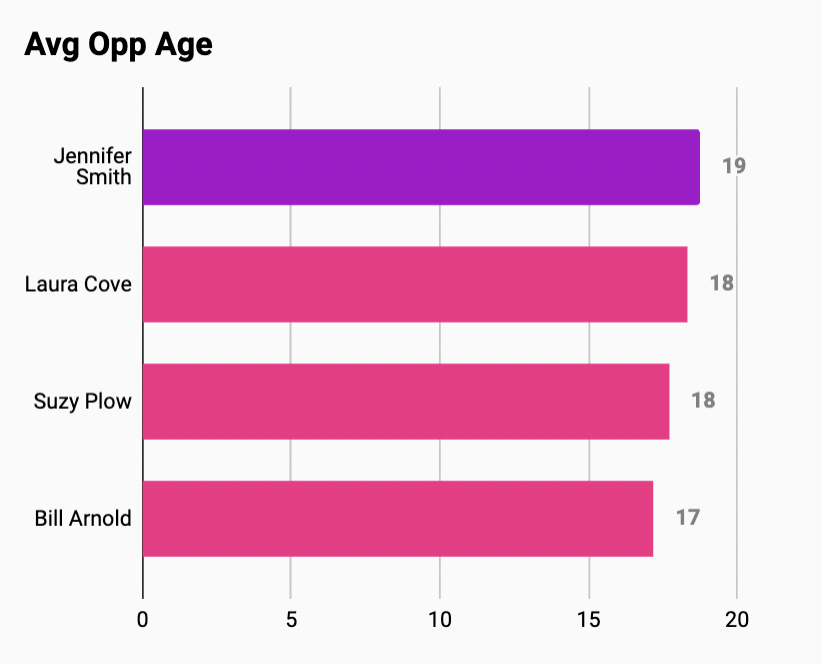
Identify average opp age across reps and teams in a fast and efficient way. This gives you an overview of how long sales reps are keeping deals open, and how you can improve the sales process.
Average Opp Age Dashboard (Over Time)
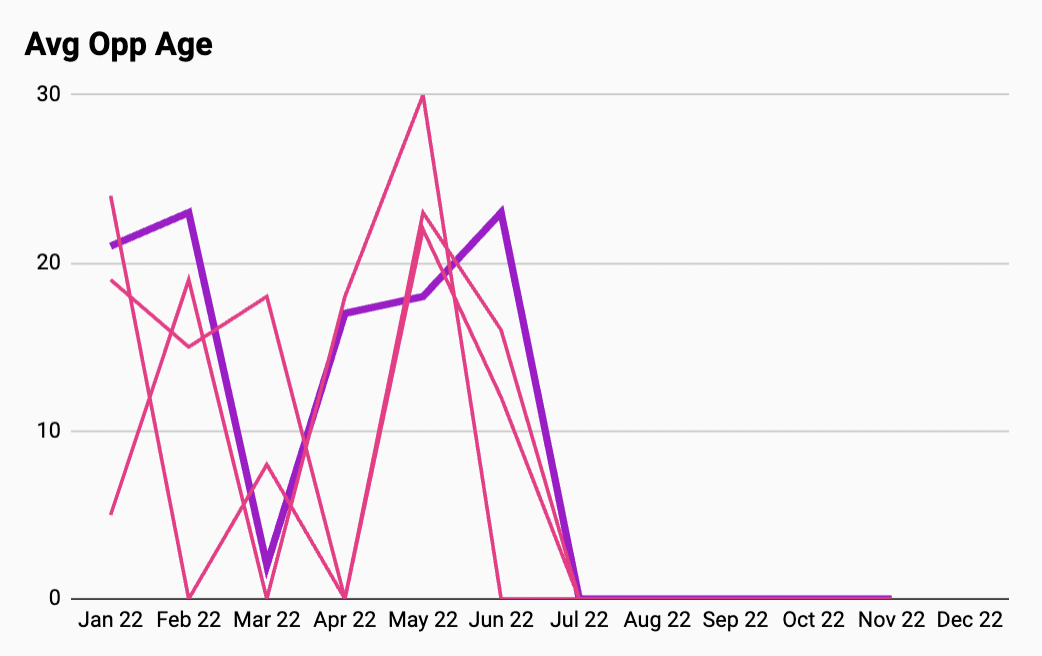
The average opportunity age over time dashboard shows you how sales reps have maintained start-to-close dates during different time periods. Find out if any rep has slipped in terms of average opportunity age.
Meetings Booked Dashboard

This dashboard allows you to keep track of how productive reps and teams are at booking new meetings.
Meetings Booked Dashboard (Over Time)

The Meetings Booked Dashboard (Over Time) enables you to view meeting activity for reps on a daily, weekly, monthly, quarterly, or yearly basis.
Calls Made Dashboard

With this dashboard, you can easily monitor calls made by reps and teams, and see who needs to pick up the pace.
Calls Made Dashboard (Over Time)

Monitor calls made over time to see how productive your reps have been over a wider period of time.
Emails Sent Dashboard
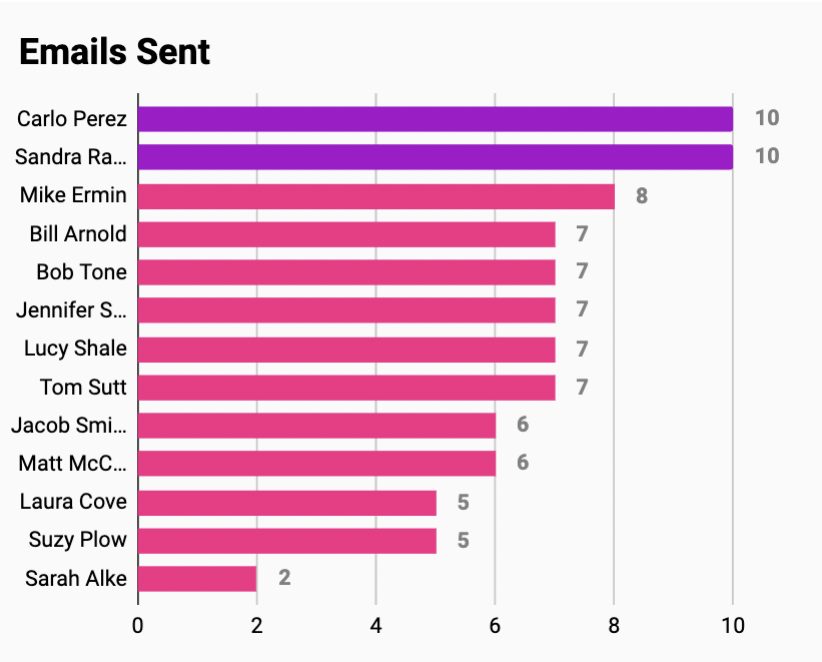
Understand how many emails your reps are sending out, and who leads the pack, with this dashboard.
Emails Sent Dashboard (Over Time)


See how many emails your reps have sent out over time to get a more complete view of their productivity.
Opportunities Created Dashboard
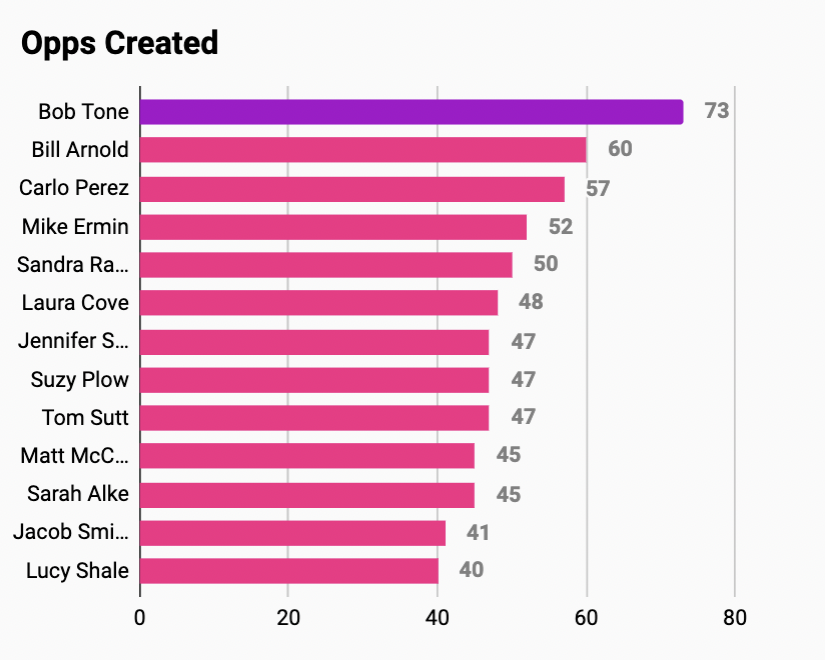
Track how many opportunities your sales reps and teams have created. Modify sales tactics based on the practices of top performers.
Opportunities Created Dashboard (Over Time)
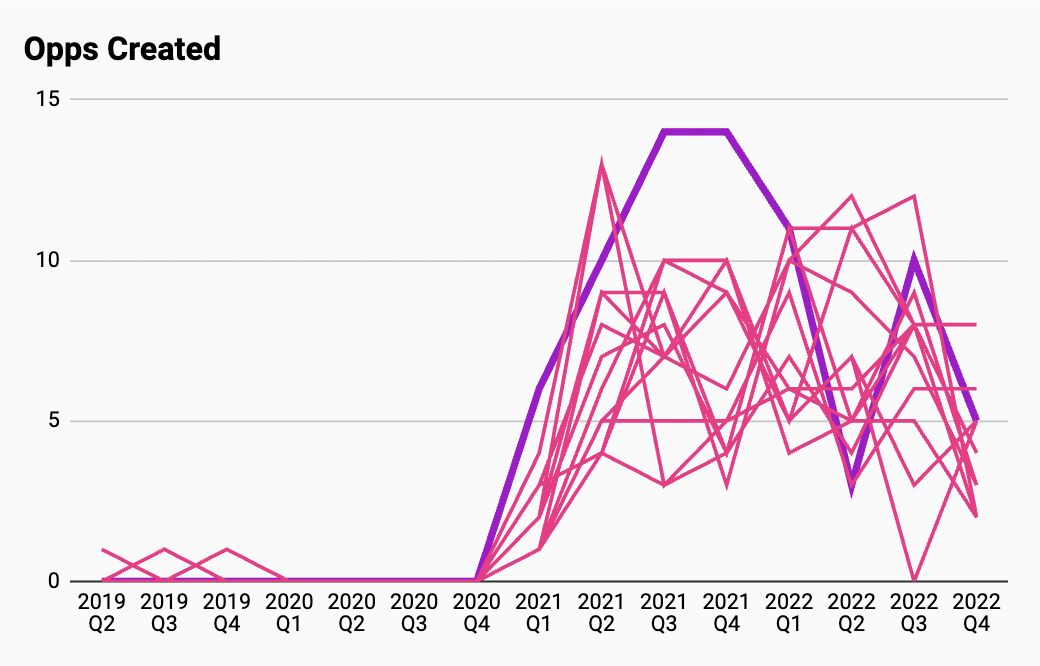
This dashboard gives a more comprehensive view of opportunities created over time. See who is contributing significantly to the sales pipeline on a daily, weekly, monthly, quarterly, and yearly basis.
Why use a sales team leaderboard?
Sales teams can boost performance between 6% to 9% by gamifying sales activities. Team leaderboards create friendly competition among sales staff, adding another incentive for reps to close deals.
A sales team leaderboard tracks performance against business goals and targets. Sales reps and teams are compared side-by-side in dashboards that chart key sales metrics. This fosters competitive selling while enhancing overall performance.
The most effective KPIs for sales leaderboards include:
- Win rate
- New logos won
- Pipeline creation
- Opportunity size
Ready to boost your sales team’s performance? Get started with our free Google Sheets template now — powered by your live Salesforce CRM data.