Free, pre-built Sales to Target Dashboard in Google Sheets
Sales managers and analysts frequently face challenges combining sales data from CRMs like Salesforce or HubSpot with sales targets that are typically stored and managed in spreadsheets. Let Coefficient do the heavy lifting for you to connect and analyze these datasets!
This Sales to Target report template will help you:
- Automatically populate this dashboard with live data from your CRM
- Add your monthly or quarterly sales targets (broken down by sales reps or teams)
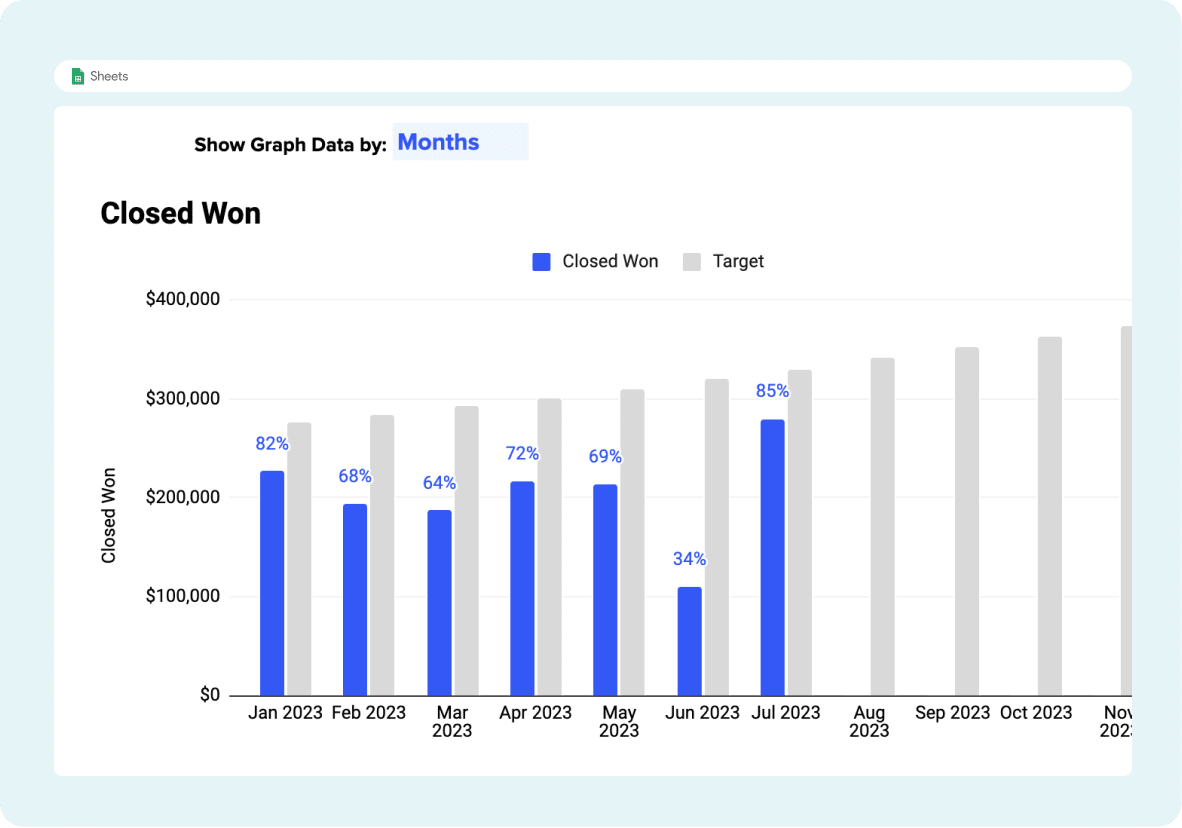
- Instantly gain insights into how each sales team is performing relative to their target
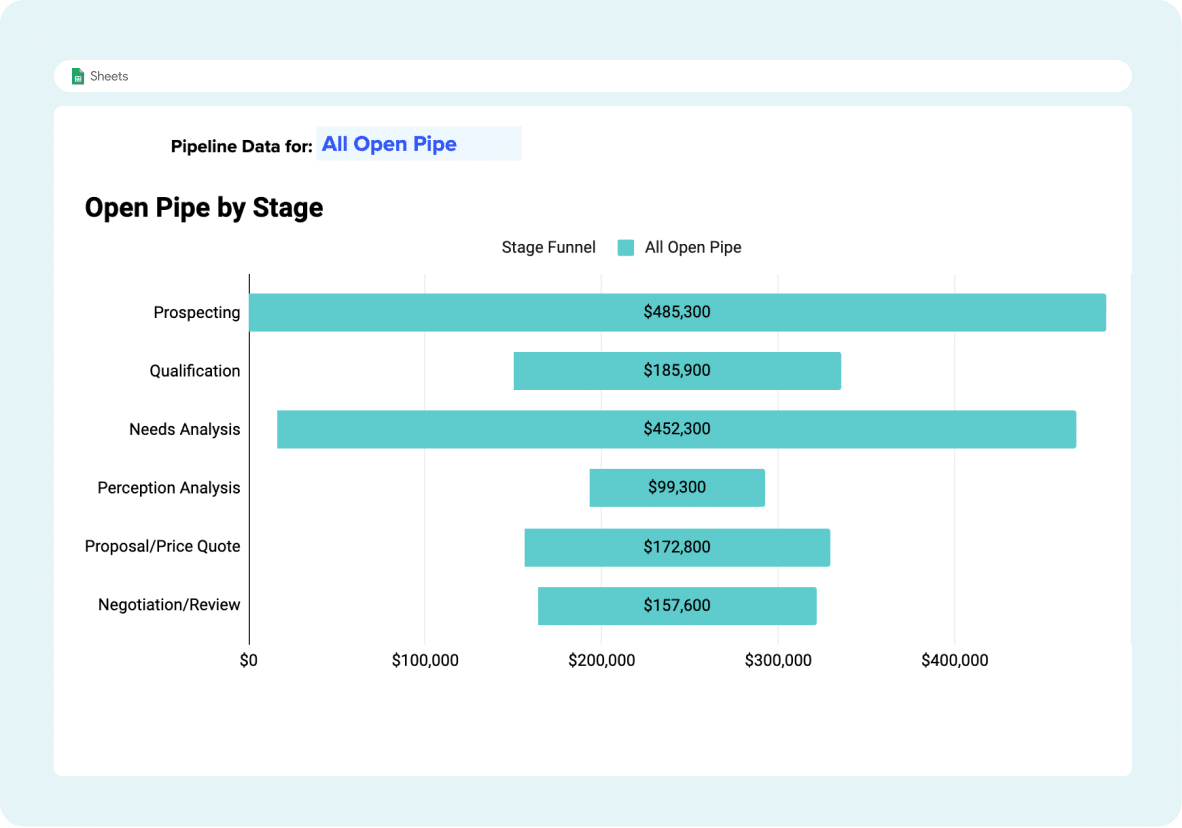
- Monitor your sales pipeline capacity and funnel efficiency to ensure you’ll always hit targets
What are the B2B Funnel Stages?
B2B sales funnel stages describe the narrowing focus as potential clients move towards making a purchase, often represented as a funnel. This funnel is not a linear progression but a dynamic process where prospects can move up, down, or even exit and re-enter at different stages.
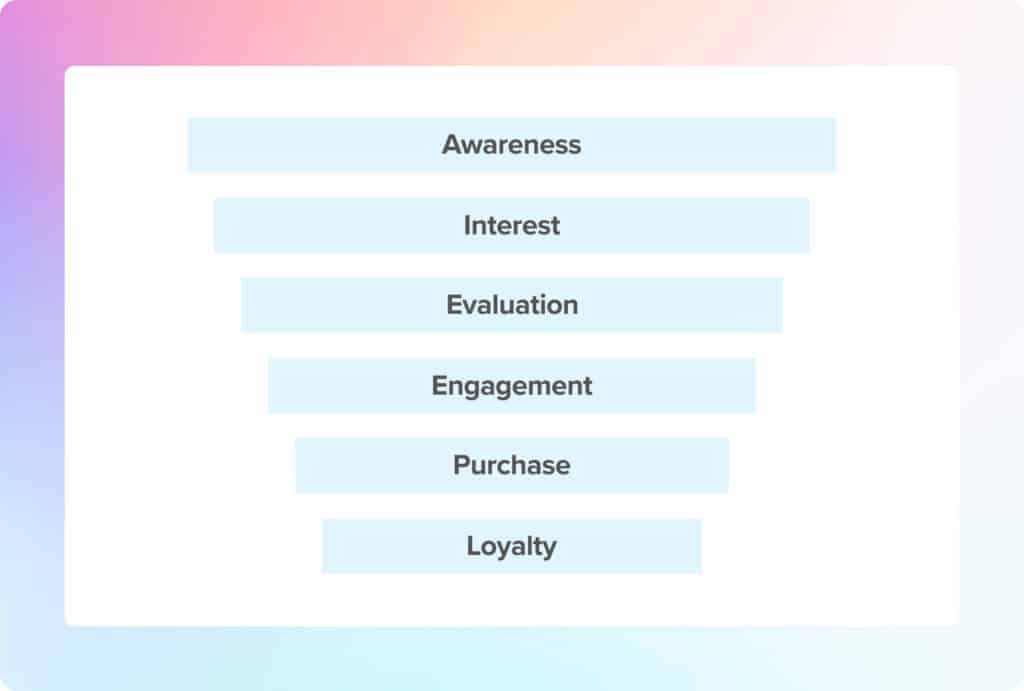
The B2B sales funnel typically consists of six key stages:
- Awareness: This is the stage where potential customers become aware of a problem or need, often through marketing campaigns or independent research. Your brand can gain visibility at this stage through effective content marketing and SEO strategies.
- Interest: As prospects move into the Interest stage, they seek more information about possible solutions to their problem. This is where they learn about your solution but not necessarily about your specific products or services. They want answers to their general questions about their needs and who can fulfill it.
- Evaluation: At this stage, prospects are considering different solution providers and trying to decide which offer is the best fit for them. This is where you must demonstrate how your solution best fits the prospect’s requirements, addressing and removing fears and concerns, building trust, and clearly communicating your value proposition.
- Engagement: During the Engagement stage, your leads will interact with your sales team. The goal here is to build a personal connection with the buyer and demonstrate the best aspects of your offering. It’s crucial to communicate your understanding of the buyer’s problem areas and offer specific solutions.
- Purchase: This is the stage where the prospect decides to buy and becomes a customer. It’s the culmination of all the previous stages and requires delivering on your promises.
- Loyalty: The final stage of the funnel is Loyalty, where the focus shifts to keeping clients happy and building a long-term relationship. Happy clients are likelier to stick with you and become brand advocates, providing testimonials and great reviews.
B2B Sales Funnel Conversion Rate by Stage
B2B sales funnel conversion rates can vary depending on factors like your specific business model, industry, and target audience. The key is to measure your conversion rates regularly and strive to improve them over time. These are common benchmarks for conversion rates by funnel stage.
- Web visits to Leads: The conversion rate for web visits to leads can vary widely, but a common benchmark is around 2–5%.
- Leads to MQLs (Marketing Qualified Leads): The conversion rate for leads to MQLs can also vary depending on the quality of the leads and the criteria used to identify MQLs. A benchmark conversion rate is around 20–30%.
- MQLs to SQLs (Sales Qualified Leads): The conversion rate for MQLs to SQLs is typically higher than for leads to MQLs, as MQLs have already been identified as having a higher potential to become paying customers. A benchmark conversion rate is around 25–30%.
- SQLs to Opportunities: The conversion rate for SQLs to Opportunities can vary depending on factors such as the sales team’s skills and the market’s competitiveness. A benchmark conversion rate is around 30–40%.
- Opportunities to Won: The conversion rate for Opportunities to Won can also vary depending on factors such as the size and complexity of the deal. A benchmark conversion rate is around 20–30%.