If you want to learn how to automate your sales reporting, then this guide is for you.
Creating sales reports is critical to learning more about the progress and performance of your sales team, funnels, or pretty much your entire sales operations.
However, manually building sales reports is often a huge time-suck and can drain your resources, especially when you need to update them regularly. That’s why automating sales reports is crucial.
With automated sales reports, you can set up coeff-templates easily, pull up and link your data seamlessly, and configure auto-update schedules for your reports, saving you tons of precious work hours and energy.
Read on to know more about sales reports, why you should automate them, and learn several of the best ways to generate your automatic report.
What is a sales report?
A sales report is an overview or summary of a company’s sales activities within a specific period. It shows the various trends within the sales volume while providing analyses on sales performance and the steps within the sales funnel.
Sales reports give you the information you need to make better business decisions, find new market opportunities, and determine the best actions to improve your sales processes.
You can have a daily sales report containing the number of meetings or phone calls each rep had set and the number of generated leads.
Weekly sales reports generally include the number of closed deals and the revenue generated. Monthly sales reports can give you a bigger picture of each sales rep or team activity.
Why you should automate sales reporting
Manually creating sales reports means a tedious, time-consuming process of collecting, organizing, and generating reports of volumes of sales data.
Automated sales reporting provides a solution by letting you configure customizable and re-usable coeff-templates.
You can set up automatic data syncing between datasets and systems. This cuts down significantly on the hours and resources required to build your sales reports.
Also, you can reduce data errors and inaccuracies when you automate sales reports since you won’t need to input and move your datasets manually.
With automated sales reports, you can configure data workflows once and set them up to auto-refresh or sync every time your data changes for seamless and streamlined sales reporting and analysis.
You can automate in just a few clicks. Copy one of our Google Sheets sales templates and follow along with the prompts.
Ways to automate your sales reporting in Google Sheets
Google Sheets is an excellent tool for building and automating sales reporting — when you know the right built-in features, add-ons, and third-party integrations to use.
We’ll break down three ways to automate your sales reporting in Google Sheets.
1. Using built-in features
The steps below show how you can use Google Sheets’ Explore feature to automate critical parts of your sales reporting process.
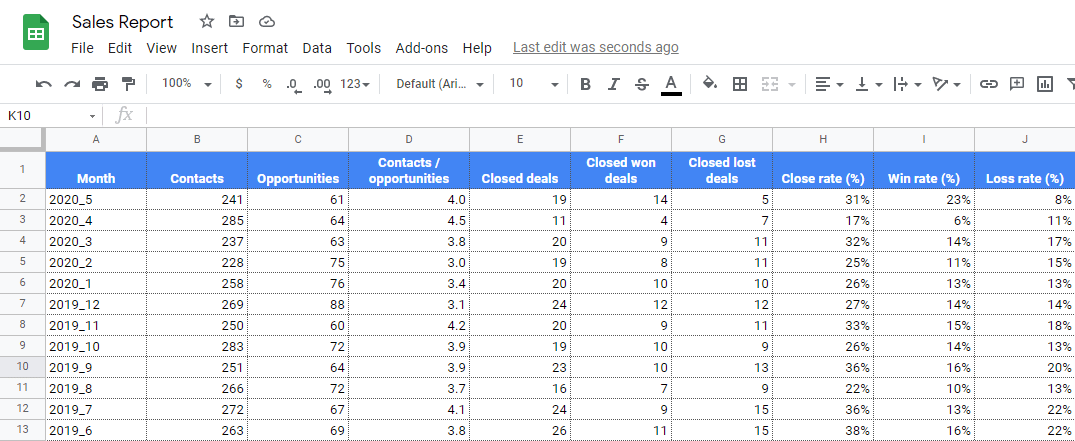
Step 1: Open your data
Import or open your spreadsheet file containing your sales data in Google Sheets. Here, we’ll use a sample sales funnel analysis dataset.
Click the Explore button at the bottom right corner of the Google Sheets interface to access the sidebar containing the smart and quick reporting and analytics tools.
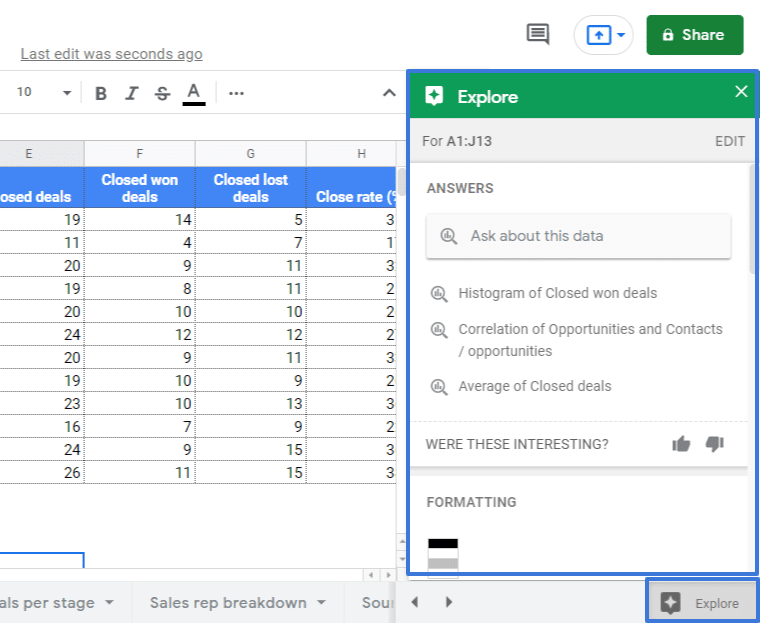
Step 2: Format and visualize your data
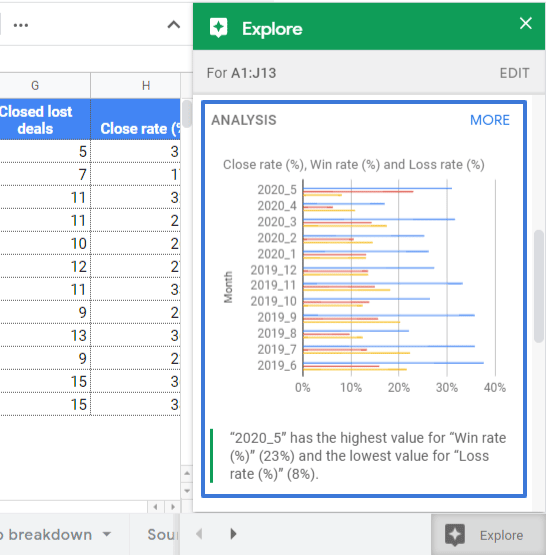
The Analysis feature offers recommended, pre-made stats, charts, and visualizations based on your active spreadsheet.
The charts also include explanations of the findings, such as the data ranges and the amount or number of changes within a set period.
See more chart options and view the graphs in full size to get a better look. Click the Insert chart icon or drag and drop the graph you want to add to your spreadsheet (or to a new sheet).
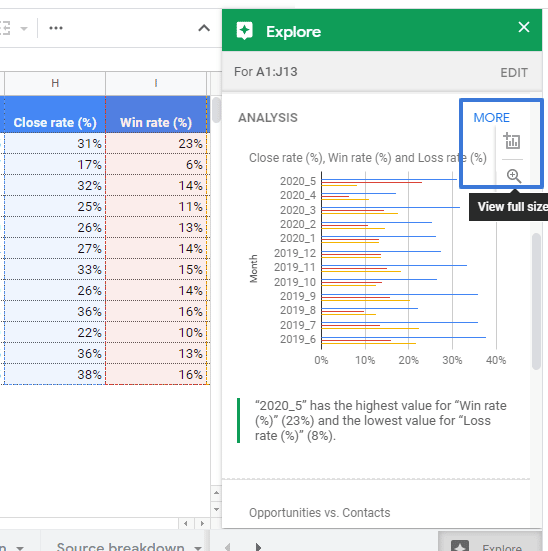
With the Analysis feature, you get instant sales data visualizations, so you won’t have to build your charts from scratch, saving you a huge amount of time and effort.
After adding the chart to your spreadsheet, you can customize it further by selecting any element within it. This opens the Chart editor sidebar containing the tools and options to modify your chart’s appearance and elements.
Step 3: Drill down on your sales data
You can use the Answers option to help you explore your sales data further. It acts almost like a built-in Artificial Intelligence (AI) assistant within Google Sheets to help you get instant information about your sales data.
Ask specific questions about your data by typing them in the provided field.
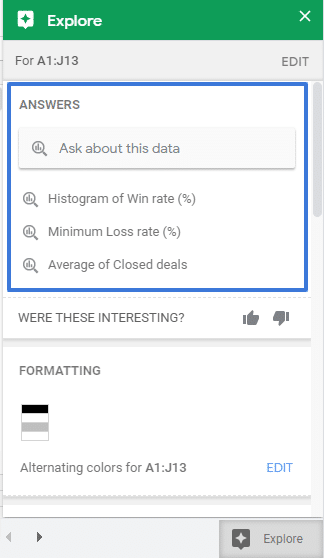
You’ll also see some suggested questions and information about your data (or a specific data range), such as the formula used and the recommended chart.
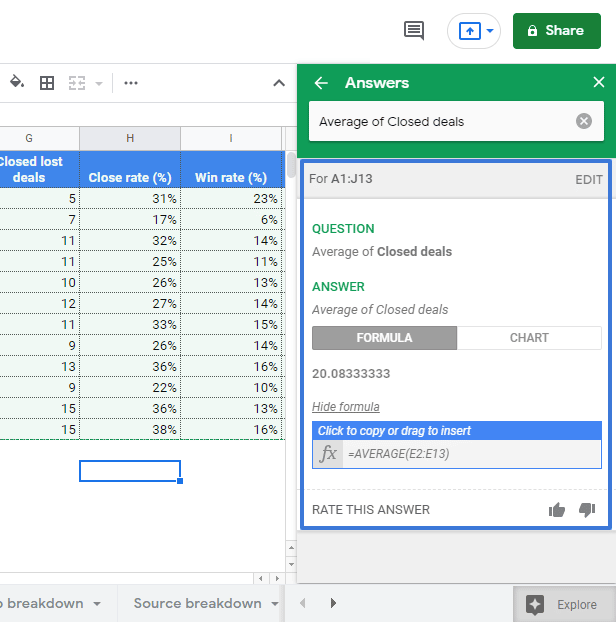
While the feature might not work perfectly, it provides a quick way to uncover information within your sales data that’s easy to find using a standard spreadsheet formula.
All these built-in Google Sheets functionalities streamline vital parts of your sales reporting and analysis.
2. Using an auto-capture formula and Google Apps Script
Let’s assume you use a Google spreadsheet shared with your sales team members so they can input their weekly and monthly data.
You would need to extract all the data each month, compile them for your sales reporting, and send the reports to designated people, making the process tedious and time-consuming.
However, with a Google Sheets auto-capture formula and the Google Apps Script, you can automate this process and the final report would be emailed automatically every month.
Step 1: Prep your data collection sheet
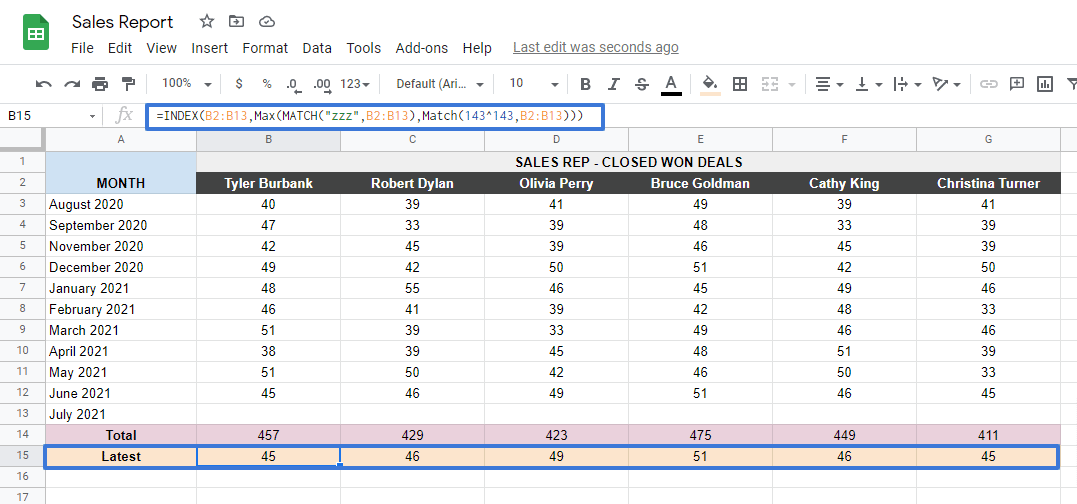
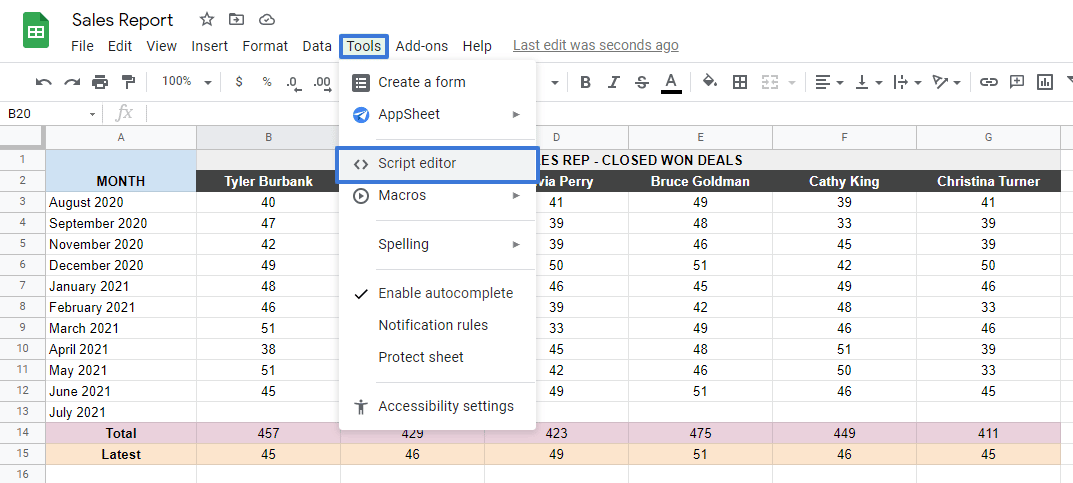
For this example, we’ll use a sample dataset containing each sales rep’s number of closed-won deals of every month.
Use this spreadsheet formula to auto-capture the latest data entries to ensure you include recently added information.
=INDEX(B1:B14,Max(MATCH(“zzz”,B1:B14),Match(143^143,B1:B14)))
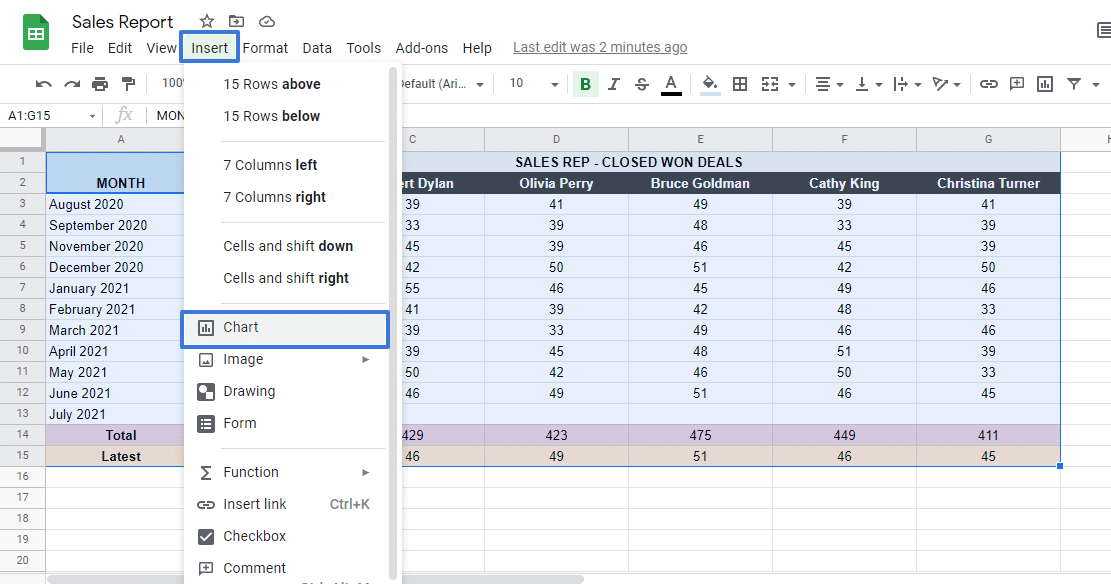
Step 2: Create your graph
Create a graph by selecting the data range and clicking Insert from the Google Sheets menu, then Chart.
To make this easier, use the Explore feature and follow the steps mentioned previously in the first method. You can have a chart that looks like this.
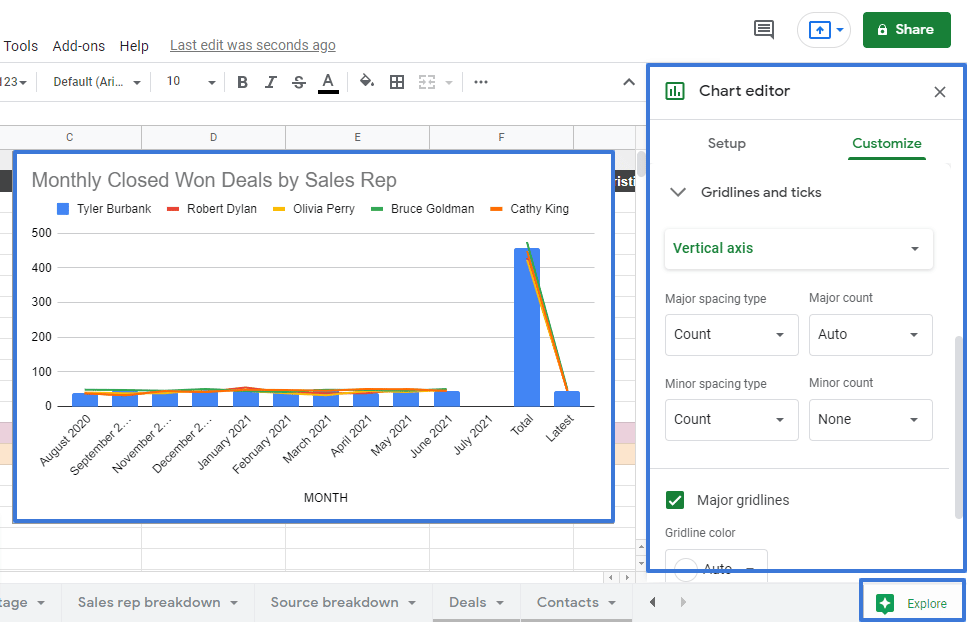
Customize the report and charts as you prefer, and you should be good to go.
Step 3: Set up the Google App Script
Navigate to Tools on the menu and click Script Editor from the dropdown.
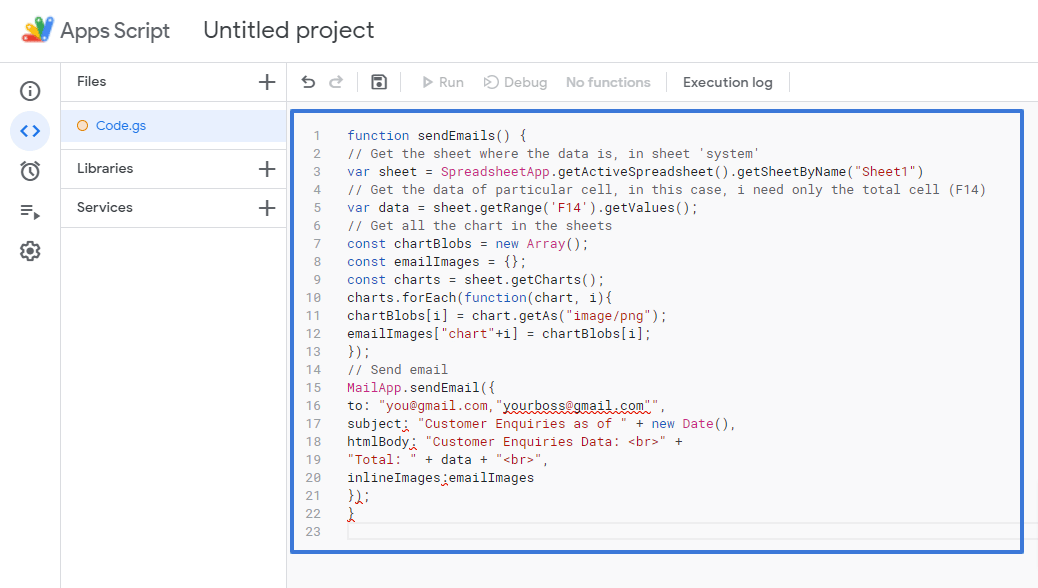
Copy this script and paste it on the Google Apps Script’s code area.
function sendEmails() {
// Get the sheet where the data is, in sheet ‘system’
var sheet = SpreadsheetApp.getActiveSpreadsheet().getSheetByName(“Sheet1”)
// Get the data of particular cell, in this case, i need only the total cell (G14)
var data = sheet.getRange(‘G14’).getValues();
// Get all the chart in the sheets
const chartBlobs = new Array();
const emailImages = {};
const charts = sheet.getCharts();
charts.forEach(function(chart, i){
chartBlobs[i] = chart.getAs(“image/png”);
emailImages[“chart”+i] = chartBlobs[i];
});
 314,000 Pros Sync Live Data from Their Business Systems into Spreadsheet
Stop exporting data manually. Sync data from your business systems into Google Sheets or Excel with Coefficient and set it on a refresh schedule.

// Send email
MailApp.sendEmail({
to: “you@gmail.com,”yourboss@gmail.com””,
subject: “Customer Enquiries as of ” + new Date(),
htmlBody: “Customer Enquiries Data: <br>” +
“Total: ” + data + “<br>”,
inlineImages:emailImages
});
}
Remember to replace the email with the recipient’s actual email address.
Test the code by saving and running it. The email will be sent to the address you specified in the code.
Step 4: Schedule monthly emails
Now that you have a report-generating function triggered easily with one click, you can configure the report for the email blast function.
Google Apps Script offers several types of triggers, including:
- Time-driven triggers, either hourly, weekly, or monthly
- Event-driven triggers, such as when the sheet gets opened and edited, or based on form submission
- Calendar by date
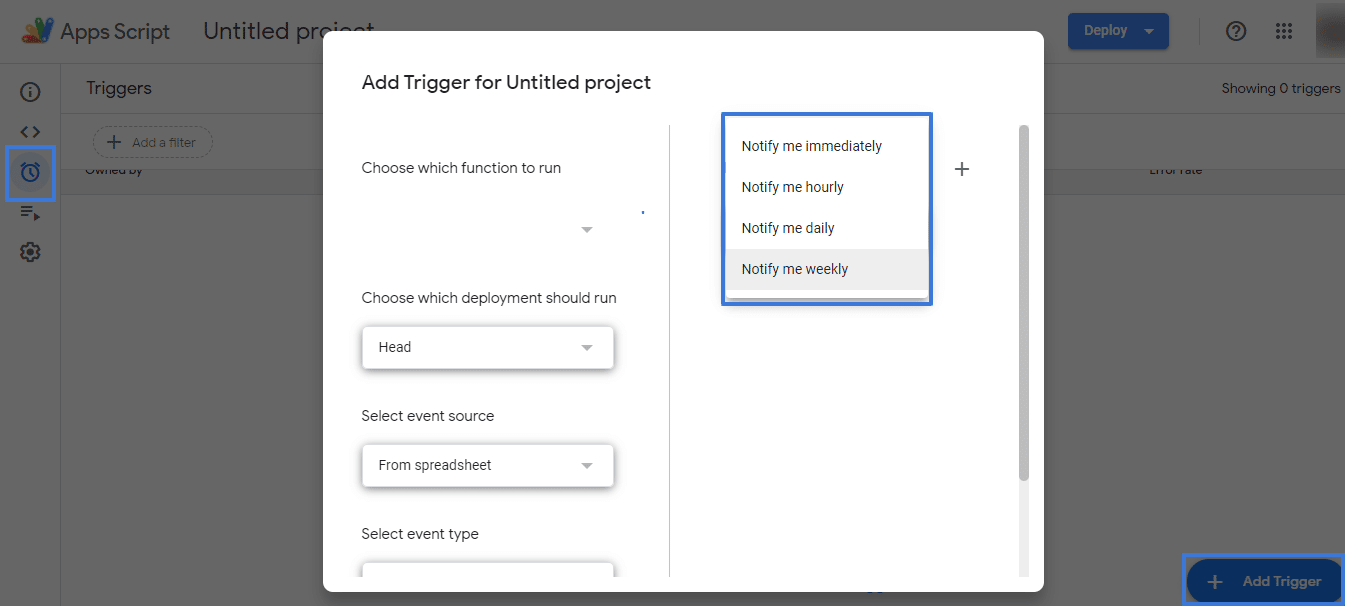
Save the trigger, and you’ll have an automatic reporting system that sends your sales reports to designated recipients regularly and automatically.
3. Using Coefficient
Coefficient provides one of the easiest ways to automate your sales reporting, from importing your dataset to keeping your reports live.
The app offers easy-to-use features to help you import and sync data on Google Sheets and other tools, such as HubSpot, Salesforce, analytics platforms, databases, and any supported spaces where your data resides.
You can pull up your data to Google Sheets with a few clicks and set up auto-refresh schedules. This keeps your sales reports, dashboards, and analytics updated.
Follow the steps below to automate your sales reporting with the help of Coefficient.
Step 1: Import data to Google Sheets
After installing the Coefficient app to Google Sheets, launch it from the Add-ons tab on the menu to open the sidebar.
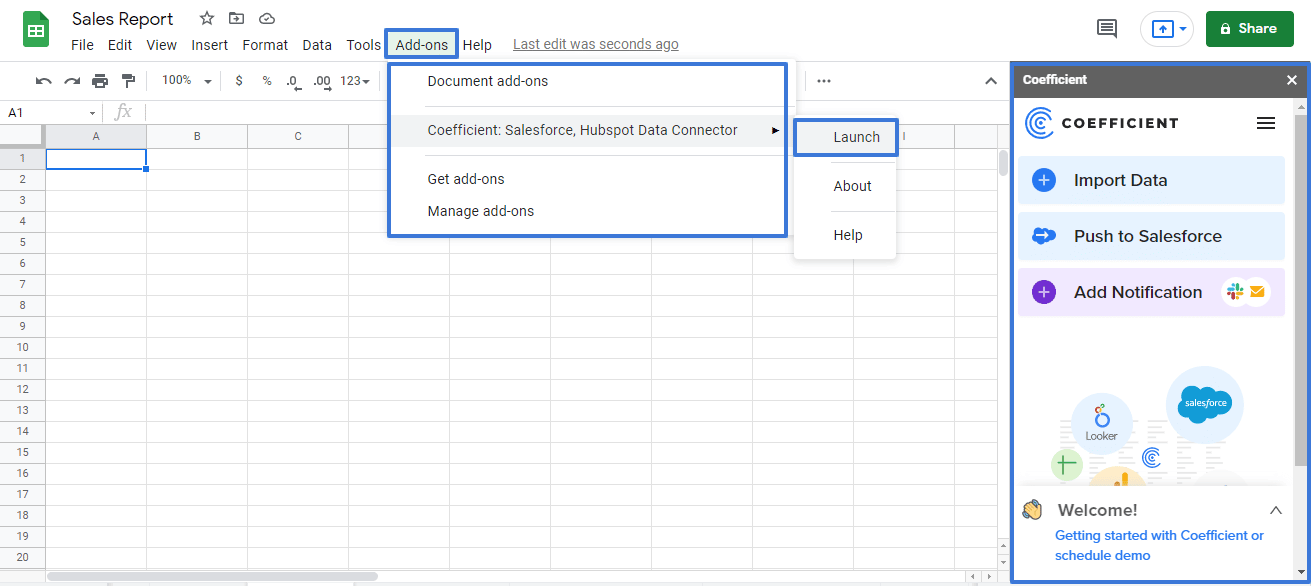
Pull up your data by clicking Import Data and choose your data source, selecting the objects you want to import, and choosing the fields. You can also add filters to specify your import data further.
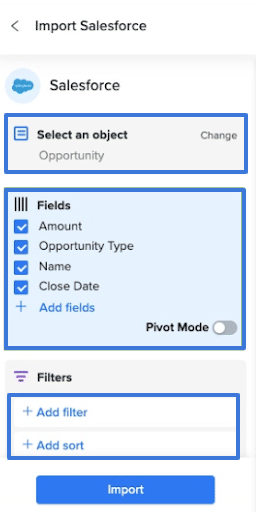
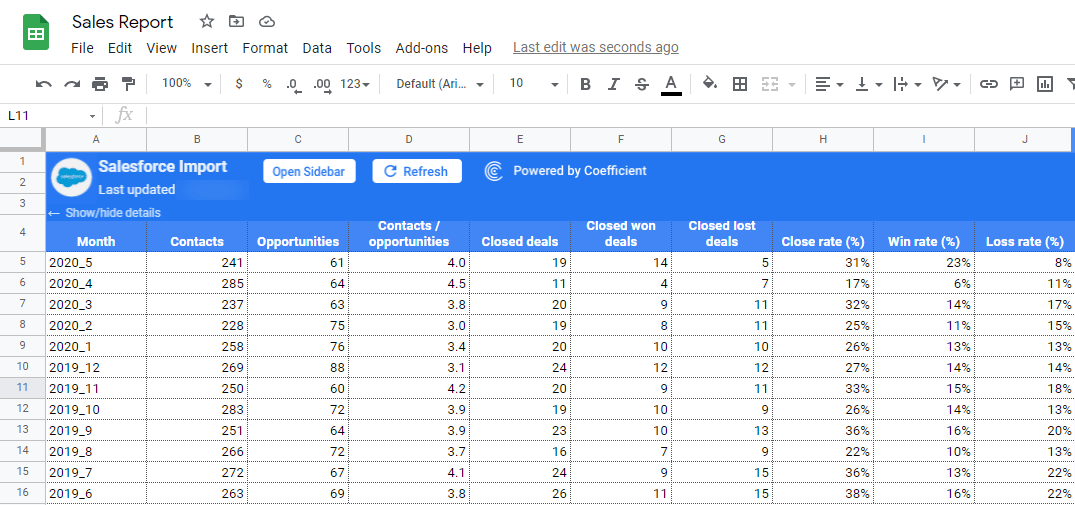
When you’re done, click import, and the data will populate your spreadsheet.
Step 2: Build your sales report charts and graphs
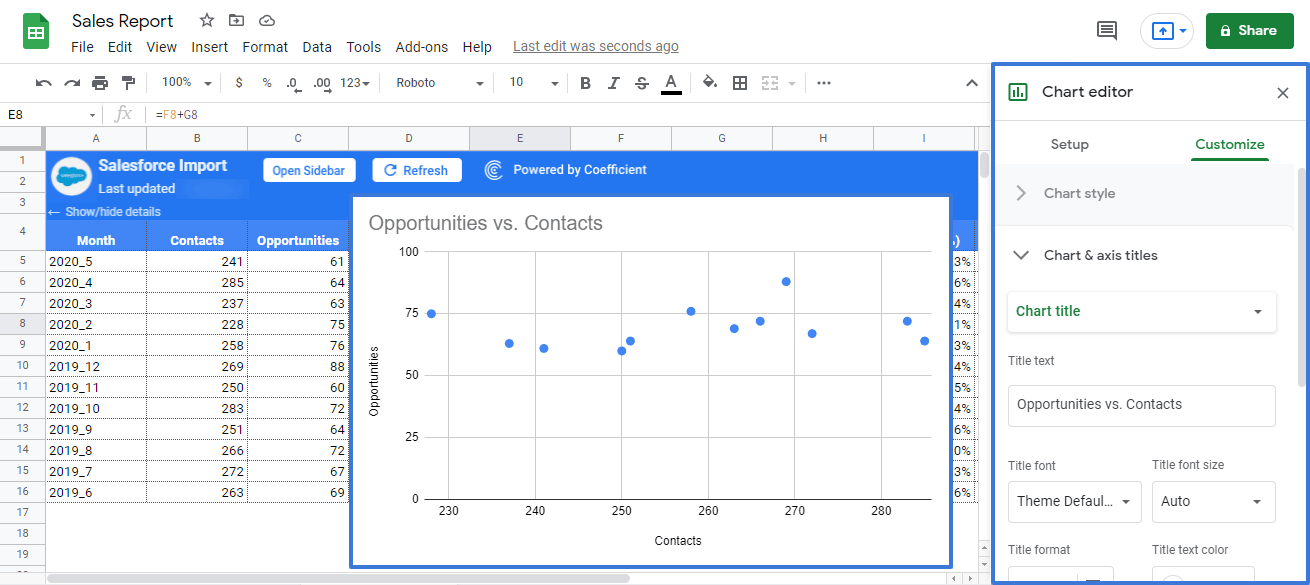
Create your charts and graphs by inserting a chart or using the Explore feature (follow the steps on inserting and customizing a chart in the methods mentioned earlier).
Use the Chart editor to customize your chart by adding texts, changing its appearance, style, and colors, and modifying the elements accordingly.
Step 3: Set up auto-refresh schedules and alerts
Coefficient lets you set hourly, weekly, or daily auto-refresh schedules so you won’t need to manually repeat your data imports every time your source data changes.
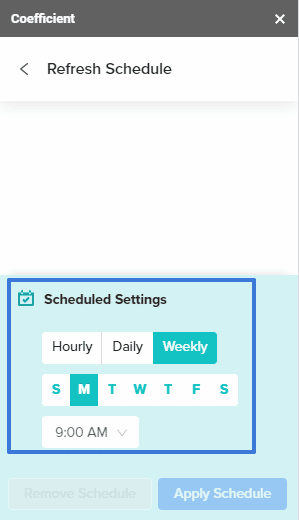
With this feature, your data syncs automatically to the latest version of your data source, so you get real-time sales report information.
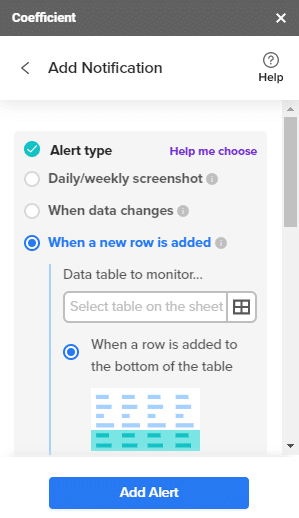
You can also set up email and slack notifications to send automated alerts when your sales data and reports get updated on Google Sheets.
Select the alert type, conditions, and frequency and add the recipients.
This is what a Slack notification from the Coefficient alert you set up can look like. 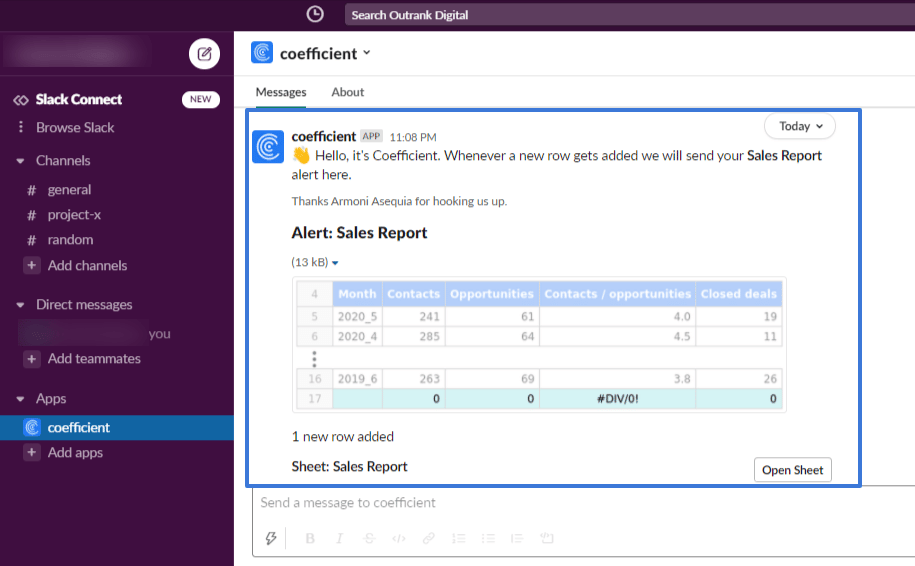
Coefficient saves you from the time-sucking, laborious tasks of moving and syncing your sales datasets while giving you a 360-degree view of your sales data in real-time.
Video Walkthrough: How to Trigger Slack Notifications from Google Sheets
Make sales reporting smarter and faster
Save your sales team from unnecessary stress and streamline your workflows by automating your sales reporting.
With automated sales reports, you get insights faster and you save time and money, which could be better spent on more critical aspects of your sales operations.
Leverage the power of Coefficient to supercharge the syncing of sales data on Google Sheets and keep your reports and analytics always updated.
This keeps you from missing any opportunities, improves your team’s overall efficiency, and helps you spot potential issues quickly and address them before they become bigger problems.
Try Coefficient for free today!


