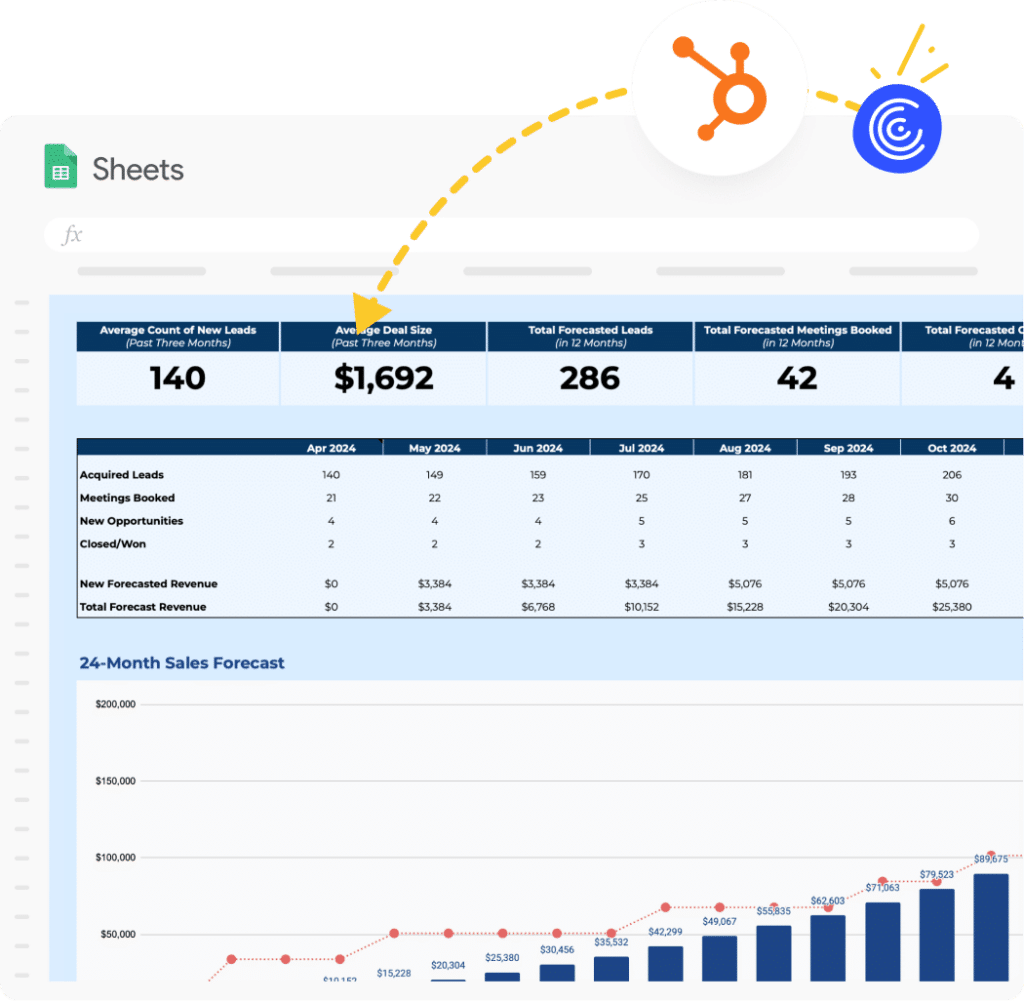
Sales forecasting is a crucial aspect of any enterprise. The practice helps companies visualize their sales pipeline and estimate sales revenue for the year.
However, automating sales forecasting is often easier said than done for many businesses. Obstacles such as data accuracy and disparate data sources make effective forecasting difficult.
That’s why we’ve created a sales forecasting template for Google Sheets to share with you! You can power this template with live data from any system, including HubSpot, Salesforce, database, or BI tools. Download the template for a pre-built automated forecasting solution, or continue with the video or step by step guide below.
Let’s dive in!
Video Walkthrough: How to Automate Sales Forecasting
A Step-by-Step Guide to Automate Sales Forecasting in Google Sheets
Coefficient not only simplifies your sales forecasting process but also automates it, saving you time and reducing errors.
Now let’s walk through how you can automate your sales forecasting process in Google Sheets.
Start by launching Coefficient from the extensions tab in the top menu of Google Sheets. Go to Extensions -> Coefficient -> Launch.
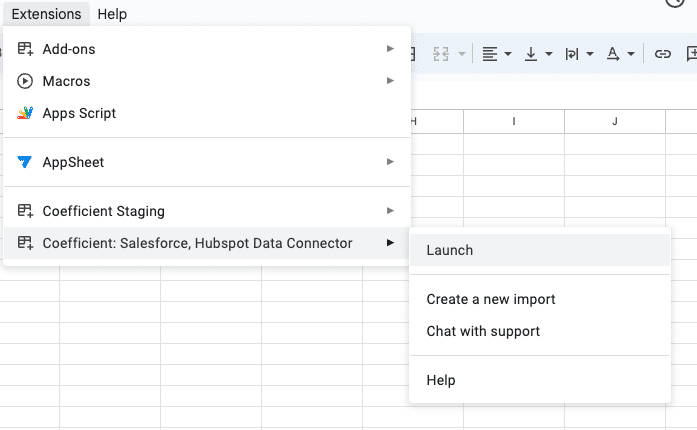
Once the Coefficient sidebar launches, choose Import from…

Next, select Salesforce as your data source.

Click From Objects & Fields.

Under New Import, choose the Opportunity object.

Choose Select fields…

Then select the required fields: ‘Name,’ ‘Close Date,’ ‘Forecast Category,’ ‘Stage,’ ‘Amount,’ and ‘Probability.’
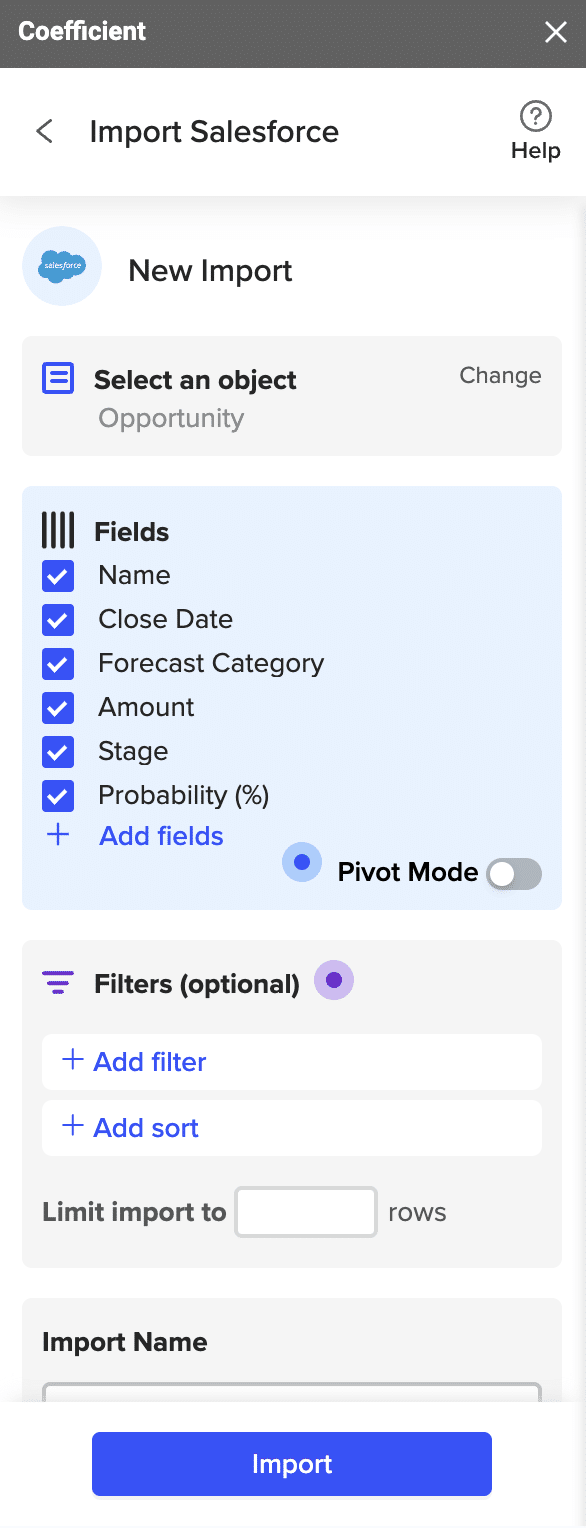
Once all the fields are selected, name your import. Then click import to send your data to Google Sheets.
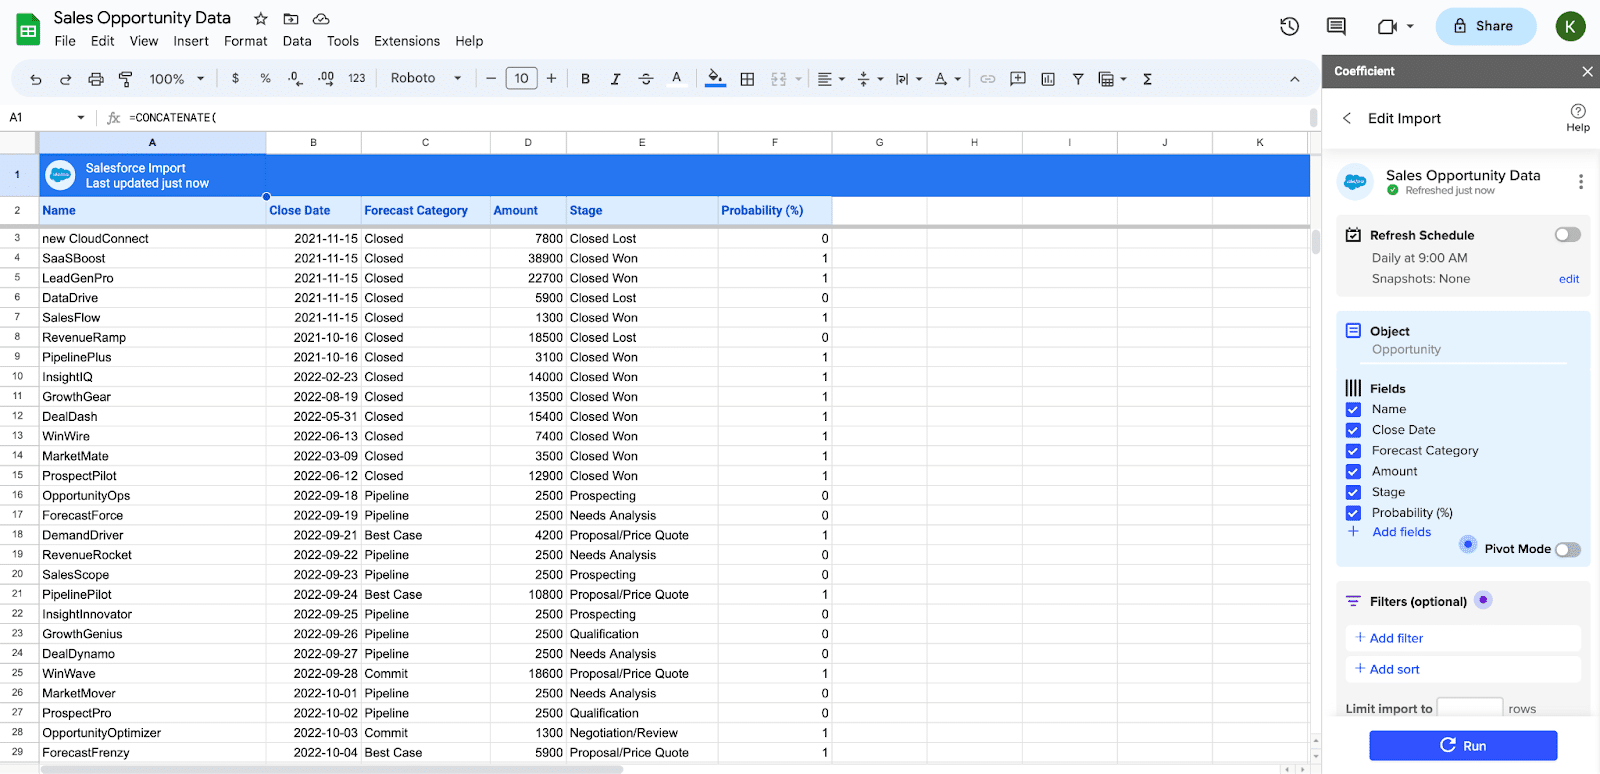
Now let’s add a calculated field to your import. First, select a new cell and label it ‘Forecasted Revenue.’
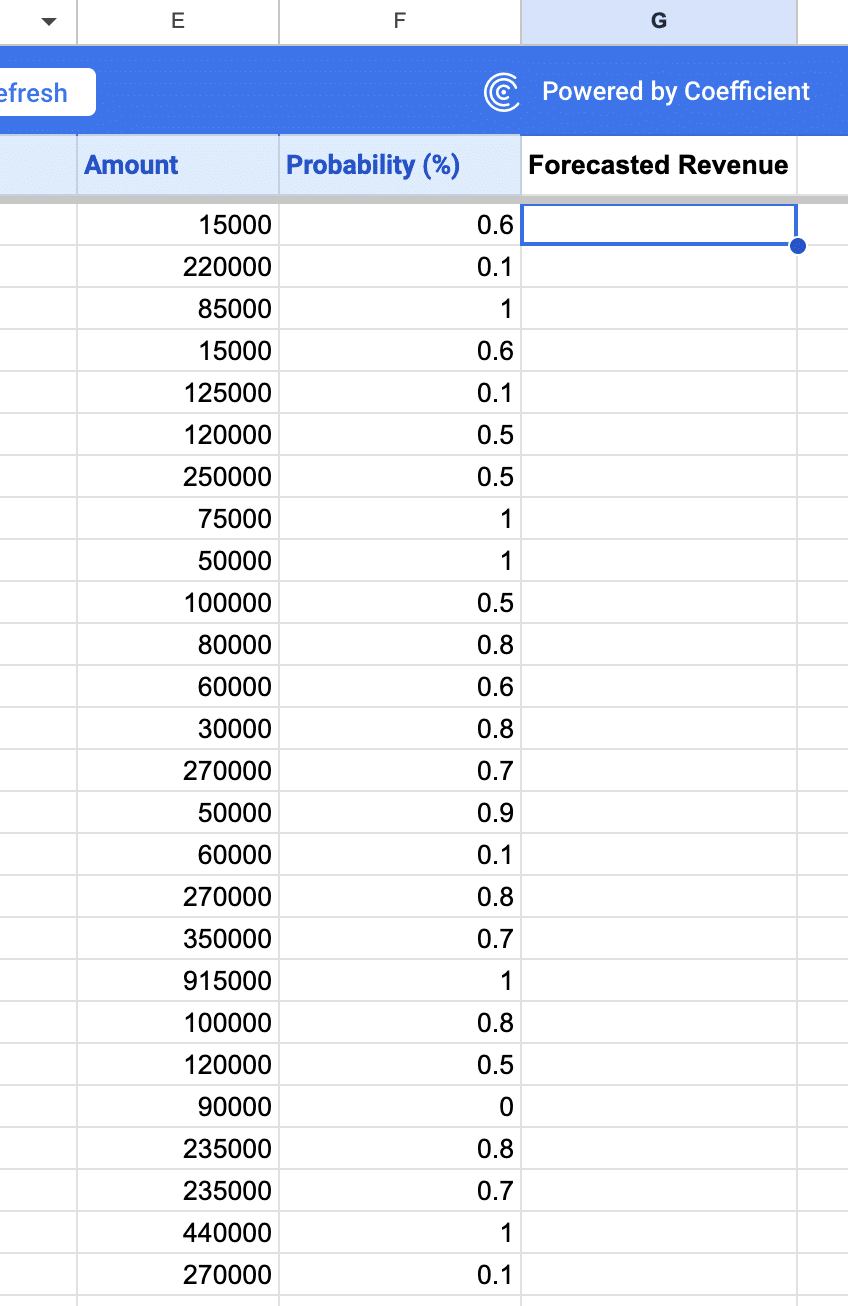
Forecasted Revenue can be calculated by multiplying your ‘Amount’ times your ‘Probability’ divided by 100. In this example, =E3*F3/100.
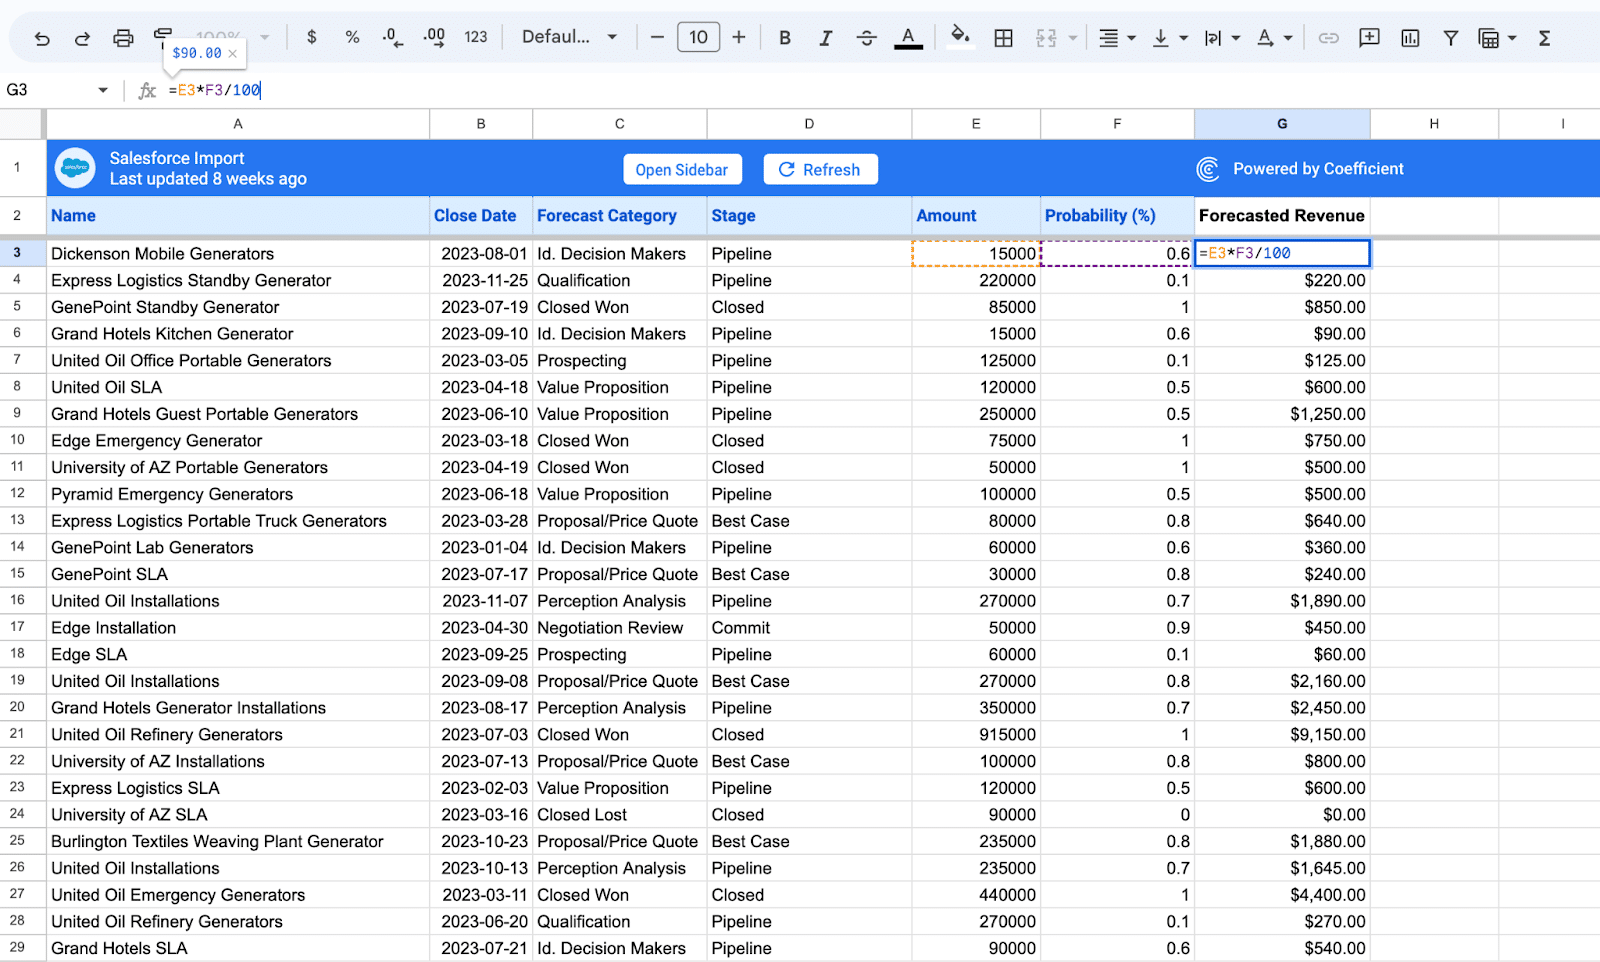
Drag the formula down the column to calculate forecasted revenue for each row.
Now, let’s build your analysis sheet by starting a new tab and labeling it ‘Summary.’
Next, assign each value. These are ‘Forecast Category,’ ‘Pipeline,’ ‘Best Case,’ ‘Commit,’ and ‘Closed Won.’
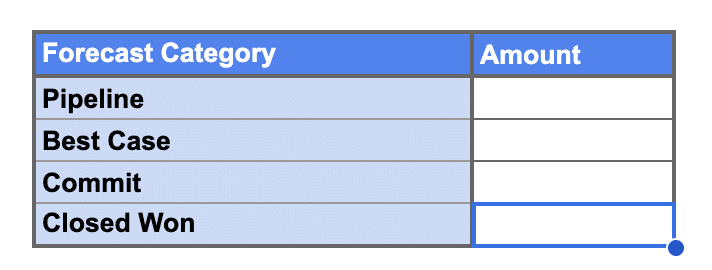
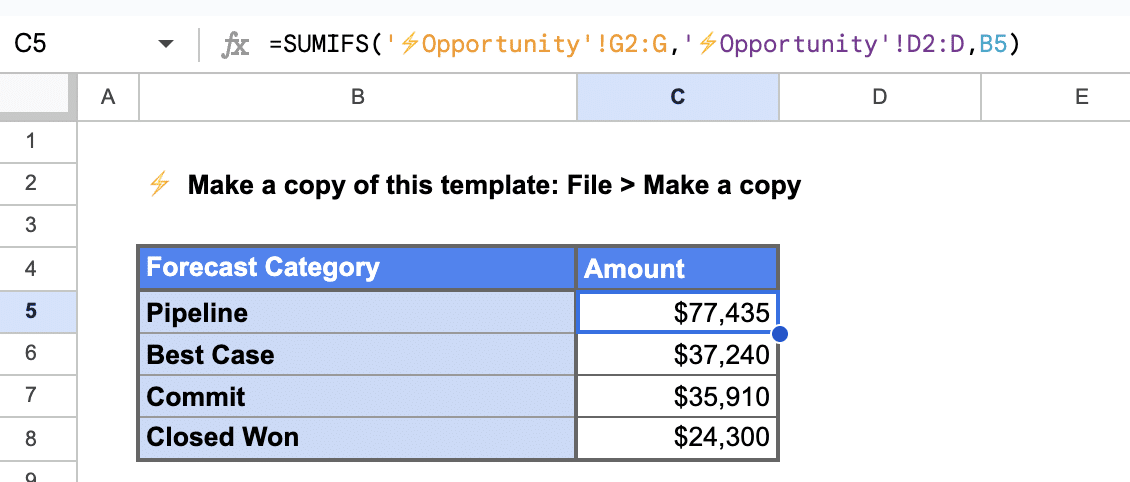
Now, create a table that sums the amount of forecasted sales revenue by Salesforce forecast category.
You can use the SUMIFS formula in Google Sheets to accomplish this:
=SUMIFS(‘⚡️Opportunity’!G2:G,’⚡️Opportunity’!D2:D,B5)
Finally, it’s time to visualize our forecasting data!
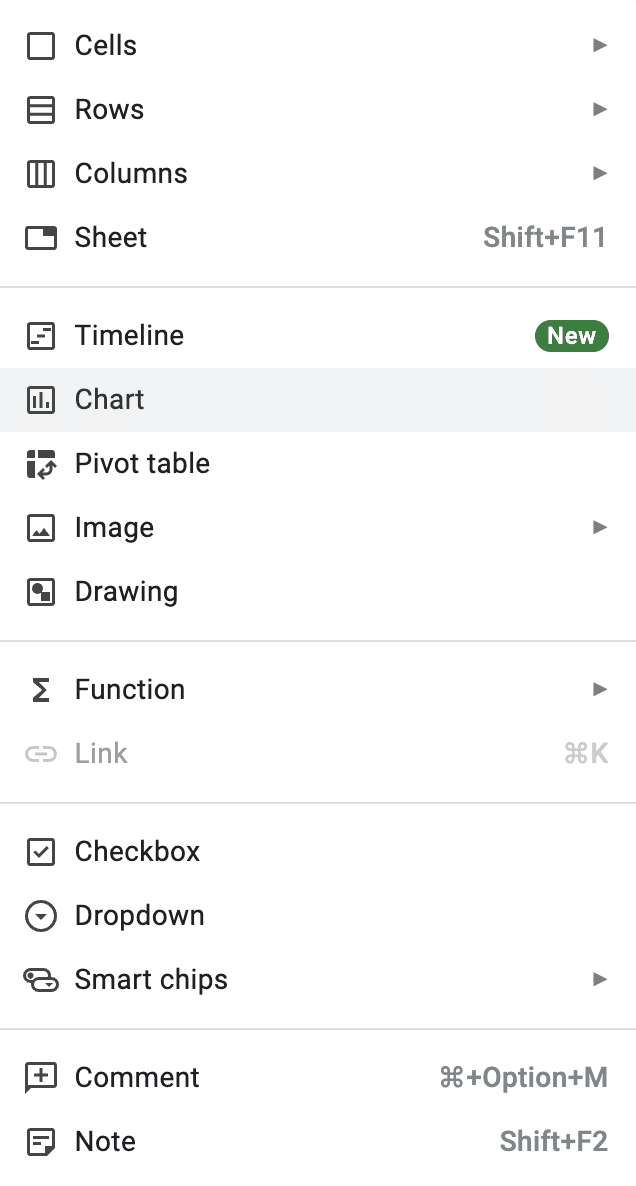
To do so, go to Insert -> Chart.
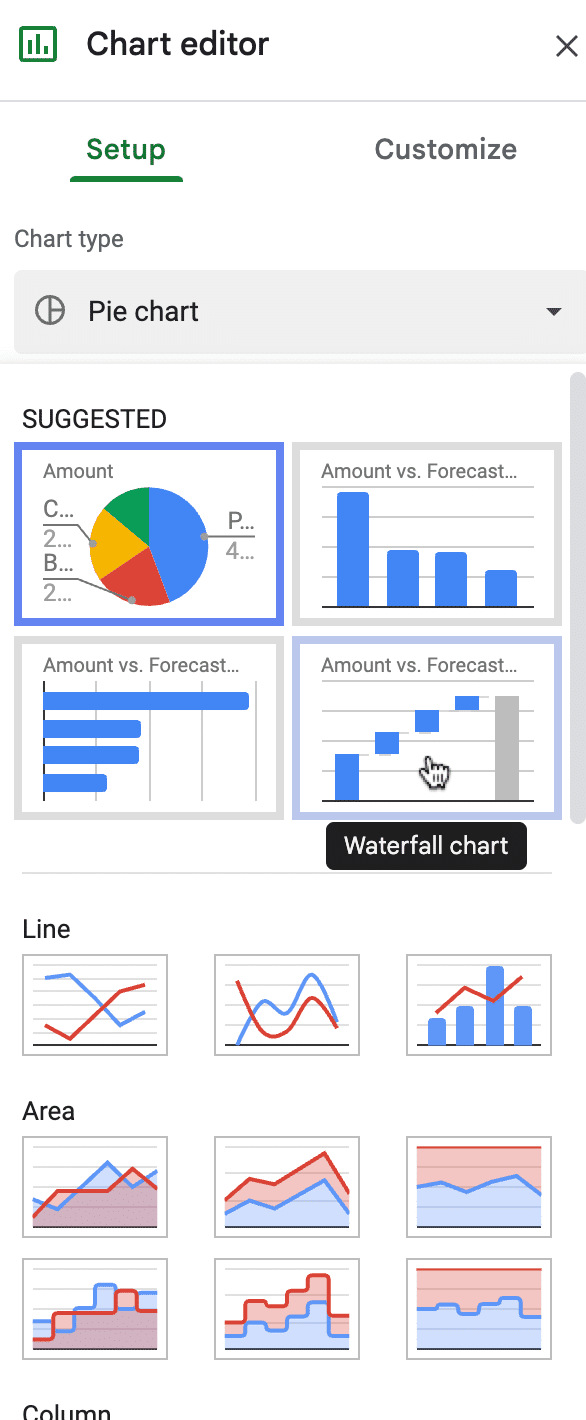
The Chart editor will appear. Choose the Waterfall chart.
This will display your estimated sales revenue by forecast category.
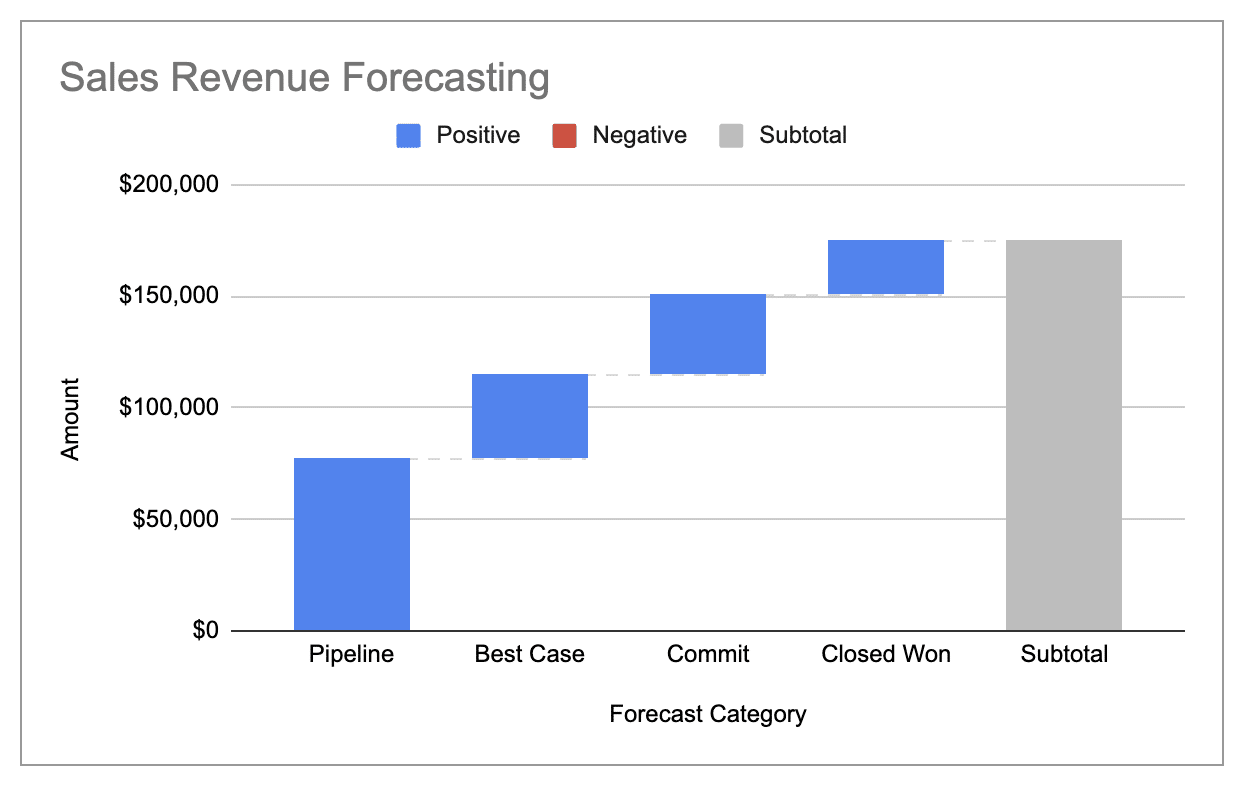
And there you have it!
With just a few clicks, you’ve been able to import your Salesforce opportunity data into Google Sheets and forecast your sales revenue automatically.
Simplify Your Sales Forecasting with Live Data in Spreadsheets
Automating sales forecasting isn’t as hard as it sounds. With Google Sheets and Coefficient, you can streamline the process and create a clear view of your sales pipeline and estimated revenue, powered by live data.
To automate sales forecasting in Sheets, all you need to do is follow the steps in this guide or download our free sales forecasting template.
And if you want to see how your spreadsheet can be powered by live data, get started for free with Coefficient to right now.


